
Global Roam and Greenview Strategic Consulting have released the third edition of the Generator Statistical Digest (GSD2020). The digest contains a comprehensive 10-year set of monthly data for every registered generating unit in the NEM that operated in the 12 months ended December 31, 2020.
The information is presented in a clear and comprehensive fashion with full and useful explanations of all terms. For those liking reference works the glossary alone is valuable.
If there is an area for improvement, it’s finding a way through the herculean task of quantifying behind the meter generation.
It’s a pleasure to highlight a few of the data items that emerge from this year’s digest and I’d like to thank the publishers for making an advance copy available for review.
In electricity most of the time the desire is to maximise profit, not to top some arbitrary list. Occasionally the purpose is to provide insurance or portfolio value.
However in looking through some sorted lists from the GSD its nevertheless interesting to highlight a few items.
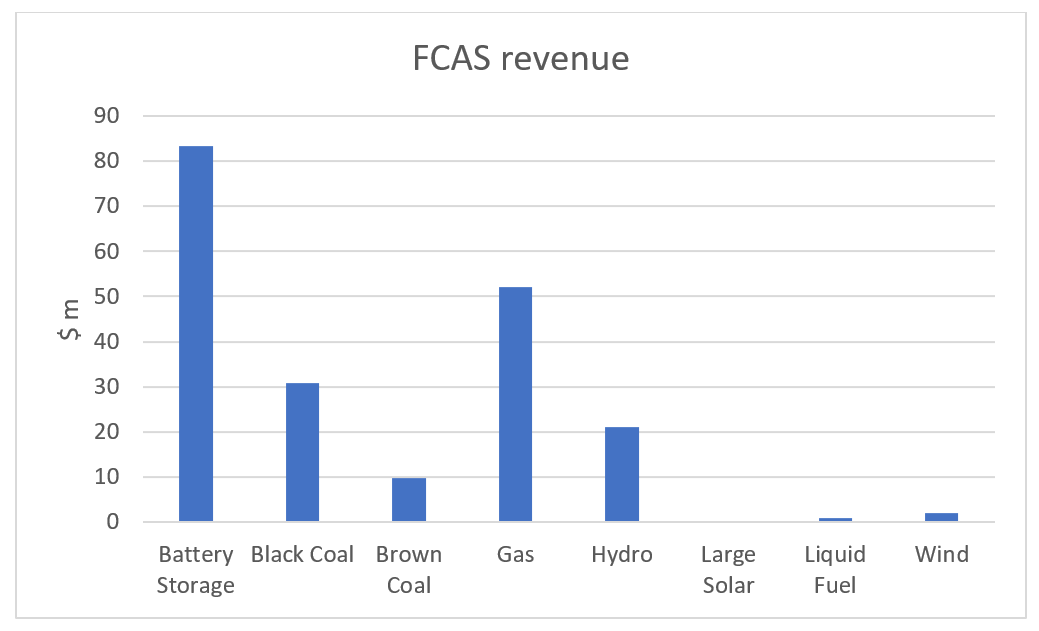
Rankings – FCAS
The first of these will be no surprise and that is how batteries are dominating the FCAS market. And that’s today’s FCAS market. The markets for future FCAS, when AEMO and the AEMC finally realise that a new control scheme is required for the NEM as we move towards a dominance of inverter-based supply, will likely be completely dominated by batteries or other energy storage. Even gas which is in second place this year will possibly struggle to keep its role in FCAS when 5-minute settlement takes over.
Note that the GSD2020 covers all units that were active in the Energy Market in 2020, so Demand Response Aggregators (which for 2020 were not active in the Energy Market – only in FCAS) are not covered in the statistics.
Hornsdale was the largest FCAS earner and South Australian based suppliers dominated but this will change as more batteries are installed in other States. Of the coal generators Vales Point has been the main FCAS supplier in 2020.
Rankings – Capacity Factors
Next we turn to capacity factors and these are just lists so we need to be careful about observations.
Just two black coal stations managed over a 70% capacity factor in 2020, Kogan Creek an excellent 78%, and Bayswater Unit 1, 71%. Kogan Creek was the only QLD station to make the list.
By contrast 5 units of brown coal achieved 80% or better – putting 2019’s troubles behind them.
- They were and lead by Loy Yang B Unit 2 at (a close-to-theoretical-best) 94%.
- Alinta has really shown what a good manager it is, or perhaps LYB is just a great station for efficient operation?
In analyst spreadsheet models, of which I do many, solar farms are capable with a high DC/AC ratio of getting to a capacity factor of 30% or even 32% and wind farms in the low 40s.
However in 2020 the best solar farm capacity factor was 29% (achieved by Rugby Run and Griffith) achieved only 29% – and in joint 5th place at 27% were Numurkah, Bungala 1, and Ross River.
Of the wind farms, Windlab’s ability to pick winners showed up as the small Kiata windfarm achieved the No 1 ranking (45%). It is usually in No 1 spot. Not many Wind Farms managed a 40% or better capacity factor in 2020, with the others being:
- Hornsdale 1 Wind Farm (40%)
- Silverton Wind Farm (41%)
- and Waubra Wind Farm (45%).
Rankings – Constraints
Then lets turn to constraints.
The data clearly shows that black coal and brown coal are not significantly constrained with Stanwell unit 2 constrained for 675 hours 7.8% by contrast Pelican Point, a gas station, was constrained for 2078 hours (23% of hours in a year) and Brigalow (Maryrorough) solar farm for 2025 hours.
Worst though was wind with the unlucky Mt Emerald Wind farm constrained for 2410 hours (27.5%), Murra Warra 2356 hours and on down to No 5 spot Crowlands which was still facing 1304 constrained hours.
In ITKs opinion there needs to be a balance between:
- the portfolio contribution a wind farm makes to portfolio variance (predictability of the portfolio output) and
- the cost of transmission.
Nothing points to the benefits of Renewable Energy Zones like good wind and solar farms being constrained for ¼ of the year.
Rankings – Output Data
In looking at the output data (that is the total volume) there are some obvious conclusions, namely each coal unit tends to have a lot of volume, with Kogan Creek being the biggest producer in the NEM at 5.3 TWh (or 2.5% of total NEM wide production).
There are also some surprises.
For instance Coopers Gap, despite being not fully commissioned during the year was the largest wind producer (close to 1 TWh) and well ahead of the Sapphire and Macarthur wind farms. Once again Coopers Gap was a site identified by Windlab.
The highest producing solar farm was Daydream, but at 0.35 TWh it’s still a minnow compared to the coal generators. Still that’s not the way to think about solar. As the behind the meter industry shows, its the collective not the individual that matters for solar panels.
Rankings – Price
Finally we turn to price.
These are VWA Price, which is:
- ‘Hypothetical Spot Revenue’/Volume (with the ‘Hypothetical Spot Revenue’ calculated as if the unit’s MLF was 1.0);
- and so is useful for comparing numbers between different projects to gain a sense of which projects (of a type) are better at capturing good prices
- but they are unlikely to have anything much to do with the profitability of projects.
The highest average price in the NEM went to Hunter Valley Gas Turbine at $2,433.30/ MWh and number two spot was Eraring Gas Turbine ($1,944.50/MWh). The output of both units is tiny.
Unsurprisingly, at least to me, was that the five worst VWA Prices were all recorded by solar farms with Yatpool receiving $15.93/MWh on average for its output (and that’s not taking into account the MLF). Solar LCOE is low but not that low.
Equally interesting was to look by fuel at the spread between high price units and low price units. I took the median of the highest 5 and the median of the lowest 5 prices for each fuel and ended up with the table below:
| Spread between high and low pool prices by fuel | |||||||
| $/MWh | Black Coal | Brown Coal | Gas | Hydro | Large Solar | Liquid Fuel | Wind |
| Median high | 62 | 47 | 736 | 133 | 68 | 522 | 56 |
| Median low | 36 | 45 | 38 | 34 | 18 | 59 | 27 |
| spread | 26 | 2 | 698 | 99 | 50 | 463 | 29 |
| Low / high | 58% | 96% | 5% | 26% | 26% | 11% | 48% |
There were a number of things in the table that would be interesting enough to examine further. In no particular order:
- Some gas stations received surprisingly low VWA Prices (in QLD).
- Some solar farms actually received pretty good VWA Prices with the best being the Wellington solar farm at over $80/MWh (but this project is only just in commissioning)
- The spread between the best and the worst solar and wind farms was large. It was even larger in gas and liquid fuel but that reflects the different roles some gas stations have to play and so comparisons are less relevant. Wind and solar farms produce as available for the most part and so the spread is more likely to reflect:
- commissioning (or other technical issues onsite); and
- location; and
- correlation with demand.
- Capital Wind Farm in NSW saw the highest VWA Price for wind farms ($57.62/MW), with Boco Rock Wind Farm – another NSW farm – not far behind ($56.46/MWh).
- In general, it was a good year to be located in NSW from the point of view of average pool price and that applied to all fuels. A rising tide as they say, floats all boats.
————————————–
About our Guest Author
 |
David Leitch is Principal at ITK Services.
David has been a client of ours (and a fan of NEMreview) since 2007. David has been a long-time contributor of analysis over on RenewEconomy, very occasionally contributes to WattClarity! David also provided valued contribution towards our GRC2018. David has 33 years experience in investment banking research at major investment banks in Australia. He was consistently rated in top 3 for utility analysis 2006-2016. You can find David on LinkedIn here. |
Leave a comment