Alternative (but quite lame) article title ‘Ho, Ho, Ho, Hot in the NEM’ perhaps, given today’s timing?
(A) Two different seasons
This article has taken 6 or more weeks to pull together (in between other points of focus) … we started on it a bit before the official commencement of summer 2020-21 … and during that time it’s like we’ve seen two different seasons alternate:
| Season Type 1 … Heatwave rolling through… |
Season Type 2 … Cooler and Wet … |
| We’ve seen earlier blasts of heat from mid-November … some early indications have revived memories of what happened in summer 2019-20, with extreme heat conditions leading to massive bushfires – and plenty of stress on the NEM on several fronts (not the least of which being these 4 headline challenges).
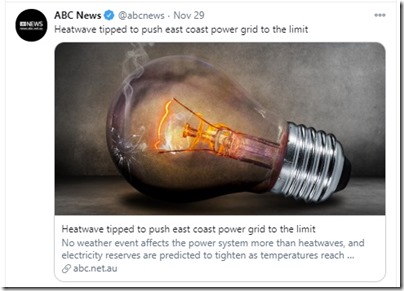
For instance, I saw an ABC article on Sunday 29th November via Twitter talking about pushing the grid ‘to the limit’: … and a day later the AFR talking about ‘east coast heatwave challenges power grid’, also via Twitter: Which prompted me to think ‘It’s getting hot in the NEM ’ … both literally, and metaphorically.
|
However we’ve also seen the effects of the La Nina weather pattern.
For instance, I saw that Peter Hannam wrote about as ‘strongest signals for 10 years point to a wet, flood hit summer’ on Monday 7th December: Supporting this prognosis, there have been some days of decent rainfall in different parts … much more than we saw in summer 2019-20. .
|
Given a few other developments in the NEM, it seemed useful to post this article (albeit a few weeks later than initially envisaged).
(B) Recapping the effects of high temperatures
Let’s start by recapping some of the effects of high temperature on the electricity grid, and hence the National Electricity Market:
| . | What happens, technically, as the temperature rises | How this is sometimes represented (or perceived) | Recent Developments to be aware of |
| Consumption Side of the Market/Grid |
It’s pretty well understood (even across a very diverse group of National Electricity Market spectators, commentators and other stakeholders) that the overall level of Underlying Electricity Consumption rises during periods of extremes in temperature – either: |
In years gone by, there was a fairly direct relationship between increased temperature and heightened Grid Demand for electricity. This was also quite widely understood. This was so much the case that we used to fairly regularly give away a BBQ each year to the ‘Best Demand Forecaster in the NEM’, as a bit of Christmas frivolity (which some readers took surprisingly seriously, mind you). This pattern started changing over 10 years ago, for a number of different reasons. In more recent years, perhaps the largest effect has been from increased self-supply from embedded generation (particularly rooftop PV), which: |
These counter-acting forces are combining to present some challenges to the AEMO in operating the market, and managing the grid. This is not just a high temperature thing – in October the AEMO released ‘Operational management of low demand in South Australia’, for instance. Dealing with times of extremes in temperature, there is a growing challenge because of the imperfectness of the overlap between high temperatures (which can persist into the evenings) and solar harvest times … particularly on rooftop PV which has been mostly incentivised, to date, to face north and so fade out earlier in the afternoon than would otherwise be the case. The result of this is the increasingly steep (and complex to predict) requirement for ramping of dispatchable capacity to (possibly switch on and) ramp up to meet the evening peaks in grid demand through summer evenings. Expect to see significant further investment made by many parties to meet the challenges presented here. We’ll certainly be doing this with the software tools (like ez2view) a growing number of wholesale participants and others use! |
| Supply Side of the Market/Grid |
On the supply side of the NEM, however, there’s a greater level of confusion about the effects of extreme heat. This was so much the case that we invested time to contribute a lengthy article on 11th February 2020 about ‘extreme temperature effects on generation supply technology’. We did not cover transmission and distribution infrastructure, but that suffers in its own ways (for instance, high temperatures cause transmission cables to lengthen, which can lead to sag to the point where carrying capacity is reduced). These effects were certainly seen through a dramatic summer 2019-20, particularly in these 4 Headline challenges. What happened over that summer, and some of the articles we contributed, led to an request that I speak at an AIE event in July on ‘performing under (heat) stress’ amongst other things. — The important point to note is that pretty much all types of supply technology significantly employed in the electricity supply industry are negatively affected by heat … just in different ways. |
From what we see, there are several different layers of confusion, or general lack of understanding. Layer 1 = general lack of understanding As a business we are focused on B2B (though we do have a share of ‘Joe Public’ who call in, prompted to do so via the insights they generate via the various free-access widgets we have provided on the web). So we’re pretty sure we only see a very small percentage of the types of conversations the B2C facing organisations (like the DNSPs and the Retailers) do when power delivery to residential users is stressed because of extremes in temperature. Physical stress on the assets coincident with mental (and real physical) stress on the over-heated Jane Public consumer are not good combinations – we see a small percentage of this on social media and can only feel for those on the front line. Layer 2 = ideologically driven perspectives As the name suggests, those at the extremes of the Emotion-o-meter tend to base perspectives and decisions more on emotion than on reason. In one particular example, there seems to have been a concerted effort by some to lead people to think that hot weather somehow predisposes large thermal units (particularly coal) to somehow be more likely to trip. Unfortunately: Because of an underlying confusion about the impact of how two separate factors (Probability and Consequence) both combine to determine Risk, this misunderstanding has been able to propagate (to the detriment of all). |
There are several developments that I’d like to make you aware of, and which prompted this particular article. These are discussed further below. Note that these types of high-temperature effects will be assessed again with results for calendar 2020 in our upcoming Generator Statistical Digest 2020. —————— Reminder of a couple weeks left to save For a few more weeks (until release) you can still save $300 exGST on the final release price if you pre-order the GSD2020 now prior to the date of release. |
(C) Three recent developments
Some quick notes about three developments we’ve spotted in the last couple weeks, and think that our readers should be aware of;
(C1) The new AEMO high temperature warnings
Beginning late in November, AEMO started sending out a different form of high temperature alert via its Market Notices system:
(C1a) How they work now
The AEMO has prepared this page on their website that provides an explanation of how the process works now … and gives some clues as to why we are seeing more of these this summer than we did in prior summers.
As an example, I’ve copied in Market Notice 801598, which was published earlier today:
________________________________________________________________________________________________
Notice ID 81598
Notice Type ID Subjects not covered in specific notices
Notice Type Description MARKET
Issue Date Thursday, 24 December 2020
External Reference NEM Local Temperature Alerts for SA, VIC from 24 Dec 2020 to 28 Dec 2020
________________________________________________________________________________________________
AEMO ELECTRICITY MARKET NOTICE
AEMO’s weather service provider has issued forecast temperatures equal to or greater than the NEM Local Temperature Alert Levels for listed weather stations below.
SA
Port Augusta Ap (39+ Deg C): 26th Dec, 27th Dec
VIC
Mildura Ap (39+ Deg C): 27th Dec
The NEM Local Temperature Alert Levels are:
Launceston Ti Tree Bend: 33 Deg C, Dalby Airport: 37 Deg C, for all other selected weather stations: 39 Deg C.
AEMO requests Market Participants to:
1. review the weather forecast in the local area where their generating units / MNSP converter stations are located and,
2. if required, update the available capacity in their dispatch offers or availability submissions consistent with the forecast temperatures.
Further information is available at:
AEMO Operations Planning
________________________________________________________________________________________________
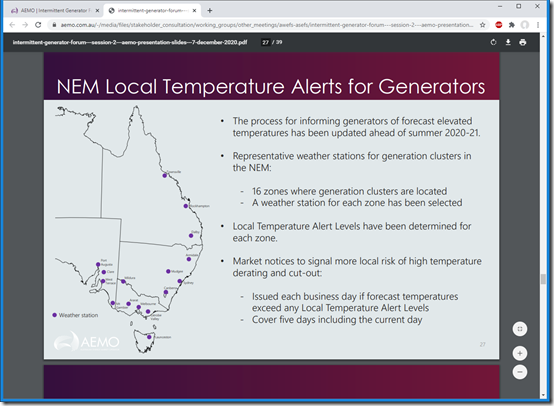
The key point is that the AEMO has now selected 16 different BOM measurement points that are, they believe, representative of a localised temperature that would cause high-temperature affects at different groups of generation plant.
(C1b) What they have changed from … and why
In prior summers, high temperature alerts tended to focus on the forecast temperature at a BOM reference station close to the Regional Reference Node inside the region (which correlated with capital city, for most regions), plus another for the northern end of Basslink.
Through the work we’ve done (in collaboration with Jonathon Dyson’s GVSC team) in publication of the Generator Report Card 2018, and then the follow-on Generator Statistical Digest 2019, we have helped to sharpen the focus of the effect of extreme temperatures on generation plant … and particularly the increasing role of high temperature local to the particular generation asset (which are becoming increasingly geographically dispersed, as also discussed in the GRC2018).
In the GSD2019, we extended our analysis by providing a discrete ‘Temperature Effect Chart’ on the ‘B’ Pages for every single DUID operational in the NEM at some point in 2019. This used a ‘closest to’ match for reliable BOM measurement point … and is something that will be repeated for the (larger set of) DUIDs operational in 2020 in the up-coming GSD2020.
In Marcelle’s article last Friday (18th Dec) she mentioned the two sequential sessions AEMO conduced as this year’s ‘Intermittent Generator Forum’:
1) On the second of these sessions (Monday 7th December 2020), Marcelle was asked to speak, to provide this guest perspective:
—————————————
Somewhat related to this particular topic Marcelle also posted four snippets in the same week:
1st Snippet = on Monday 7th December asking ‘Do you know your obligations as a Semi-Scheduled Generator?’
2nd Snippet = on Tuesday 8th December this short refresher on the difference between Compliance (the AER’s domain) and Conformance (an AEMO process). Both of these are important.
3rd Snippet = on Wednesday 9th December ‘How does a wind or solar farm make money?’
4th Snippet = On Thursday 10th December, ‘PPAs aren’t as easy as they used to be!’
These followed from the sessions Marcelle and Jonathon Dyson had conducted for the Clean Energy Council during the year:
(a) First session for Solar Farm operators on 21st May 2020.
(b) Second session for Wind Farm operators on 17th September 2020.
—————————————
2) Earlier in the session on Monday 7th December 2020, the AEMO spoke about this change … and helpfully presented this slide that spoke about the the move from 5 reference temperatures to those representing 16 zones:
Based on our number crunching (noted above) it’s clear that moving from 5 to 16 reference points will deliver a much better view … but still would not be perfectly accurate. However we also understand the need to make the Market Notices (and Local Temperature Alerts in more general terms) intelligible and not overly noisy, so that a compromise approach needed to be made.
I would think that many generators would also be watching the more localised temperatures more closely in future, in order to ensure that they continue to keep the AEMO informed of possible high temperature effects onsite. We will certainly review with interest the historical results we assemble as part of the GSD2020.
(C1c) Alerts that have been published in November and December
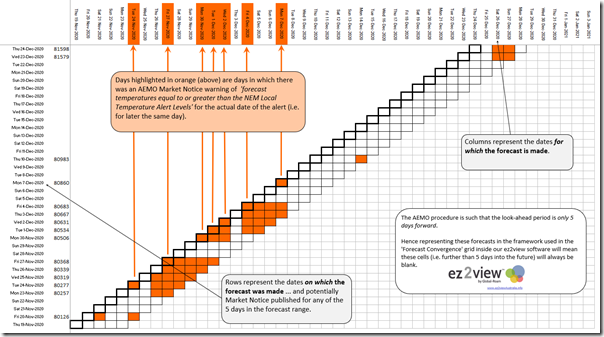
Out of curiosity about the data itself (and also because we are exploring ways to extend the ‘Forecast Convergence’ widget in ez2view version 8) I invested some time to piece together the pattern of alerts in a grid structured the same sort of way as used in the ‘Forecast Convergence’ widget. This is included in the image below:
Note that these cells were coloured when an alert was issued by AEMO for any of the 16 x zones now used for temperature alerts, so the data concept is actually over 16 layers.
The most common alerts appear to be (thus far):
1) for Dalby in southern QLD (nearby to the Darling Downs CCGT and Darling Downs Solar Farm, to Oakey GT and the Oakey 1 Solar Farm and Oakey 2 solar farm, and even presumably representative of Kogan Creek and Millmerran coal-fired plant, down closer to the border).
2) For Port Augusta in northern SA (the reference point for plant located all the way around to Port Lincoln GT)
3) For Mildura in north-western VIC (the reference point for many plant located in the ‘Rhombus of Regret’
(C1d) Requirements for Semi-Scheduled operators
It’s not AEMO who says this, but my interpretation … however I believe wasn’t just coincidence that the AEMO hosted a forum for stakeholders involved in Intermittent Generation assets over two consecutive Mondays leading into summer 2020-21 on the
At least in part, the reason for this direct approach can be read into the remarkable Market Notice 72015 published on 23rd December 2019 in which AEMO spoke directly to some operators of Wind Farms and Solar Farms:
(1) Who were:
(a) in some cases, unaware of some of their requirements as a registered generator;
(b) or, in other cases, did not understand enough to navigate the AEMO’s various systems (covering both Bidding and AWEFS/ASEFS); or
(c) were not aware of high-temperature limitations of their own machines.
(2) But which, as a result, resulted in the broader market being ‘caught with its pants down’ when a sizeable amount of wind generation that AEMO had been counting on its forecasts did not eventuate at real time … because the of ‘High Temperature Cut-Out’ at a number of different wind farms that AEMO had not been alerted about. This was discussed in this WattClarity article on the following day:
… after the end of the quarter, it also was discussed in the AEMO’s QED at the time… and then in other places.
(C2) The AER’s Summer preparedness guide
Coincidentally also in the same week of that 2nd AEMO session (on Tuesday 8th December) we received an email from the AER about their ‘NEM Summer Readiness compliance bulletin and checklist’ which I read as a parallel attempt to ensure that all generators (but perhaps the new entrant Semi-Scheduled ones in particular) understand their Compliance obligations.
This news alert contained links to the following two documents:
(C2a) NEM Summer Readiness Compliance Bulletin – Dec 2020
Linked within was this 20-page Summer Readiness Compliance Bulletin dated December 2020:
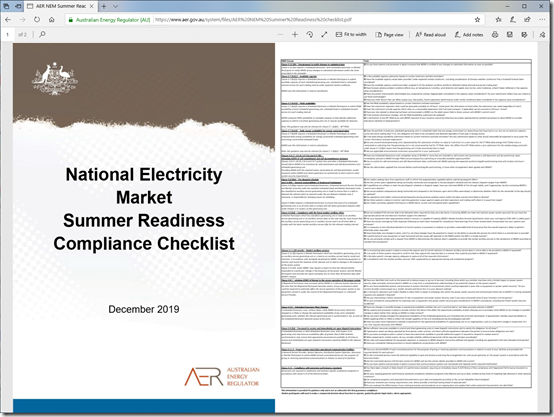
(C2b) NEM Summer Readiness Compliance Bulletin – Dec 2019
There’s also this 2-page Summer Readiness Compliance Checklist (which is dated December 2019, which I presume is still current because nothing has changed from the AER’s perspective):
(C3) Release from the AEC and the ENA
I also noticed in the same week that the AEC and the ENA together jointly released this Fact Sheet ‘Heatwaves and electricity supply’.
(D) How we have explored high temperature effects
As alluded to above, we’ve covered high-temperature effects on generation plant in a number of ways, including the following;
(D1) In the GRC2018
In the Generator Report Card 2018 (the first such edition in a growing series) we explored high-temperature effects using nearest BOM temperature records and matching them to normalised Capacity Factor (using registered capacity) across the years 2016, 2017 and 2018 in aggregate.
This analysis was presented for most fuel types within the Fuel Type Aggregation section of Part 4 within the 180-page analytical component of the GRC2018. It showed some results that would be surprising to a number of readers … and led to further questions that we sought to address in what came next.
(D2) In the GSD2019
We took some of the learnings from the GRC2018 in informing the way in which we prepared the Generator Statistical Digest 2019, and particularly focused on high-temperature effects on every single DUID (all fuel types, and also Scheduled Loads).
Some results for individual units (understanding there were more than 300 in total) have been presented in discrete articles on WattClarity since the release of the GSD2019 in late January 2020.
(D3) In the GSD2020 (coming soon … still a couple weeks to save $300)
As noted above, we’re repeating the process of the GSD2019 and will release the Generator Statistical Digest 2020 on or around Wednesday 27th January 2021. Copying from the GSD2019, this will have a particular focus (with data for CAL 2020) … and we’ll be kicking off the data crunching exercise in our ‘BEAST’ database engine on Friday 1st January 2021 (rapidly approaching).
For a few more weeks (until release) you can still save $300 exGST on the final release price if you pre-order the GSD2020 now prior to the date of release.
A big thanks to the growing number of people (new and old) who have provided us with their pre-orders already.
(D4) GRC2020 (possible)
We’ve not yet committed to making a Generator Report Card 2020 but, if we did, we would be sure to drill in even deeper (possibly with reference to the AEMO’s chosen 16 different measurement locations).




Be the first to comment on "Temperature Alert!"