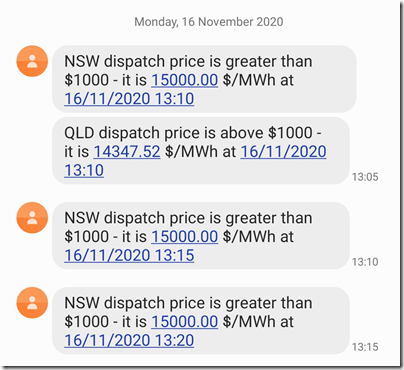
I don’t have much time to dig into this at present, so here’s a few snapshots from our ez2view software package, starting with the SMS alerts received as I was finishing my lunch:
The AEMO had provided some advanced warning of the possibility of price volatility this afternoon – such as in an earlier forecast for an LOR2 level ‘Low Reserve Condition’ from 15:30 to 17:00 this afternoon:
1) This was issued in Market Notice 79939 issued yesterday afternoon (i.e. 12:55 on Sunday 15th November)
2) The LOR2 warning was later cancelled (Market Notice 79948 at 18:39), but an LOR1 warning remains in place at the time I am writing.
Note that this (Market Notice 79955 issued 00:37 today) was spanning 15:00 to 18:00 today … whereas these price spikes are a little earlier than that!
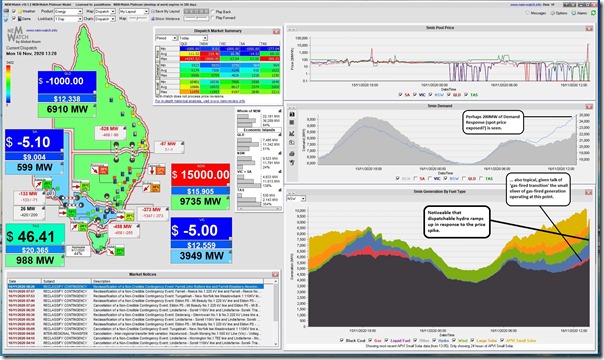
Here’s a simpler view of the NSW Region in this snapshot of the 13:20 dispatch interval in our NEMwatch v10 entry-level dashboard:
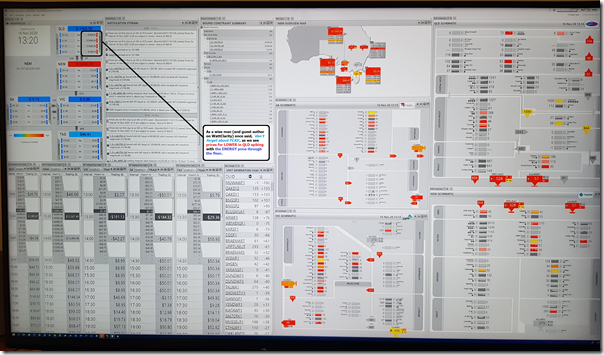
To see a fuller picture, though, you need our ez2view software … and a bigger screen to fit it all on. Here’s what was visible in my larger dashboard display:
(click on the image to open a larger sized one).
There’s much that can be seen in terms of what was happening across the NEM at the time, as the NEM’s a complex place – but the key thing I have highlighted is the reminder of what Allan wrote when he said ‘don’t forget about FCAS’ back in February.
On this occasion, we see a fuller picture in that, whilst the dispatch price for ENERGY in the QLD region has dropped down to the Market Price Floor of –$1,000/MWh in the 13:20 dispatch interval, the prices for the LOWER FCAS commodities have all spiked at the same time.
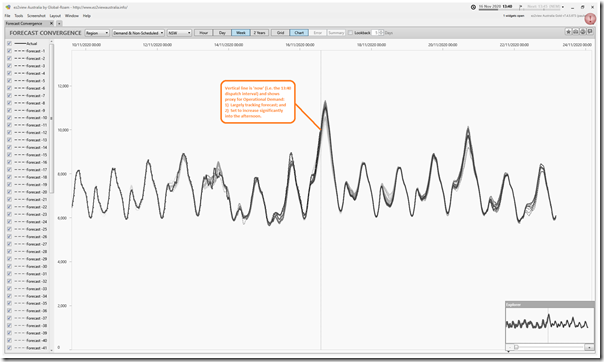
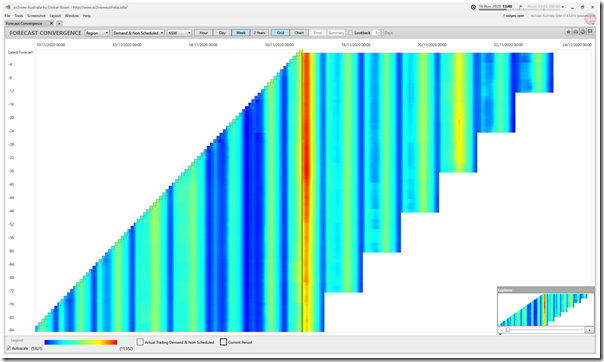
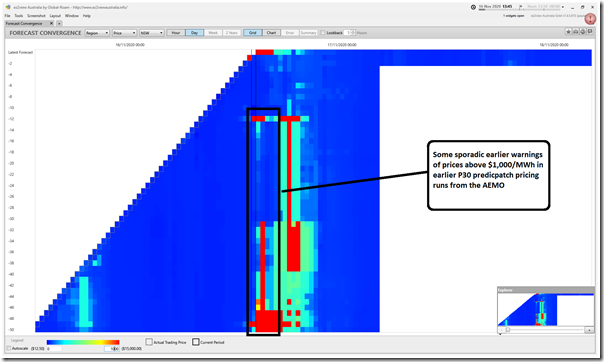
Worth opening up the ‘Forecast Convergence’ widget in ez2view to look at the extent to which AEMO had forecast all of this in advance:
We’ve started (above) with a CHART based view of ‘Demand and Non-Scheduled Generation’, which tracks reasonably closely to AEMO’s later figures for Operational Demand but has the advantage of being published in real time and at a Dispatch Interval level. Some of our users prefer the chart, but I prefer the GRID view of the same data below – because looking up a column I can get a clearer sense of how, in this instance, the AEMO forecast for Operational Demand in the NSW region this afternoon was progressively ratcheted upwards as the temperature rose higher than expected:
In other words, see the columns near ‘now’ become progressively more red over the prior week as we approached this afternoon.
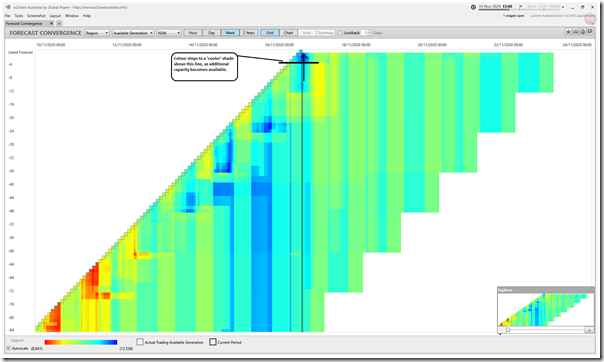
Flipping the same view to ‘Available Generation’ we (thankfully) see the colours grow cooler, as additional capacity becomes available:
It’s not possible today to know the type of the available capacity that has become available. That would be something we’d need to wait until tomorrow to tell.
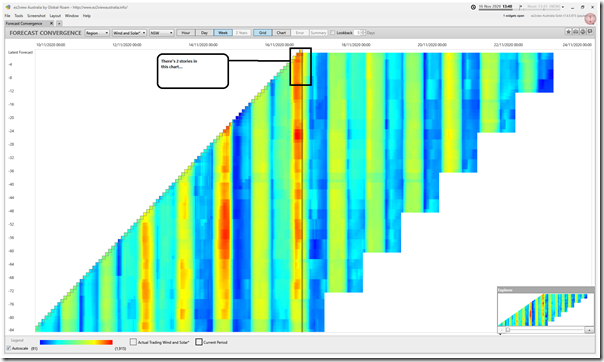
However we can flip the ‘Wind and Solar’ to use the AEMO’s forecast for the energy-constrained availability across (Semi-Scheduled) Wind and Solar plant in NSW:
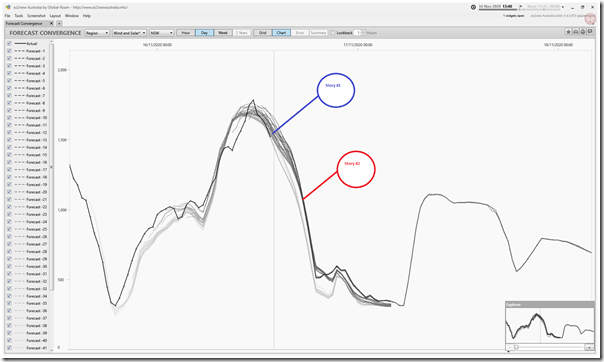
As noted here, there are two stories in this grid view that stretches out a week. On this occasion it’s easier to see these when zooming in to just ‘DAY’ view and flipping to ‘CHART’:
These stories are as follows:
STORY 1 = the good news is that the energy-constrained availability largely tracked close to what the AEMO had been forecasting previously up until the time of these early-afternoon price spikes
STORY 2 = the not-so-good news is that the AEMO has been consistently forecasting a steep drop in aggregate capability across Wind and Solar in NSW as we head further into the afternoon … coincident with the (still remaining ) LOR1 ‘Low Reserve Condition’ notice.
Here’s a view of NSW trading prices as at the 13:40 dispatch interval (i.e. with the trading price for 14:00 not yet known) in the GRID view of ‘Forecast Convergence’:
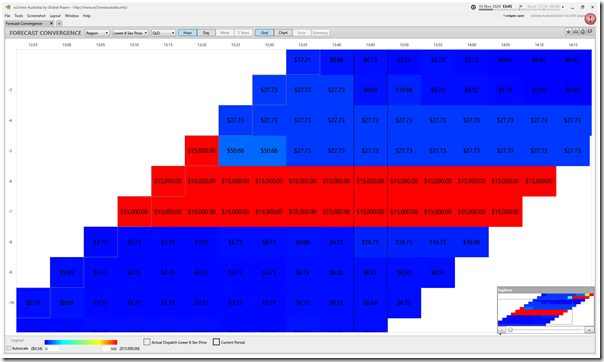
Finally, here’s a snapshot of the LOWER 6 second price in the QLD region that shows that the FCAS price spike there over 3 dispatch intervals was ‘out of the blue’ (literally, looking up the column to the 13:10 dispatch interval).


Wasn’t this caused by 800 MW of Victorian wind turning off at 1pm to avoid negative prices? This turned Victoria from an exporter to NSW to an importer. The current dispatch rules are leading to perverse outcomes.
I don’t expect wind was doing anything other than reacting to dispatch instructions.
There was an almost 2000MW reversal of flows on VIC1-NSW1 required by constraints. Given the sudden excess of generation, VRE was best placed to respond by backing off.
http://nemlog.com.au/nem/ic/VIC1-NSW1/20201116/20201116/
You forgot to mention the Tumut 300 KV line outage at 12:52
AEMO market notice 80022
Was looking at NEMLOG to try and understand why Victoria was importing against the price gradient. It continued for for a few dispatch intervals, as NSW hydro filled in the gap.
I think market notice #80022 may explain what was going on.
「An un-planned outage of Upper Tumut – Stockdill 1 330 kV Line in the NSW region occurred 1252 hrs 16/11/2020
Constraint sets invoked: N-SDUT_1 and N-CNSD_3C
This constraint sets contains equations with the following interconnectors on the LHS.
V-S-MNSP1
VIC1- NSW1″」