From a (rare) post focused on some very micro details back to a macro view of the NEM….
We’re seeing a number of new entrant generators coming onboard with us, for a range of reasons.
In this process, we have spoken more broadly with a range of new entrants (all of whom we’re starting to track in our Generator Catalog, for instance). In these conversations some specific questions about the supply/demand balance for northern Queensland, have arisen – particularly in terms of what is likely to occur with respect to:
1) changes in Marginal Loss Factors,
2) Reduced output due to constraints/congestion, and
3) Pricing impacts, due to the wind/solar correlation penalty.
… altogether a trio of possible effects that have the potential to significantly change the economics of a growing number of projects.
(A) What we’ve noticed in passing
We believe in the power of dashboards to help people progressively gain exposure to, and understanding of, the growing complexities in the energy sector. That’s why we have developed a number of these, looking at different aspects of this complexity.
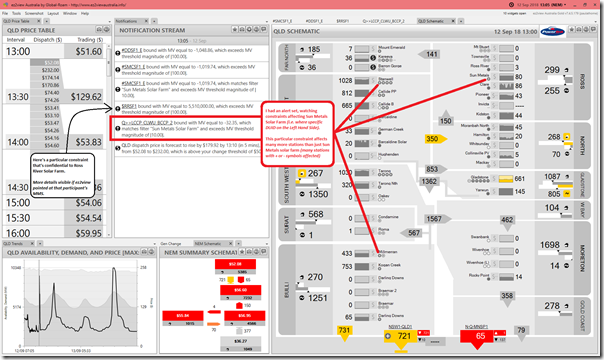
With our ez2view higher-end dashboard, we have noticed a number of instances such as that captured in the following image, where Queensland power stations have been “constrained down” due to a range of different conditions.
Here’s one instance we captured back at 13:05 on 12th September 2018 whilst discussing being constrained down with a particular new entrant:
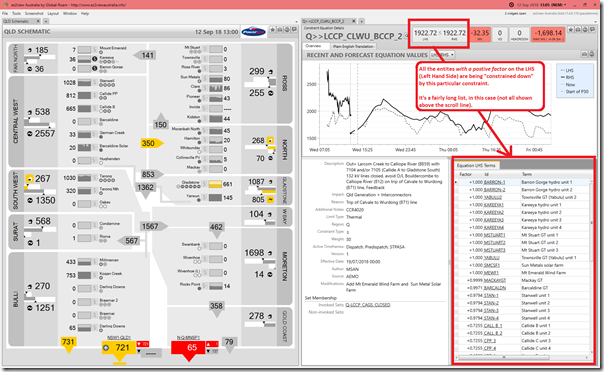
In this particular case, we saw that the constraint driving the curtailment was one that affected many stations across Queensland (i.e. in this case the stations with “+” symbols are being constrained down, as the constraint is of the form Left-Hand Side ≤ Right Hand Side:
In future, we suspect that there will be an increasing number of instances where it’s just generation plant in northern Queensland that will suffer from the being constrained down, through different constraint equations – partly for transient reasons, but also (more generally) because the rate of development in norther Queensland looks likely to swamp the size of the “addressable market” at different points in time.
I’ve mentioned this in these conversations, and have been asked to explain further – hence this post.
(B) Assessing the “addressable market” size from supply in northern Queensland
Out of curiosity a while back, I accessed a 22 month history of Powerlink “QData” (which we make available to ez2view clients as an optional extra in their data feed in collaboration with Powerlink).
Returning to this data set (in between other commitments) I’ve been having a look at two different parameters that should, combined, give some gauge to what the “addressable market” would be for all generators located in northern Queensland.
B1) Aggregate Demand in northern Queensland
With reference to the “Queensland schematic” widget in the ez2view snapshots above, we see that there are three distinct Zones within the Queensland region that, when combined, would constitute northern Queensland:
1) A “Far North” zone, which encompasses the area around Cairns;
2) A “Ross” zone, which encompasses the area around Townsville, and the load on the grid that spreads west from that point from Powerlink substations in the area; and
3) A “North” zone, which encompasses the area around Mackay, including the mining loads connected into those substations.
For each of these zones, Powerlink provide snapshots every minute (bundled in 5 minute updates) of the “demand” being supplied from collections of substations in these zones. Notwithstanding the numerous complexities that go with measuring electricity demand, we aggregated these 3 zonal demand numbers at each minute over the 22 month time range to form a view of what the demand for electricity might be, roughly speaking, in northern Queensland.
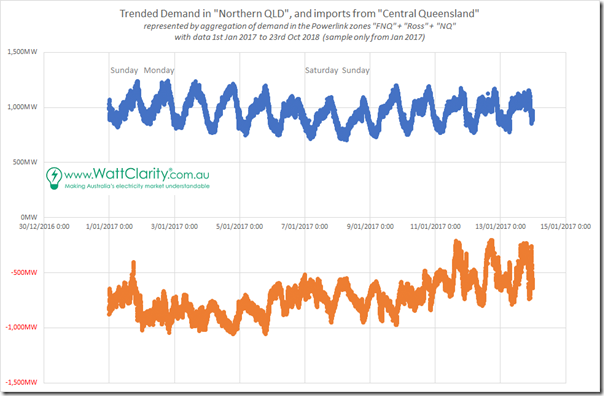
Here’s a sample of the data for a 2 week period in January 2017, to help readers understand this data set (in blue) along with the second one (in orange, discussed in the section below):
In this chart, we see that the demand oscillates around the 1,000MW mark, with (over this period) not much difference seen on the weekends compared to the week days (not much difference even on 1st January). We presume this is because of the high degree of temperature-driven consumption, and higher degree of tourism-driven consumption than for Queensland as a whole.
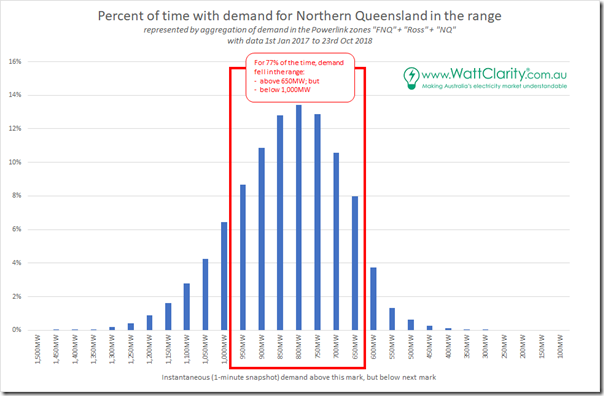
Taking the whole 22 month sample set and forming a distribution chart, we see the following:
As noted on the chart, for 77% of the time, demand in northern Queensland was less than 1,000MW and above 650MW. On this basis, we feel justified in making a simplifying (perhaps quite generous) assumption that the addressable local market for generators in northern Queensland of 1,000MW – though obviously many times it will be less than that (by time of day, and season, etc…)
B2) Export Capability south from northern Queensland
Historically, because of a deficit of local low-cost generation sources in northern Queensland, power has typically flowed north – from the “Central-West” zone (i.e. around Rockhampton) up the northern Queensland. Via the Powerlink Qdata set, we accessed a 22 month history of these flows. A sample (in orange) is shown in the trend chart above.
Hypothetically in future, with an influx of large volumes of low cost generation in northern Queensland, the flows might reverse (i.e. and see northern Queensland exporting at similar volumes south). Note that there are important simplifying assumptions made here for the sake of this analysis, which include:
1) The assumption that there would not also be similar expansion of low cost generation in central Queensland (this seems unlikely, but let’s assume this for now); and
2) We also assume that the transfer capacity south is about as much as it has been north. We have not taken the time to investigate this at all in this “back of an envelope” calculation.
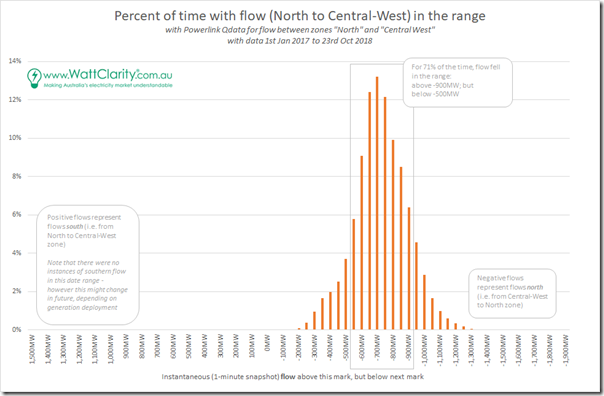
Taking the same historical data set and performing a similar distribution analysis (remembering that negative flows are south-to-north) we see the following trend:
As noted on the chart we see that (noting a few small gaps in the data) there was not a single 1-minute instance where electricity transferred from North to Central Queensland over the 22 month date range – however this is understandable, given the large share of lower-cost generation that has been deployed in central Queensland historically (Callide, Stanwell and Gladstone power stations), and the dearth of the same in northern Queensland.
Of course, in the new energy environment that we are heading into through this energy transition, it is one possible outcome (of many) that the relative share of low-cost generation sources might reverse, such that northern Queensland would see a preponderance of wind and solar assets being built.
In order to continue this back-of-the-envelope calculation, we feel we can make another simplifying assumption that there could be (if economics warranted it) a transfer of 1,000MW south (from northern Queensland to central Queensland).
B3) Rough estimate of total addressable market for generators in northern QLD
Adding together the two numbers, we conclude that a back-of-the-envelope assumption suggests that the maximum market size that could be addressed by all the generators in northern Queensland would be 2,000MW (as a nice round number) – being the demand locally in the area, plus the limit on flow capacity south.
Obviously this could be refined in more detail, but seems fair enough as an initial guide for these purposes.
(C) Assessing what it means for the future
“What this means for the future” is, of course, the multi-million dollar question for new project proponents.
Because of our heightened interest in generation projects under development (at least in part because we’re tracking them more closely through our Generator Catalog) we have taken more of a look at the types of plant that are under development in northern Queensland.
C1) Existing (and under construction) assets in northern QLD
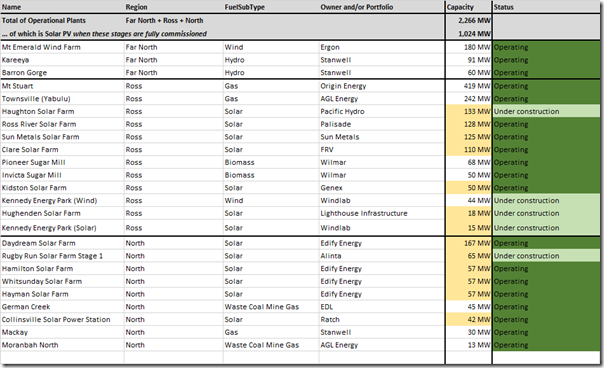
Sourcing data from this Generator Catalog, we have compiled this table of plant that are operating, or under construction and soon to begin operations:
Whilst we see there is more than 2,000MW in aggregate capacity, it is the aggregate capacity of more than 1,000MW across the large-scale solar plant that stands out particular to me.
The solar is of particular interest as its output will all be highly correlated – so an output peaking above 1,000MW in the middle of a sunny summers day, where we have also seen (above) that the peak demand locally would be only around the same level.
The significant revisions to Marginal Loss Factors (discussed here) seems an obvious outcome of this re-balancing that is already with us. And it does not even consider other projects on the drawing board…
C2) Some prospective plant
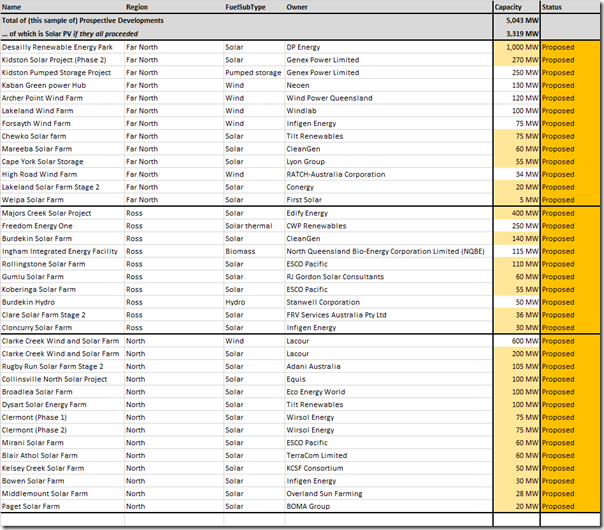
From our Generator Catalog, we have dragged out some details of a sample of the other projects that are under consideration for northern Queensland by various developers:
Just looking at the solar PV projects in the (incomplete) listing above, we see over 3,000MW of potential addition to the 1,000MW of solar projects already operational, or soon to be.
Based on the back-of-the-envelope calculation above on the size of the addressable market from supply location in northern Queensland, clearly there is a mismatch!
(D) What a generator in northern Queensland might do, to improve their prospects
Unfortunately, prior conversations with some developers of assets in northern Queensland suggest that this assessment will be a bit of a shock to them, which is a concern (and evidence of Villain #4 at work).
An obvious next question to ask is what a developer, or operator of an existing asset in northern Queensland, might do to give their project a larger chance of success.
D1) Jump on the “storage” bandwagon?
Of course, there will be some who immediately leap to “storage” being the answer (as it it were some form of magic wand cure-all).
However whilst it will offer some assistance, it is important to note that the total addressable market (as calculated above) peaks at 2,000MW including exports, so just adding storage with all of the development above would seem to just end up with storages being filled to overflowing, with no way to market to discharge into.
D2) Upgrade the interconnector transfer?
Upgrading export capacity to other markets (e.g. upgrading transfer capacity south, or connecting westwards to Mt Isa and beyond) would also be worthy of serious consideration (including the implications of RIT-T and so on) – but a note of caution, that “interconnection” does not also become an alternative magic wand.
D3) Increase local consumption!
This is certainly something that would help.
Finding additional customers locally (particularly large energy users) would definitely help to increase the addressable market size from generation options in the north.
It is with a note of irony that we could point out that one of the market developments that would assist with the returns generated by Adani’s new Rugby Run Solar Farm (amongst others in the region), would be for an increase in mining load to come about from opening of new mining loads in the Galilee Basin, including the much-hated Adani mine there.
D4) Create a new NEM region for Northern Queensland
Something a bit more left-field would be to consider the creation of a “Northern Queensland” region.
Being a separate region might accelerate the process of attracting new energy users to the north.
Let’s be clear – initially what would happen if this were to come about would be that prices in the new “Northern Queensland” region would most likely plunge most of the time – beset heavily by a heavy solar correlation penalty.
However this change should stimulate much more rapid development of major energy users in the region, to reset the balance between supply and demand to more sustainable levels.
Ideally these would be loads that could operate diurnally, given that this is likely to be the periods where (in the absence of the additional cost of storage) generation will be surplus. Finding loads that were heavy consumers but which did not need to operate 24×7 would be an interesting challenge…
More detail in upcoming “Generator Report Card”
It’s these types of conversations that have been one of the reasons prompting us to develop an extensive Generator Report Card with data till 31st December 2018. In the report card, we are working to include analysis for each of the many power stations across the the NEM trending the amount of time with which a generator has been constrained, how their loss factor has changed, and the average spot revenue per MWh produced has changed in the presence of any “correlation penalty”.


So far it’s only 1239 MW of wind, which would be negatively correlated with solar, so there should be enough local demand and transfer capacity for it not to be constrained. However, there are some other proposals not on the list such as Gennex and Kennedy.
Sun Metals have plans to increase the size of their zinc refinery, and securing cheaper electricity is part of their business case.
The North Queensland region is similar to the South Australian region in terms of demand and transfer capacity to the adjacent region, but there are no system strength requirements for local synchronous plant to be spinning. Is this a historical quirk of it being a single Queensland market, or does physics work differently in Queensland to South Australia?
Interesting point Malcolm M. North Queensland as a region would be a similar size to South Australia. It is only because SA is a separate region with the possibility of islanding from the rest of the NEM does it have an arbitrary requirement to have x amount of synchronous generation for system strength.
North Queensland has no such requirement at the moment (despite operating just fine with little synchronous generation), yet one could argue that it is just as prone to islanding as SA.
So if it became a new region, would such a requirement be imposed on it? (to be able to continue islanded in case of interconnection failure).
Regardless of becoming a new region or not, it would be wise to establish the capability to be able to operate islanded. Traditionally this capability would only be done with sufficient synchronous generation, but that is very unlikely to happen at all. So other methods must be explored.
There are alternative solutions. But it isn’t likely to happen with slow incremental evolution of the network. Planners have to step back and consider much more revolutionary changes to the way the whole network operates, and then start planning the changes required to achieve that. Thinking only one or two steps ahead as is the case now will not work.
At some point, the train has to jump rails. The current track is on course to a disastrous dead end. Time to design and build a new track that keeps going far into the future.