On Sunday 24th January 2021 there was a general failure in SCADA communications right across the NEM. This loss of SCADA signals contributed (as described below) to a price spike that occurred in the QLD region.
This particular event have been of interest to us – so in this article (part 5 in an expanding series) we explore further…
(A) Background
In this table, we’ll explain how this series of articles has evolved, and the insights generated in each of them …
| Part Number, and date of publication |
What was discovered, and discussed |
| Part 1 Sunday 24th January 2021 |
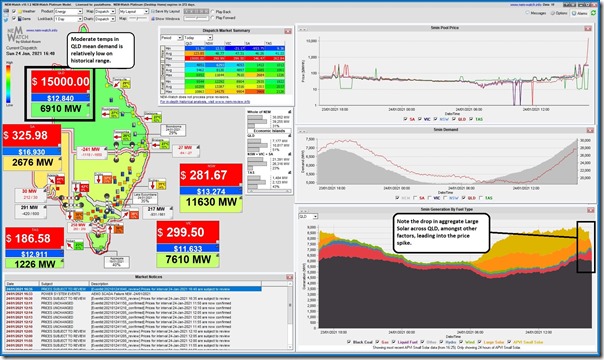
As we noted on the day (Part 1) the QLD price spiked high in the 16:35 (to $2,173.06/MWh)and 16:40 (to $15,000/MWh) dispatch intervals – here’s the 16:40 dispatch interval captured in NEMwatch v10 at the time: We determined that the ‘Q>>NIL_CLWU_RGLC’ constraint equation rapidly reduced the output of many generators in QLD of varied fuel types. The resultant drop in supply meant that prices could only go one way – up, and quickly! |
| Part 2 15th March 2021 |
On 15th February 2021 the AEMO published a ‘Preliminary Report – Total loss of SCADA systems on 24th January 2021’, in which they communicated a number of things – including that the SCADA outage lasted from 15:46 through until 16:56 (both NEM Time). We did not post about this until we had time to start analysis for Part 3. |
| Part 3 24th March 2021 |
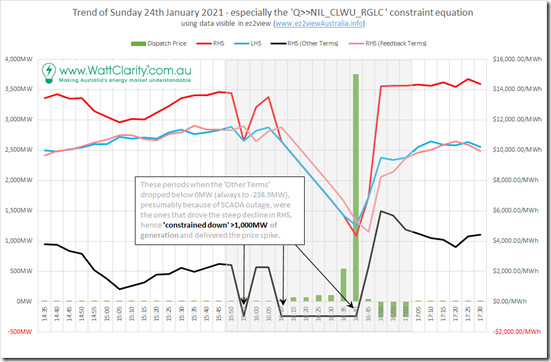
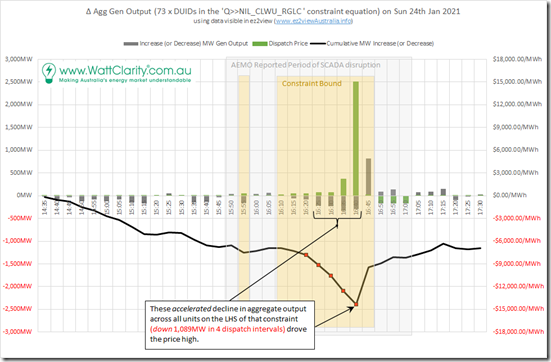
With the AEMO preliminary report as a guide, in this longer article for Part 3 we were able to unbundle the RHS terms of the ‘Q>>NIL_CLWU_RGLC’ constraint equation into two groups: Group 1 = RHS (Feedback Terms); and Group 2 = RHS (Other Terms). …. both of which were trended in the chart below: What seemed to be the case, from this analysis, was that there were several dispatch intervals (15:55 and then 16:10-to-16:40) in which the ‘RHS (Other Terms)’ dropped sharply below zero (always to –238.9MW), which had the effect of: Step 1 = drag the LHS lower; hence Step 2 = by virtue of their membership of the LHS, drag the targets of many QLD generators lower – with the growing deficit (down 1,089MW in 4 dispatch intervals to 16:40) shown in the chart below: What was not clear when we published Part 3 was why the RHS (Other Terms) trended like it did. |
| Part 4 Mon 19th April 2021 |
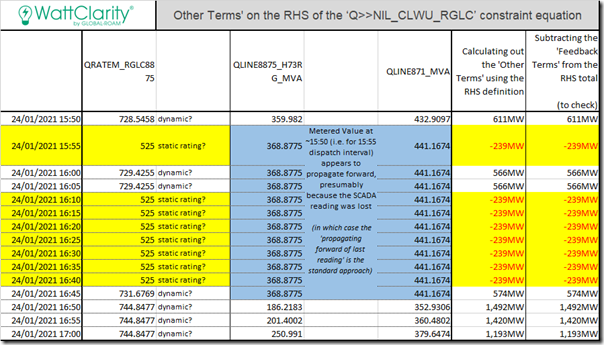
We re-iterated in part 4 that the ‘RHS (Other Terms)’ was constituted as follows: RHS (Other Terms) = 3.935 x ( Qld: 8875 Raglan-Larcom Creek 275kV Emergency Rating – MVA flow on 8875 275kV line at Raglan – 0.4235 x [MVA on 871 275kV feeder from Calvale, Line end switched MW] – 30 {Operating_Margin}) Thanks to a few keen readers for pointing us in the direction of where we could go to unbundle the 3 variables contained within this formula, which we present in the following table: Because of the multiplier (3.935) on the equation, we can see that a reduction of 203 (i.e. 728-525) in the emergency rating on the Raglan-Larcom Creek 275kV line (i.e. line 8875) flips the ‘RHS (Other Terms)’ value from above 500 down to –239. In essence, this meant that (as soon as SCADA signals were lost) the form of the constraint equation effectively guaranteed that the QLD dispatch price would spike to the Market Price Cap over several dispatch intervals. |
| Part 5 Mon 23rd August 2021 |
Which makes this article Part 5 in the series |
We appreciate the opportunity to explore events like this in detail – and to share some of what we find (and learn) in a series of articles like these… (other insights will be worked into the ongoing development of our software products, and in joint initiatives like GenInsights21 and so on).
(B) Why complete this analysis … and why post it now (>6 months later)
Before we get into the details, there are some things to note…
(B1) Questions we were pondering
As noted in part 4, there have been several questions we’ve been pondering about this particular event – including, but not limited, to these three questions:
Q1) We’ve been interested in understanding the sequence by which these DUIDs were were ‘dispatched down’ (taking into account both the LHS factor, and how they bid (including ramp rate limitations and so on));
Q2) We’ve also been interested to use this event to learn what the 4-second SCADA data shows (to the extent that it is present) – and also what it does not show:
(a) about what actually happened with output – as distinct from what was shown in AEMO’s published InitialMW through the period where SCADA disruption was noted;
(b) and, related to this, how useful the 4-second data will be for future analysis in events like this?
Q3) What efforts were made by participants (e.g. through bidding behaviour) to change the dispatch outcomes … especially given that (it appears in hindsight) the price spike at 16:40 was almost guaranteed to happen whilst the SCADA outage continued.
Q4) More fundamentally, we were interested to explore the widening gap between what NEMDE thought was happening and what was actually happening in the grid during the period of the SCADA outage.
(B2) Why take so long … and why still post it now?
There’s two questions in one here, so I will address each separately…
(B2a) Why take so long to piece this together
What happened on Sunday 24th January 2021 was complex – and stretched our capabilities. This was especially the case because it’s definitely been an ‘in our spare time’ project. Recent events and projects have made this ‘spare time’ almost non-existent for months – these events have included:
1) Our progressive review of the nature of volatility through Q2 2021, and various analysis of its causes.
2) Our preparations for Five Minute Settlement, and straight after that the Wholesale Demand Response Mechanism; and also
3) The ongoing development of GenInsights21 … the initially envisaged Q3 release date for which is also challenged as a result of the above.
(B2b) Why still post this now, 7 months after the event?
Six months seems an age in the NEM these days … and there’s been lots of water under the bridge since that event. It’s quite understandable to ask the question why still publish this now:
(i) Given 7 months has elapsed since that event
(ii) And other events have overtaken it that are, in many ways, more significant – like the Callide C4 Catastrophe, the Yallourn flooding (both part of the major jump in price volatility and overall outcomes through Q2 2021), and later with the Victoria Big Battery fire.
(iii) We asked that same question ourselves!
One of the factors weighing into the decision to publish now was that the AEMO final Incident Report has not been published either.
Hence we reflected that:
(i) There were a number of things that we learnt in completing this analysis – which others might also find value in; and
(ii) This article might serve as another interim advance on the AEMO interim report … whilst we all wait for what will be revealed in the final report from the AEMO.
(iii) Furthermore, those who are not interested in reading the following don’t have to (it is a bit long!).
(B3) Many Caveats … ‘Reader Beware’
Note that (back in May 2021) we did try to contact the relevant stakeholders of all of the DUIDs listed here, seeking their comment about the analysis we had performed with respect to their units. A big thanks to those who offered comments and corrections (and some criticisms)!
If you are a reader of WattClarity and find that we somehow left you off the list, please accept my apologies – and, most importantly, let us know if you see errors remaining in the following? Also, if you had no time to respond back when we contacted you, and you now find some errors in what follows, please do let us know.
(B3a) It’s not intended to highlight any particular wrong-doing
For those eager to find ‘gotcha’ examples of Non-Conformance or Non-Compliance (or any other transgression) I would suggest you look somewhere else, as this article is not intended to identify or highlight any of those things.
(B3b) It’s likely that there are errors remaining
Readers here should also note that this analysis may well have errors – and that these errors might be due to any of a number of factors, including any or all of a number of factors, including three big factors:
Factor #1 leading to possible error) This event was complex, and rare, the understanding of which requires use of complex data (some of which we have low familiarity with – such as the 4-second SCADA data).
Factor #2 leading to possible error) It’s been completed in a disjointed way, in ‘spare time’ (and hour here and there over some months) as allowed by other priorities. The start-stop-start nature of this analysis could quite plausibly have allowed errors to creep in.
Factor #3 leading to possible error) As you will see, it has involved much repetition (i.e. looping through the same type of approach, but for dozens of DUIDs) which could easily have allowed errors to keep in.
Whilst we have tried to prevent the incursion of any errors in what is published here, it seems likely that there are still some. Hence readers are urged to use caution in drawing any conclusions based on what is provided below.
In particular readers are urged to keep the following in mind…
(B3c) About the usefulness of 4-second SCADA data
When we were completing this analysis, including the use of the 4-second SCADA data, we noted that:
Scenario 1) Many data points were completely missing (there were many of these, as you will see).
Scenario 2) Of the data points present, some were marked as ‘good’ quality – and there were not very many of these. It’s also noted that these SCADA data points did not line up exactly with the timeline published by AEMO in its Preliminary Incident Report.
Keep in mind that there is a general issue with this 4-second data that, even when it is measured as ‘good quality’ the timestamps are dated when the data is received by the AEMO, not when they are measured at the generator terminals. This is a more general issue with this data that goes well beyond this particular incident.
Scenario 3) Other data points were denoted as bad/poor quality.
Of this ‘bad quality’ data, a general hypothesis we worked to was that the measurement might be correct, just the timestamp that it was measured against would be incorrect (i.e. in that it would have been measured at that point sometime earlier).
In the analysis that follows, the data points that existed in the data published by AEMO have been separately identified as ‘good’ or ‘bad’ on this basis. However the situation may well be even more complex than this …
(i) Some of those generators that we asked responded to say that the AEMO’s 4-second SCADA data that AEMO identified as ‘good quality’ (graphed for each DUID below though the period of the incident) lined up quite well with what happened at the unit
(ii) Whilst others indicated that even the 4-second SCADA data denoted as ‘good quality’ was quite different to what was seen onsite!
(iii) We thought about identifying which-DUID-was-which in what follows. However at the end of the day we decided that doing this would potentially lend false specificity to the data (especially keeping in mind that we only received responses for some DUIDs) – so opted to not say anything specific about any particular DUID in relation to any comments we might have received.
What this does mean is that readers should exercise caution in reading too much into what the SCADA data might seem to show.
(B3d) Rebids for a unit are not the whole response
The hour long period (highlighted below) when SCADA signals were lost would clearly have been a stressful time for operators in the AEMO’s control room, and also in generator trading rooms.
The AEMO’s preliminary report describes some of the efforts undertaken at the AEMO … including lots of phone calls. Clearly in these circumstances looking (just) at rebids is an incomplete view of everything that was going on.
(B3e) The DUIDs shown may not be the only ones in a portfolio
In this article, we only look at DUIDs in QLD … and, furthermore, only look at DUIDs specifically affected by that constraint equation. Hence this means that what follows is likely an incomplete picture of how many portfolios approached the events on that afternoon (including related to the SCADA outage).
(B3f) It’s impossible to infer motivations … and we are not trying to imply them
As I have noted elsewhere on WattClarity before, it’s impossible to know what another stakeholder’s motivations might be … though it does not stop many of us guessing.
In the following analysis I have tried to not make draw any inference to any stakeholder’s motivations – readers should not mistakenly infer any comment below is trying to do this.
(B3g) There are many more stories
Keep in mind that we’ve only focused on those 74 x DUIDs that were on the LHS of ‘Q>>NIL_CLWU_RGLC’ constraint equation … whereas there are several hundred DUIDs across the NEM (and all of them were, to my knowledge, impacted by the SCADA communications problem with AEMO).
Hence this article should certainly not be misconstrued as telling the only story about what happened on the day.
(C) A look at what happened, for each DUID involved on the LHS
Even taking into account these caveats, we reasoned that it would be worth sharing some observations about what happened during the specific time range of the SCADA issues.
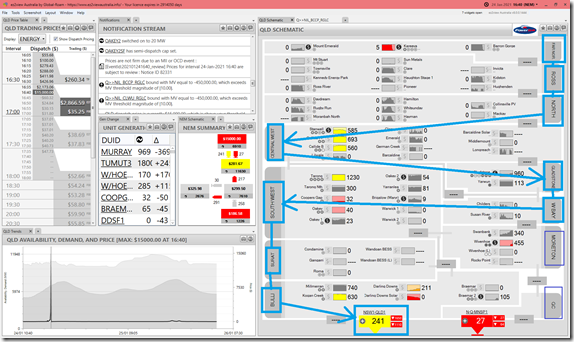
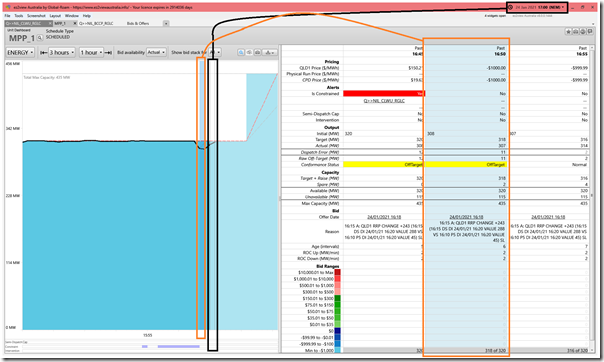
There were 74 x DUIDs on the LHS of ‘Q>>NIL_CLWU_RGLC’ constraint equation (and QNI as well, as another element dispatched on the LHS) … so we will walk through each of them in turn. However to explain the way in which we’ll do this, it’s best to look at this snapshot from ez2view v8.0.0.1444 (released 13th July 2021) looking back at the 16:40 dispatch interval via Time Travel:
Note that this image also shows another constraint equation (i.e. ‘Q>>NIL_BCCP_RGLC’) that is bound in this dispatch interval, affecting the same units – however it’s not the focus of this series of articles. To make things a bit more understandable, we’ll walk through DUIDs:
1) From north to south (i.e. following the arrows on the image);
2) Using Powerlink’s sub-regional zones as reference points (which are used as reference points in ez2view, and are also commonly used in the Powerlink Annual Planning Reports each year to describe areas of congestion in the market).
Doing this will also help to demonstrate why the LHS factors* are what they are for each DUID (i.e. strongly to do with where in the grid they are located).
* this is also the case for Marginal Loss Factors (MLF), but you’ll have to wait for GenInsights21 to see what we’ve done to make this clearer!
Hence we’ll start in the ‘Far North’ zone…. (remember you can click on the images below to open a larger view)
(C1) Far North zone
The ‘Far North’ encapsulates the area around Cairns. There are three stations shown in this zone:
(C1a) Mt Emerald Wind Farm (LHS factor = +1.0000)
For all 74 x DUIDs on the LHS of the ‘Q>>NIL_CLWU_RGLC’ constraint equation we completed a juxtaposed view of a combination of different market data (including InitialMW and Target, plus rebidding and 4-second SCADA data) in order to provide a rich view of what happened through the period of the SCADA outage and the constraint being bound in the background.
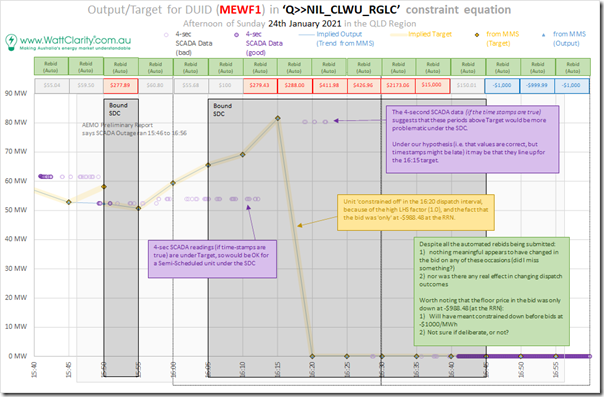
Here’s the particular view of the MEWF1 DUID:
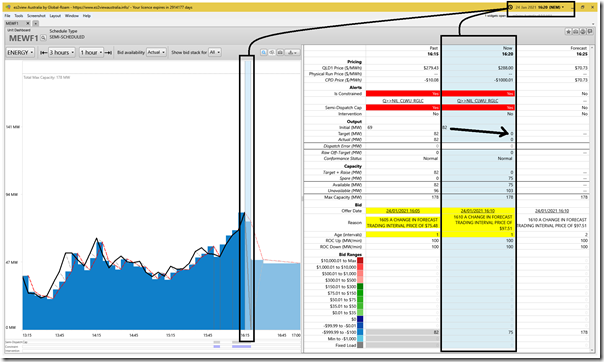
Because of this units LHS factor, the unit was one of the ones constrained down first (i.e. in the 16:20 dispatch interval) – even though it had bid its volume down to –$1,000/MWh. Here’s a snapshot from ez2view v8.0.0.1411 highlighting the 16:20 dispatch interval for MEWF1:
Every dispatch interval saw a rebid (as noted in the image above), but none seemed to make any material difference in the outcome achieved over the period shown.
(C1b) Kareeya hydro (LHS factor = +0.9999)
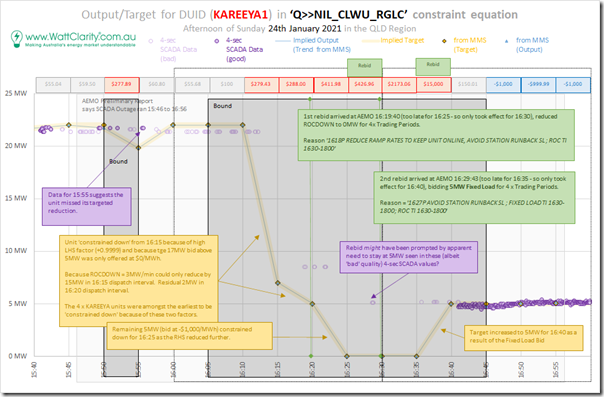
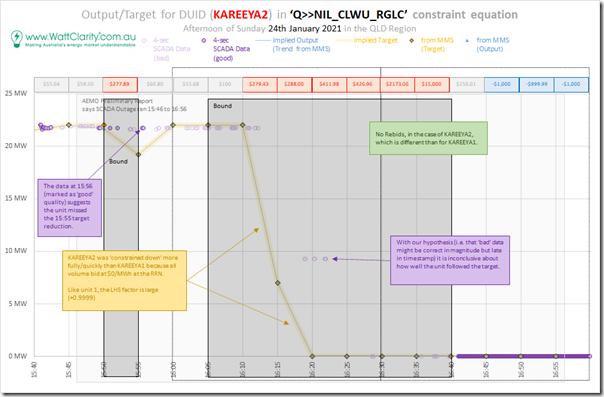
This is a five-unit hydro station – with four units scheduled, and smaller 5th unit (Kareeya 5) added much later as a non-scheduled unit. Let’s look firstly at Unit 1 – which displayed somewhat different response than Units 2, 3 and 4 (which were all quite similar):
Despite the fact that the LHS factor was slightly lower than that for MEWF1, we see that the unit was constrained down earlier (starting in the 16:15 dispatch interval) because its volume was not bid down at –$1,000/MWh. The units ROCDOWN rate meant the unit would have had to have been constrained off over two dispatch intervals – however the rebid prior to the 16:25 dispatch interval slowed this further. A subsequent rebid too late for the 16:35 dispatch interval meant it was dispatched up again for 16:40.
Comparing Unit 1 (above) to Unit 2 (below) we see that there was no rebid in the case of this unit (nor for units 3 and 4) so this unit (and units 3 and 4) was constrained off by 16:20:
As a result, the unit reached 0MW target at the same time as MEWF1.
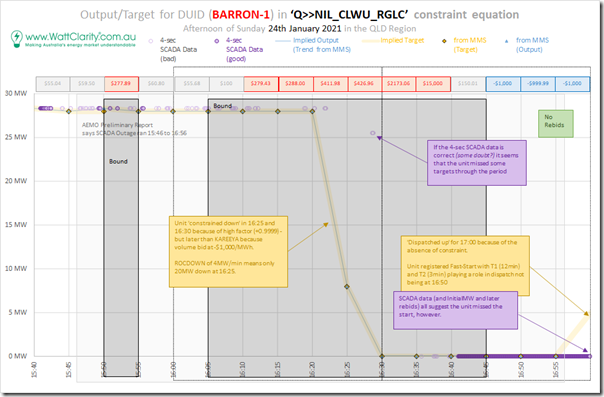
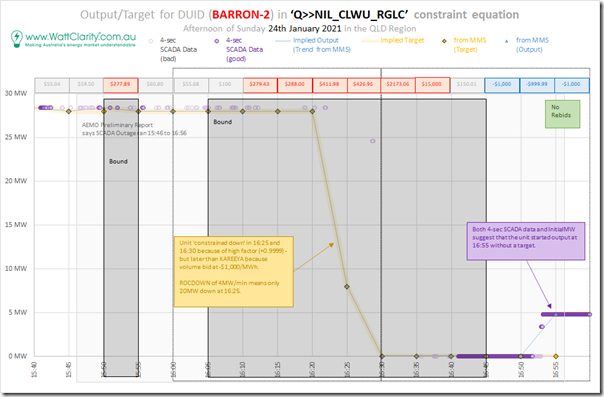
(C1c) Barron Gorge hydro (LHS factor = +0.9999)
This is a two-unit hydro station. Both units are shown here – because there is some difference in what happens at the end of the time window shown:
We see unit 1 (above) and unit 2 (below):
The Barron Gorge units were constrained off:
1) Later than the 4 x Kareeya units, because the unit volume was bid at –$1,000/MWh (i.e. below the offer price of the Kareeya units at $0/MWh); and also
2) Later than the MEWF1 unit, because the MEWF1 bid was also not down at –$1,000/MWh.
(C2) Ross zone
The ‘Ross’ encapsulates the area around Townsville. There are 11 stations now shown in this zone (only some of which had data – i.e. were active – at that time):
(C2a) Mt Stuart peaking units (LHS factor = +0.9998)
There were originally two units at this station, with a third unit added more recently. These units were not operational at all through the 16 x Dispatch Interval focal window here.
(C2b) Townsville – a.k.a. Yabulu (LHS factor = +0.9998)
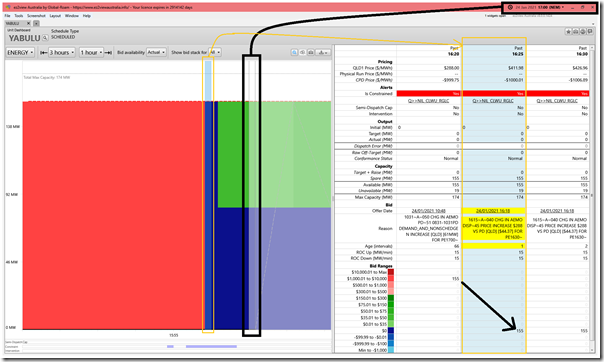
The YABULU unit was also not operational through the 16 x Dispatch Interval focal window here. Here’s a snapshot of the ‘Unit Dashboard’ widget from ez2view snapped at 17:00 that shows some of the rebidding that was performed … but with no output delivered in any target:
The YABULU2 unit had no volume offered at all.
(C2c) Ross River Solar Farm (LHS factor = +0.9998)
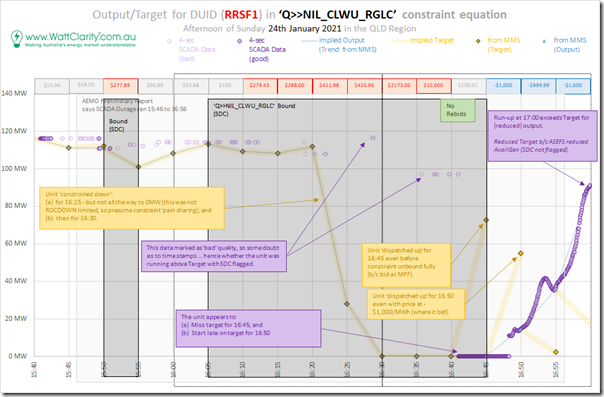
Here’s a view of what’s visible for RRSF1 in the MMS data, and in the 4-second SCADA data (which was mostly marked as ‘bad’ quality through the period – like for all units):
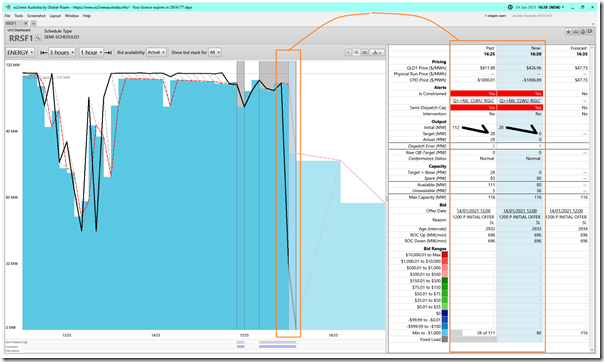
I’ve coupled this with a snapshot from ez2view of the 16:30 dispatch interval, when it was constrained off:
The unit was not fully ramped down in the 16:35 dispatch interval, despite the large ROCDOWN rate – so I presume that this was as a result of the ‘pain sharing’ across other affected DUIDs on the LHS of the constraint (i.e. ones with a high LHS factor, like RRSF1) – however I have not had time to check this.
It does appear, at the end of the SCADA outage period, that the unit missed a Target to start for 16:45 and 16:50.
The 16:45 target up at 73MW is an interesting one – as the ‘Q>>NIL_CLWU_RGLC’ constraint was still bound at that time, but the ‘Q>>NIL_BCCP_RGLC’ constraint equation (which had affected the unit for 16;40) was unbound for 16:45. It appears that the bid down at –$1,000/MWh was enough to allow the unit to dispatch – with a CPD Price down at –$1,000/MWh.
(C2d) Sun Metals Solar Farm (LHS factor = +0.9998)
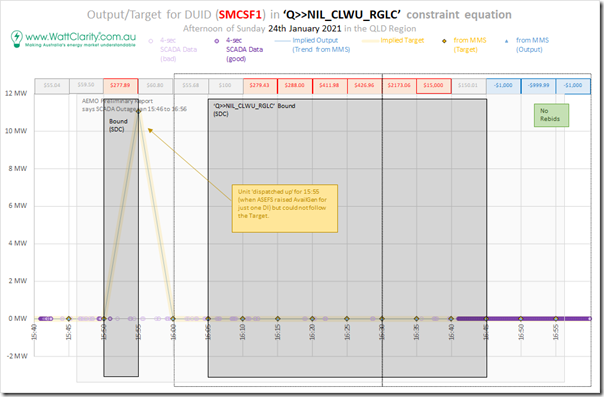
The SMCSF1 had been offline since the end of 2019 – there was a non-zero target delivered (as shown) but no output:
(C2e) Clare Solar Farm (LHS factor = +0.9995)
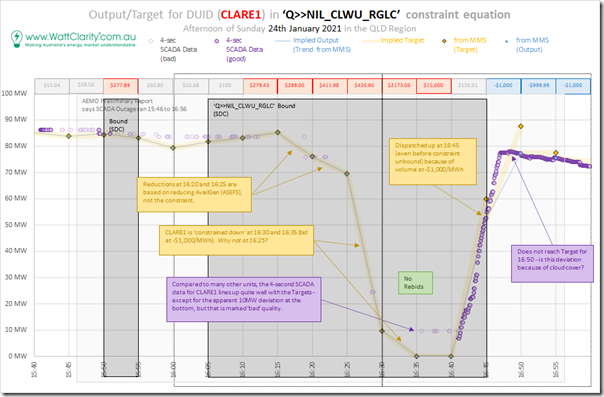
The CLARESF1 had volume bid down at –$1,000/MWh for the period shown in the window below:
This low bid price meant the unit was one of the later ones constrained down (despite the large LHS factor), and early to be dispatched up.
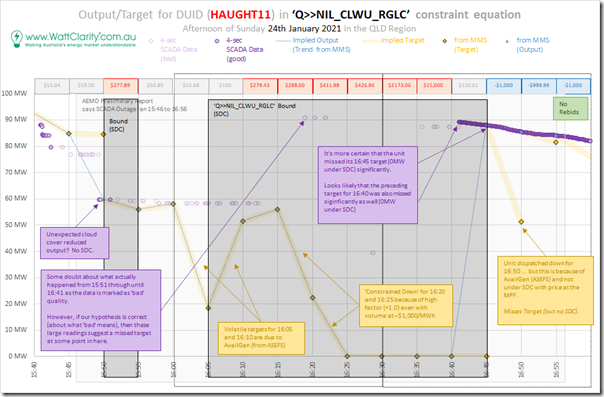
(C2f) Haughton 1 Solar Farm (LHS factor = +1.0000)
The unit HAUGHT11 appears to have been subject to cloud cover effects at 16:05 leading into the main period of the SCADA outage:
Because of the larger LHS factor (in spite of bids down at –$1,000/MWh) it was constrained down sooner than for RRSF1 above.
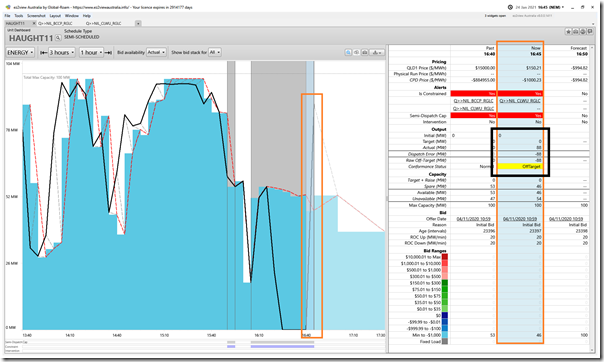
As noted (16:40 to 16:45) the 4-second SCADA data does pose some questions about what actually happened in that period. In the snapshot of the ‘Unit Dashboard’ widget in ez2view below for 16:45, we see that MMS data appears to show the unit jumping in output to 88MW – but whilst still being ‘constrained off’ at 0MW:
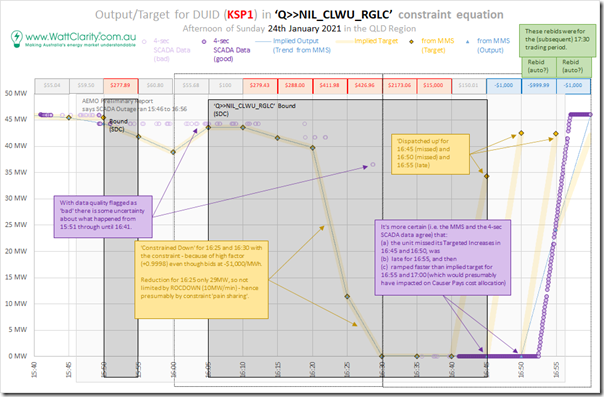
(C2g) Kidston Solar Farm (LHS factor = +0.9998)
The LHS factor that was slightly lower than for HAUGHT11 appears to be the reason why the constraint began to affect KSP1 five minutes later:
Both units were bid down at –$1,000/MWh.
Working from the top of the state to the bottom in the order shown in this article, this is the first unit we have come across that displays this pattern of rebids, that:
1) There are a number of units that appear to rebid in the same way (keep an eye out below);
2) There were no rebids that achieved any change in outcome in the period shown; but
3) The pattern shown above were rebids seen in the 16:55 and 17:00 trading period that only adjusted bids for the 17:30 trading period (i.e. first dispatch interval 17:05 – which is out of scope of the focal area of this article). Hence we have not looked at the degree to which any of these rebids were effective.
(C3) North zone
The ‘North’ encapsulates the area around Mackay and Collinsville. There are 8 stations now shown in this zone (only some of which had data – i.e. were active – at that time):
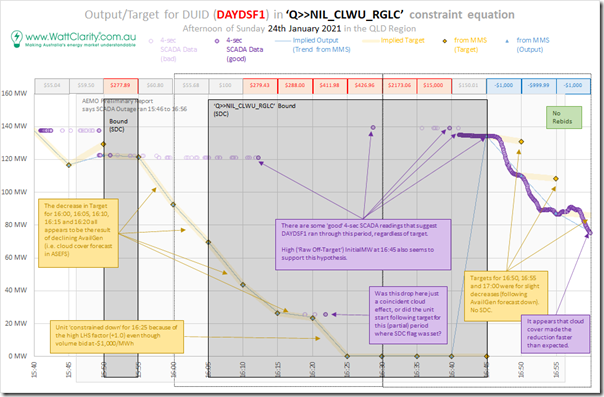
(C3a) Daydream Solar Farm (LHS factor = +1.0000)
Despite being in a different TNSP zone (to HAUGHT11 and MEWF1), the DAYDSF1 was also operating with the maximum LHS factor (+1.0).
Even before the constraint started to have any effect, though, the unit output appears to have trended down as a result of declining ASEFS energy-constrained Availability forecasts for subsequent dispatch intervals beginning 16:00.
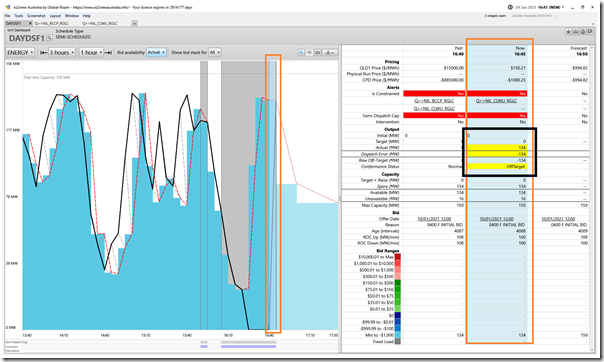
The effect of the ‘Q>>NIL_CLWU_RGLC’ constraint equation only seems visible from 16:25. In the snapshot of the ‘Unit Dashboard’ widget in ez2view below for 16:45, we see that MMS data appears to show the unit jumping in output to 134MW – but whilst still being ‘constrained off’ at 0MW. The 4-second SCADA data (marked as ‘good’ quality at that point – in the image above) seems to support this:
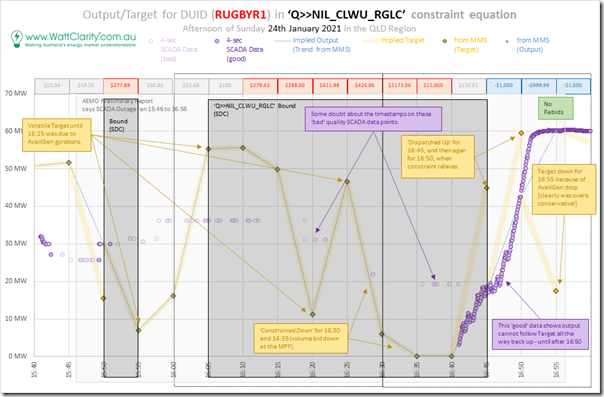
(C3b) Rugby Run Solar Farm (LHS factor = +0.995)
With a LHS factor smaller than 1.0 (and volume at –$1,000/MWh), the RUGBYR1 unit was not constrained down until 16:30:
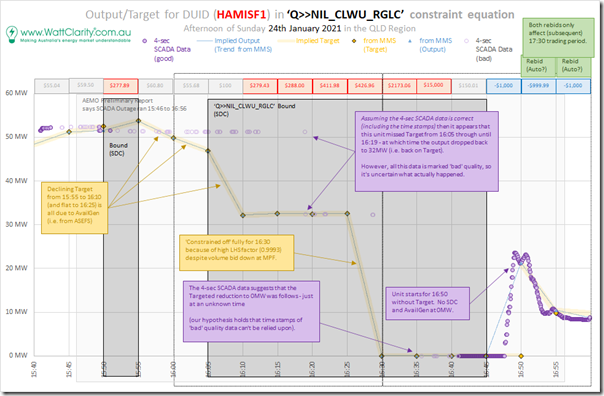
(C3c) Hamilton Solar Farm (LHS factor = +0.9993)
With a LHS factor smaller than 1.0 (and volume at –$1,000/MWh), the HAMISF1 unit was not constrained down until 16:30:
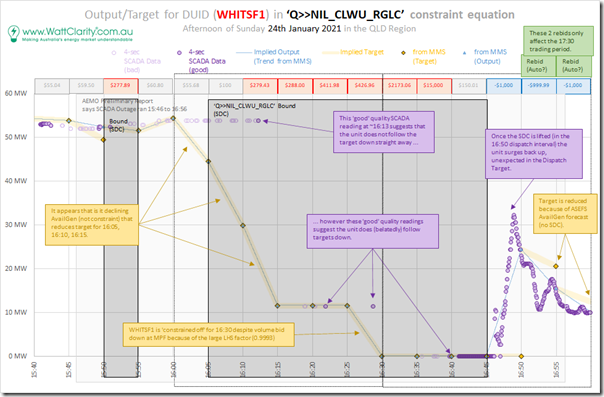
(C3d) Whitsunday Solar Farm (LHS factor = +0.9993)
With a LHS factor smaller than 1.0 (and volume at –$1,000/MWh), the WHITSF1 unit was not constrained down until 16:30:
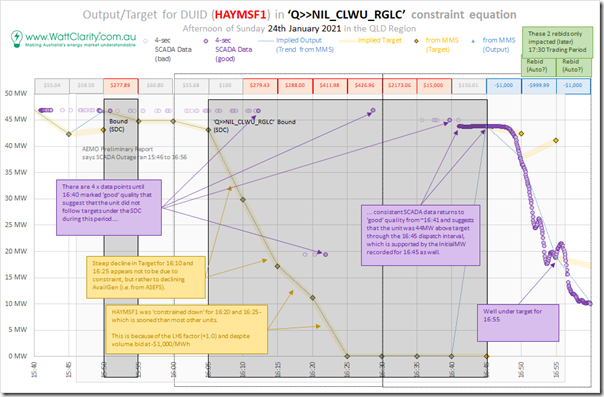
(C3e) Hayman Solar Farm (LHS factor = +1.0000)
Despite being in a different TNSP zone (to HAUGHT11 and MEWF1), the HAYMSF1 was also operating with the maximum LHS factor (+1.0).
Constraints were first felt from 16:20, with the unit constrained off for 16:25.
Like with a number of units, the 4-second SCADA data marked as ‘good’ quality does pose questions about what actually happened with output through the period.
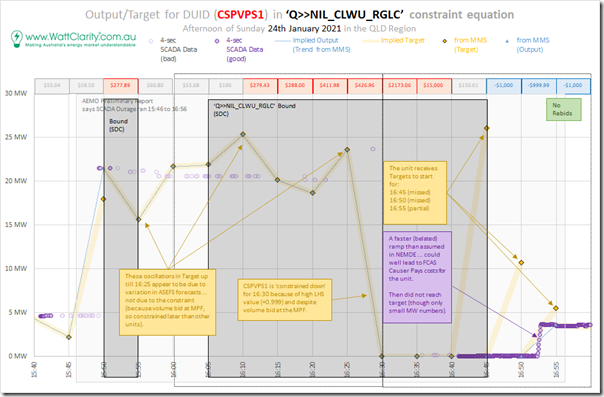
(C3f) Collinsville Solar Farm (LHS factor = +0.999)
With a LHS factor smaller than 1.0 (and volume at –$1,000/MWh), the CSPVPS1 unit was not constrained down until 16:30:
(C3g) Mackay GT peaker (LHS factor = +0.9996)
This station was also not operational through the 16 x Dispatch Interval focal window here.
———————-
It’s the links south from North to Central West that I had in mind when warning about ‘crunch coming in northern QLD’ almost 3 years ago now – but that’s another story…
———————-
(C4) Central-West zone
The ‘Central-West’ zone encapsulates Rockhampton out west to the coal fields of Blackwater and so on.
Dropping into Central-West we see (because of where we are in the network) that the LHS factors start to drop more significantly.
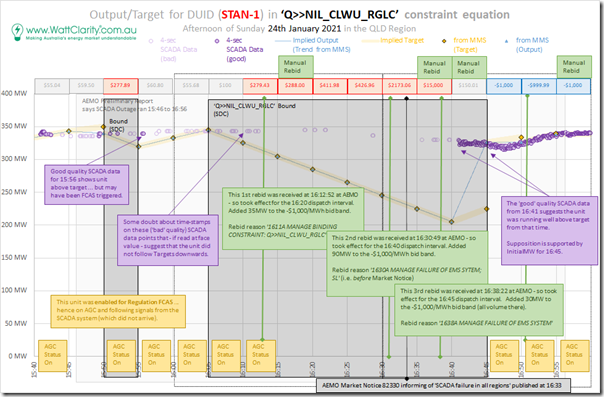
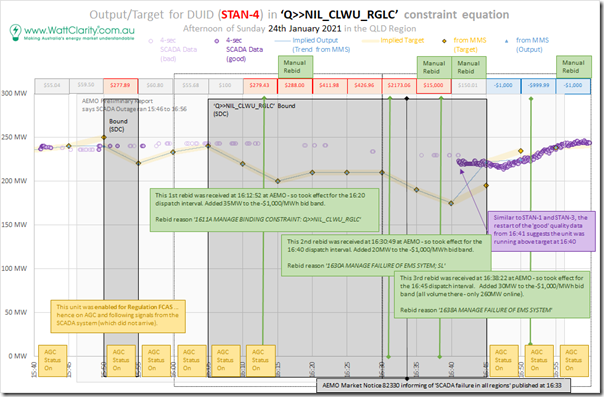
(C4a) Stanwell coal-fired power station (LHS factor = +0.9942)
Despite the lower LHS factor, the volume bid up above $35/MWh meant that STAN-1 first started being constrained down at 15:55 and 16:10:
The rebids shown here were designed to address this.
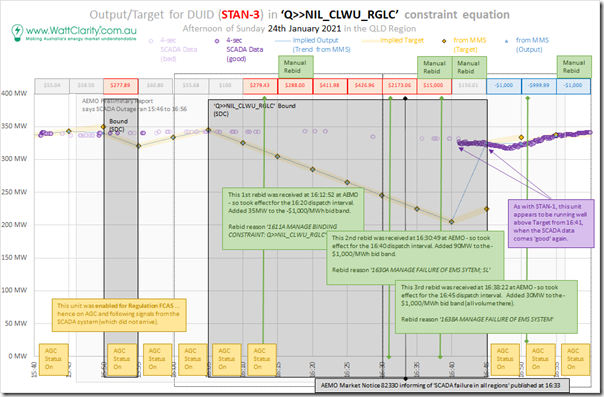
STAN-2 was offline at the time – so we’ll move onto STAN-3, where we see quite a similar picture:
Here’s STAN-4 (with less volume bid available from before the period of the SCADA issues):
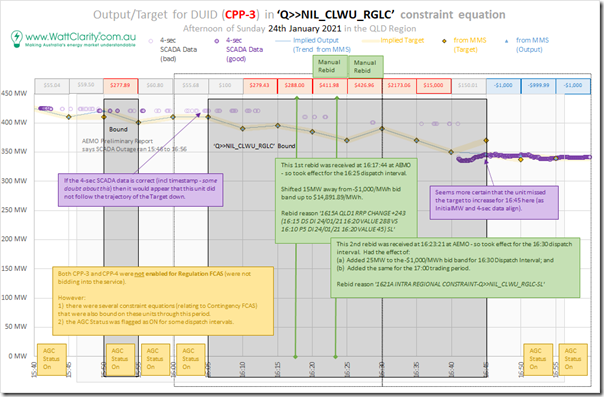
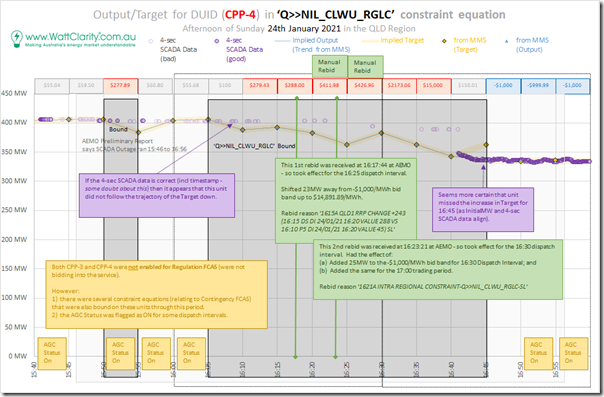
(C4b) Callide C coal-fired power station (LHS factor = +0.8309)
Here’s a view of CPP_3 during the focused period on Sunday afternoon 24th January:
From 16:35 all volumes was down at –$1,000/MWh (in a rebid received at AEMO 16:23 – i.e. before the price had spiked to the Market Price Cap).
Back on 24th January 2021 unit 4 was still four months away from the Callide C4 Catastrophe. Here is how CPP_4 operated over the 16 x dispatch interval focal period of that Sunday afternoon:
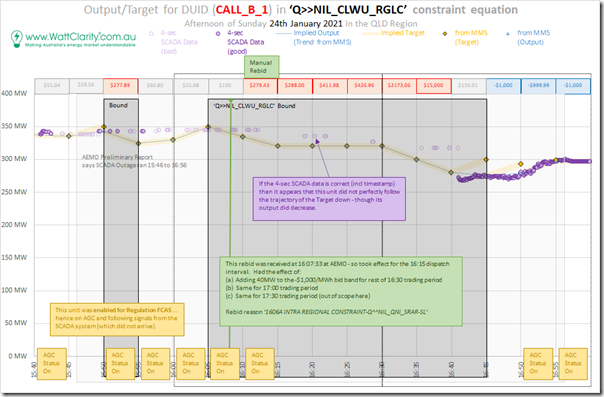
(C4c) Callide B coal-fired power station (LHS factor = +0.8309)
Here’s the CALL_B_1 unit (noting that the LHS factor was lower than that for the Stanwell units above):
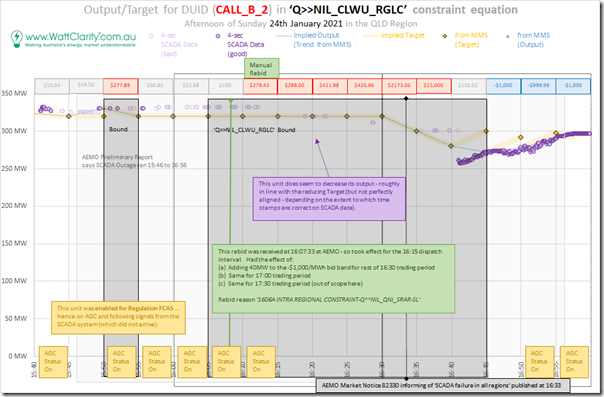
This difference in LHS factor (and also more volume down at –$1,000/MWh) were the two reasons why the unit was constrained down less significantly.
Here’s CALL_B_2 showing a similar picture:
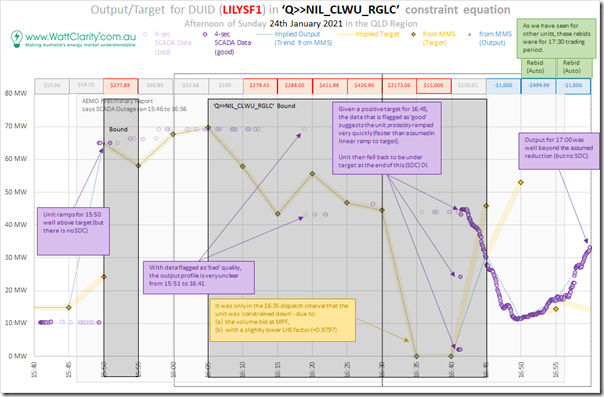
(C4d) Lilyvale Solar Farm (LHS factor = +0.9797)
We see LILYSF1 had volume bid down at –$1,000/MWh which, in combination with the lower LHS factor, meant not being ‘constrained down’ until 16:35:
Because the ROCDOWN rate was 20MW/min, this made it possible to be fully constrained off in that dispatch interval.
There was also a faster recovery (at 16:45) as the constraint progressively unloaded, but the 4-second SCADA data (that which is marked as ‘good’ quality) does pose questions about what actually happened in terms of output.
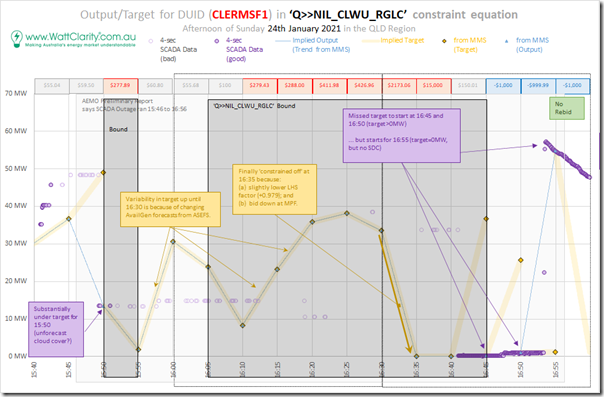
(C4e) Clermont Solar Farm (LHS factor = +0.979)
With a LHS factor slightly smaller than for LILYSF1, we see CLERMSF1 (also bidding –$1,000/MWh) was constrained off in the same (16:35) dispatch interval:
The unit also was given a target to recover just as quickly – but the 4-second SCADA data market ‘good’ quality suggests a temporary problem following the target up, which then over-corrected at 16:55.
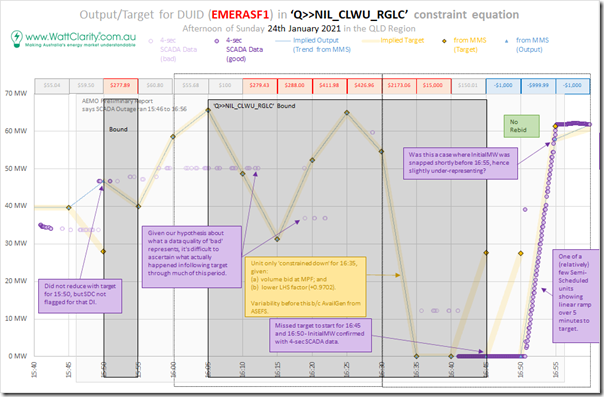
(C4f) Emerald Solar Farm (LHS factor = +0.9702)
The LHS factor drops (slightly) further to EMERASF1 – and the unit also bids down at –$1,000/MWh. The net effect is that it is still constrained off at 16:35 – and given a target to return at 16:45.
Similar to CLERMSF1, it appears that EMERASF1 had some problem initially following the target.
(C4g) Barcaldine Gas-Fired Station (LHS factor = +0.979)
This station was also not operational through the 16 x Dispatch Interval focal window here.
(C4h) Middlemount Solar Farm (LHS factor = +0.9781)
This station was also not operational through the 16 x Dispatch Interval focal window here (on 22nd January they had submitted a rebid noting that ‘hold point testing has been cancelled’ and there was no subsequent update through until 24th January).
(C5) Gladstone zone
Taking a coastal route down from Central West we end up at the ‘Gladstone’ zone, which encapsulates the Boyne Island aluminium smelter, the alumina refineries, the LNG export facilities (relatively small electricity consumption from the grid), other industrial load and the city of Gladstone itself.
It’s important for readers to note that with the following two zones (Gladstone and Wide Bay), the units in these zones have negative factors on the LHS … hence this constraint is trying to ‘constrain them up’.
(C5a) Gladstone station (LHS factor = -0.8142 (1,2,5,6) and -0.8048 (3&4))
Because of a different voltage connection point for units 3 and 4, the LHS factor in this constraint (and many others) is different for these units compared to units 1,2 and 5,6.
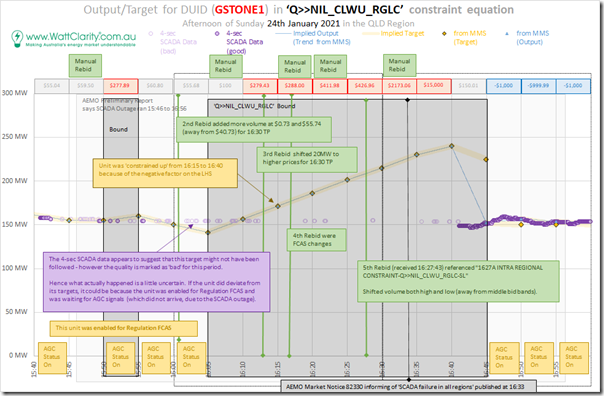
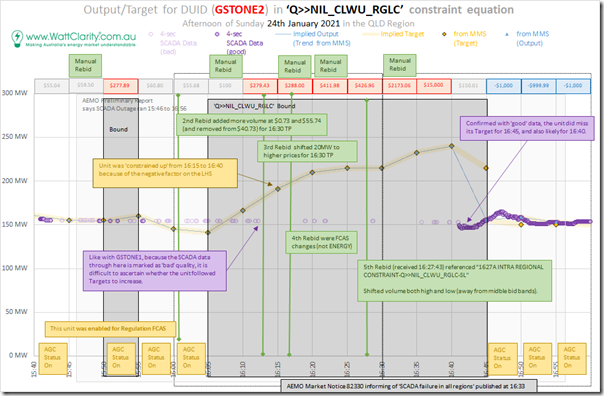
Above is GSTONE1 and below is GSTONE2 – the pattern looking quite similar:
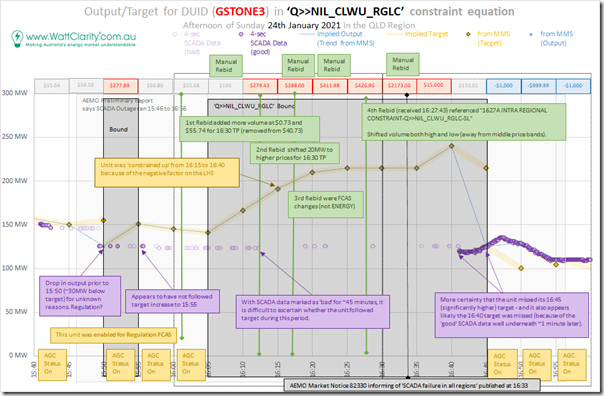
GSTONE3 has a different MLF … but this makes little difference at this macro level:
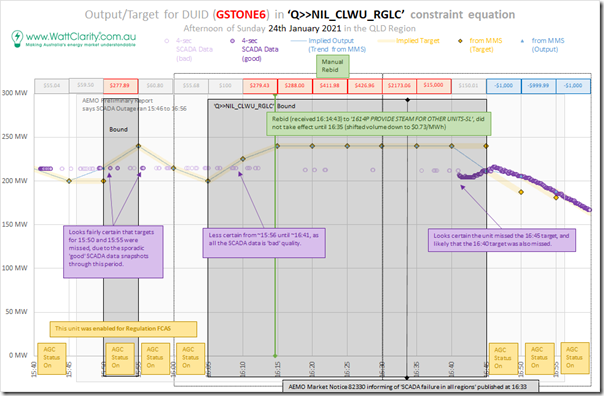
GSTONE4 and GSTONE5 were not operational, so we move onto GSTONE6:
Across all 4 of these units, the 4-second SCADA data is quite flat (i.e. not following target) but most of this is marked as ‘bad’ quality, so there is uncertainty about what actually happened through this period.
(C5b) Yarwun station (LHS factor = N/A)
Worth noting that the Yarwun station (associated with one of the alumina refineries) is registered as Non-Scheduled, hence not impacted by the constraint.
(C6) Wide Bay zone
South from Gladstone we meet the ‘Wide Bay’ zone, which for a long time had no sizeable generation sources, but now has two solar farms (and potentially many more). These also have negative factors.
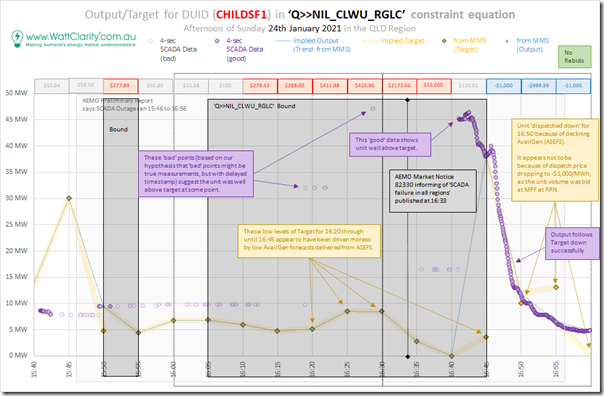
(C6a) Childers Solar Farm (LHS factor = -0.4937)
The CHILDSF1 unit was bid down at –$1,000/MWh, and the constraint would have been wanting to ‘constrain up’ the output – however it appears that ASEFS keeping energy-constrained Availability low due to cloud cover or other factor:
The 4-second SCADA data (both the ‘good’ quality and the ‘bad’ quality) hint at some uncertainty in terms of what actually happened.
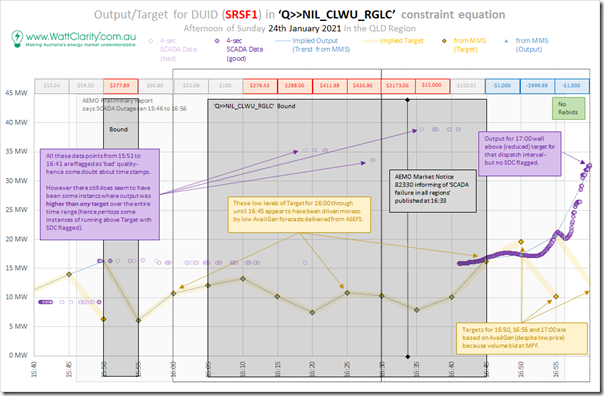
(C6b) Susan River Solar Farm (LHS factor = -0.4722)
It’s appears a similar picture for SRSF1 – i.e. bid down at –$1,000/MWh with the constraint wanting more output, but stymied by cloud cover or other factor:
The 4-second SCADA data (particularly the ‘bad’ quality) hint at some uncertainty in terms of what actually happened.
(C7) South-West zone
Taking the inland route (i.e. Calvale-to-Tarong) south from Central-West we arrive at the ‘South-West’ zone.
Down in the South-West zone (compared to the Central-West zone) the LHS factors, whilst still positive, are quite low. It would be expected, as a result, that the effect of the constraint would be comparatively muted.
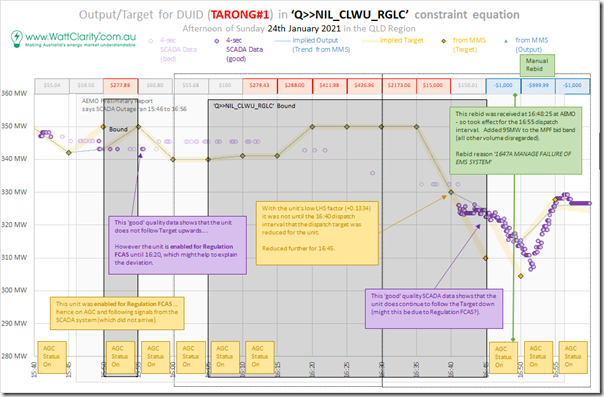
(C7a) Tarong A Coal-Fired Power Station (LHS factor = +0.1334)
Here’s a view of TARONG#1 – which rebid down to –$1,000/MWh from the 16:55 dispatch interval in as part of the ‘race to the floor bidding’ pattern that emerged as a result of the spike early in the Trading period:
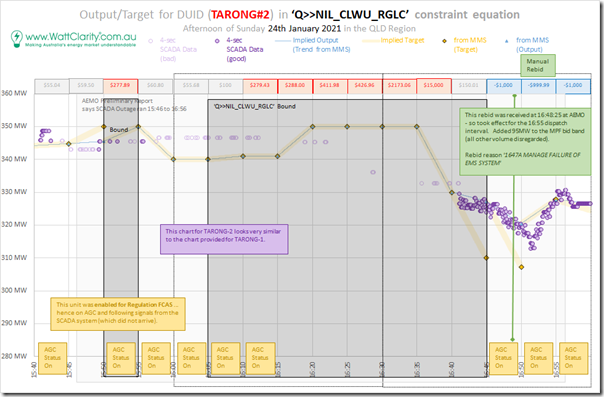
Note, above, that the unit only began to be constrained for 16:40 and 16:45 – and even in that instance it was with the combined effect of the ‘Q>>NIL_BCCP_RGLC’ constraint equation as well at 16:40. At 16:50 the constraint unbound, but was replaced by the effect of the –$1,000/MWh dispatch price.
This was also the case for TARONG#2:
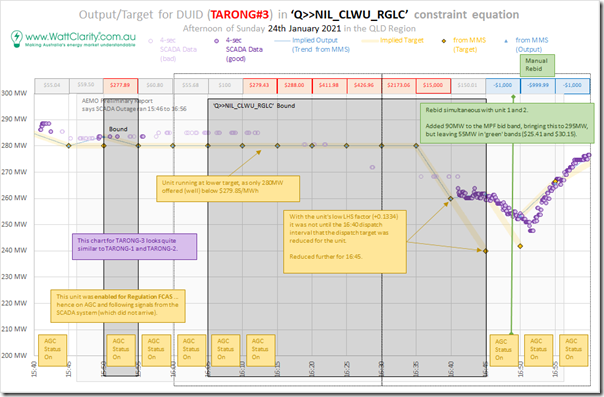
Here’s a similar picture for TARONG#3:
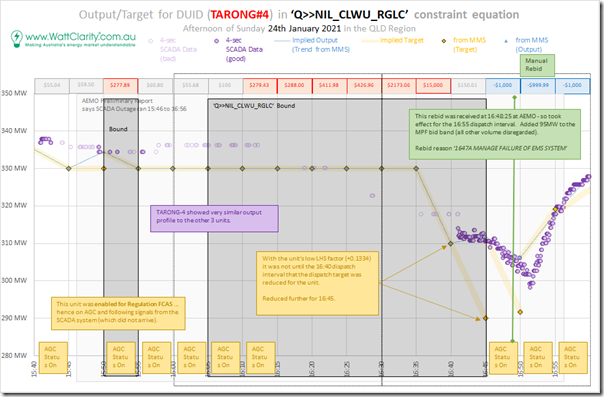
Here’s a similar picture for TARONG#4:
(C7b) Tarong B Coal-Fired Power Station – a.k.a Tarong North (LHS factor = +0.1334)
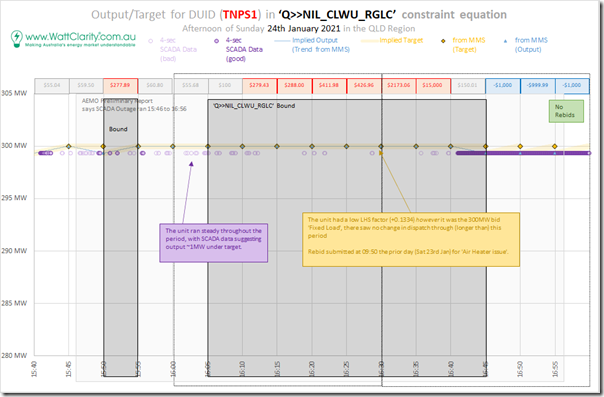
Here’s the chart for TNPS1 – which had bid 300MW at Fixed Load for the period, with the (sparse, and ‘bad’ quality) data available suggesting that it ran consistently through the period:
(C7c) Coopers Gap Wind Farm (LHS factor = +0.1499)
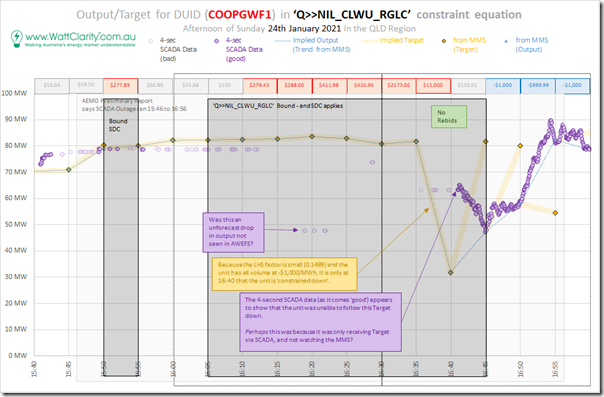
Here’s COOPGWF1, which was only constrained down for the 16:40 dispatch interval (also due to the ‘Q>>NIL_BCCP_RGLC’ constraint equation):
The unit was given targets to recover for 16:45 and 16:50. The lower target for 16:55 was because of the energy-constrained Availability dropping.
The 4-second SCADA data, denoted as ‘good’ quality from just after 16:40, shows a different output profile.
(C7d) Oakey Peaker (LHS factor = +0.09239)
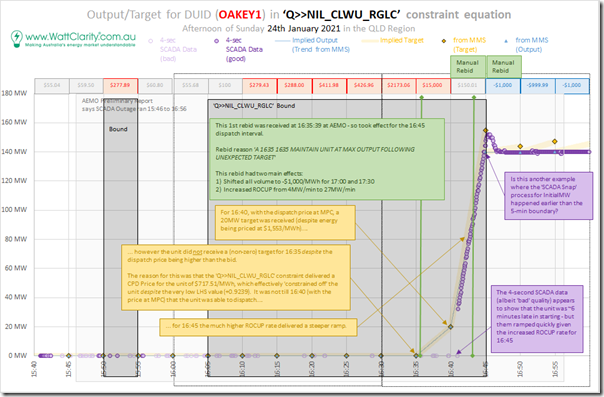
Here’s the profile for OAKEY1, highlighting how the unit rebid quickly in response to an unexpected target published just after 16:35:00 for the 16:40 dispatch interval:
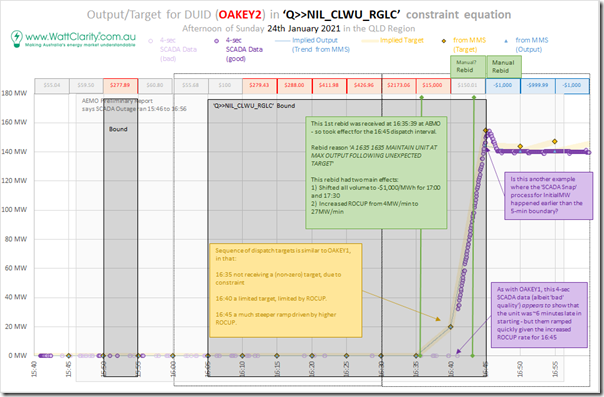
It’s quite a similar picture for OAKEY2 out until 17:00:
Because of the very low positive LHS factor, the ‘Q>>NIL_CLWU_RGLC’ constraint equation does not appear to have had any effect here.
(C7e) Oakey 1 Solar Farm (LHS factor = +0.09239)
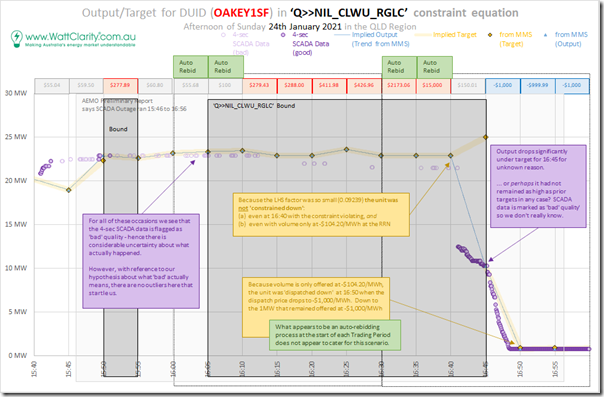
Here’s the OAKEY1SF:
Because of the very low positive LHS factor, the ‘Q>>NIL_CLWU_RGLC’ constraint equation does not appear to have had any effect here.
The unit only had 1MW bid at –$1,000/MWh with the remaining volume above that (exact bid band shifted through the rebidding noted).
The low LHS factor meant that the unit was only constrained down at 16:45 – with the target further reducing at 16:50 because of the negative dispatch price.
(C7f) Oakey 2 Solar Farm (LHS factor = +0.09239)
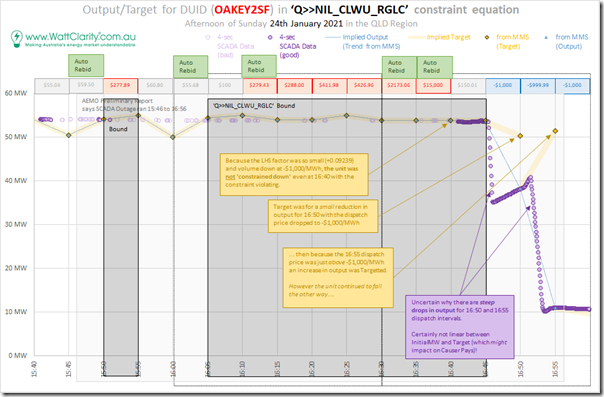
Here’s the neighbouring OAKEY2SF:
Because of the very low positive LHS factor, the ‘Q>>NIL_CLWU_RGLC’ constraint equation does not appear to have had any effect here.
It appears that some form of auto-bid algorithm was shifting most of the volume between –$1,000/MWh and –$78.15MWh at the RRN (but the cursory review of these approaches does not reveal how these rebids made any material difference).
(C7g) Yarranlea Solar Farm (LHS factor = +0.09239)
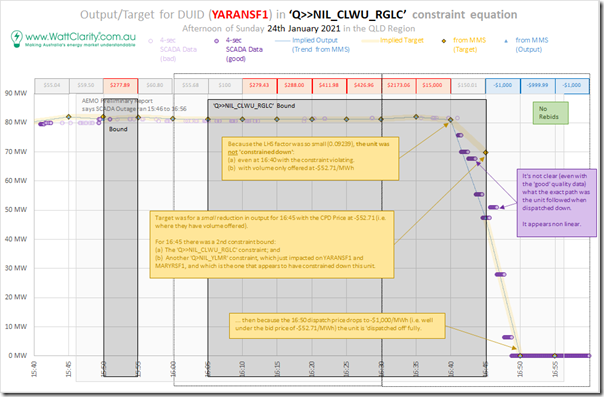
Here’s a view of what happened with YARANSF1:
Because of the very low positive LHS factor, the ‘Q>>NIL_CLWU_RGLC’ constraint equation does not appear to have had any effect here.
This unit had volume offered at –$52.71/MWh for the whole of the time range shown (no rebids). This explains why the plant was dispatched off at 16:50.
The earlier drop (at 16:45) was due to the ‘Q>NIL_YLMR’ constraint equation (with both YARANSF1 and MARYRSF1 having LHS factors of +1.0)
(C7h) Brigalow (a.k.a. Maryrorough) Solar Farm (LHS factor = +0.09239)
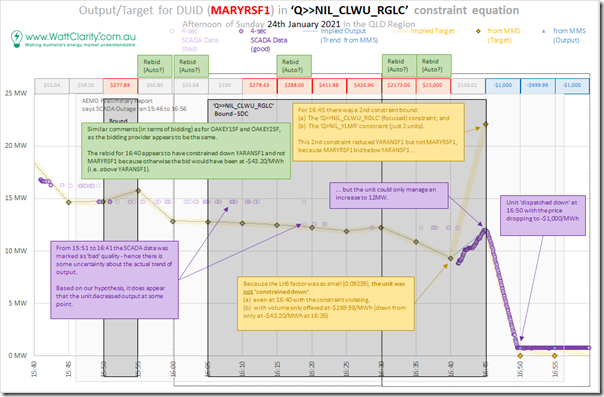
Here’s a view of what happened with YARANSF1:
Because of the very low positive LHS factor, the ‘Q>>NIL_CLWU_RGLC’ constraint equation does not appear to have had any effect here.
This unit also appears to have some kind of automated, or semi-automated bidding algorithm deployed, with rebid reasons the same structure as for some other units (this is being explored more systematically in GenInsights21). In the case of this unit, volume was cycled between –$269.98 and –$43.20/MWh.
Note that at 16:45 (where YARANSF1 was constrained down slightly due to the ‘Q>NIL_YLMR’ constraint equation) had no effect on MARYRSF1 because its volume was bid down below the YARANSF1 bid (i.e. the difference in bid price meant that the constraint targeted the more expensive energy offered at YARANSF1 first). However the unit was unable to rise all the way to its increased dispatch target.
Because this units volume was not offered down at –$1,000/MWh, it was dispatched off from 16:50. It’s not clear why the rebid logic did not adjust for this?
(C7i) Warwick 1 Solar Farm (LHS factor = +0.09235)
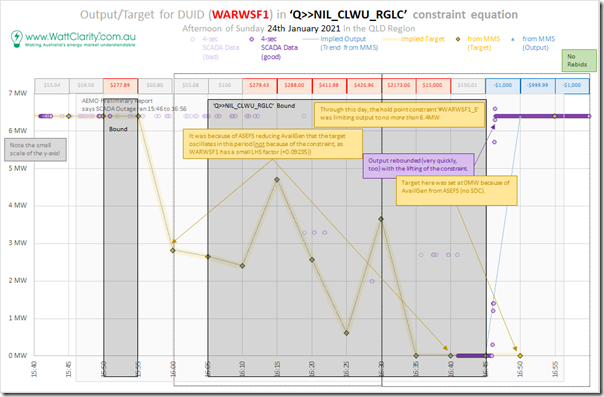
Here’s WARWSF1, which was operational at the time of this event:
Because of the very low positive LHS factor, the ‘Q>>NIL_CLWU_RGLC’ constraint equation does not appear to have had any effect here. The variation shown is due to (energy constrained) Availability.
Interestingly, the ‘#WARWSF1_E’ hold point constraint equation for 6.4MW limited output did impact on unit target at 15:55 with the (energy constrained) Availability spiking in that dispatch interval (not shown above). The unit did ramp back to 6.4MW output at 16:55 five minutes earlier than the target provided for.
(C7j) Warwick 2 Solar Farm (LHS factor = +0.09235)
The WARWSF2 was not operational at this time.
(C8) Surat zone
West of South-West is the ‘Surat’ zone, more recently created by Powerlink to support upstream (electrified) compression of coal seam gas.
(C8a) Condamine Gas-Fired Power Station (LHS factor = +0.1396)
The CPSA unit was not operational through the period of focus (though it did have bids to start in the next 30 minute period).
(C8b) Roma Gas-Fired Power Station (LHS factor = +0.1396)
The ROMA_7 and ROMA_8 units were bid up at $15,000/MWh (the MPC at the time), and played no role in the afternoon.
(C9) Bulli zone
South of South-West is the ‘Bulli’ zone, which encapsulates a growing number of stations on the northern end of the QNI interconnector.
(C9a) Millmerran Coal-Fired Power Station (LHS factor = +0.1135)
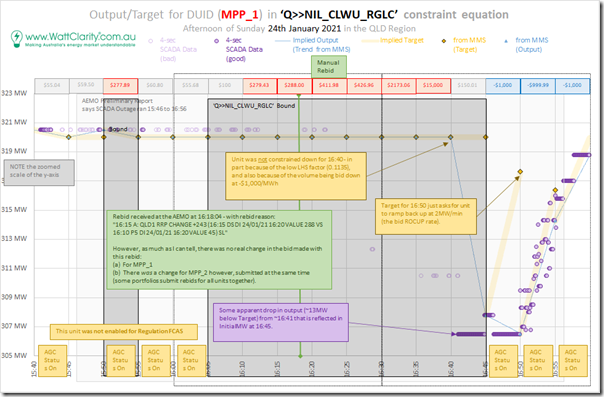
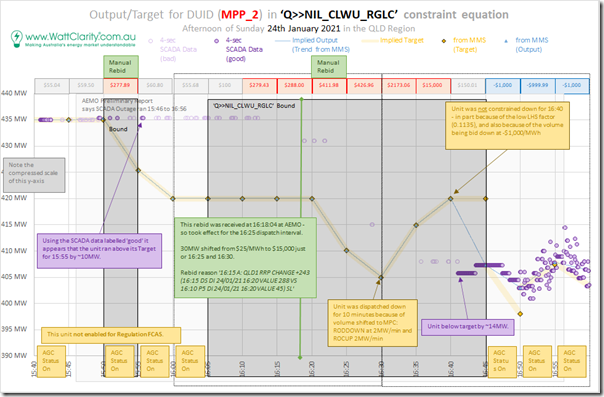
Here’s the same view for MPP_1 over the focused time range:
The unit bid at –$1,000/MWh for the time range and the LHS factor was quite low, so the ‘Q>>NIL_CLWU_RGLC’ does not seem to have had any effect.
Keeping in mind the zoomed in scale of the y-axis in this chart that makes the change seem larger than actual, there was a wobble in output for 16:45, 16:50, 16:55 that seems unrelated to target (and the automated ‘Conformance Status’ calculation inside of the ez2view ‘Unit Dashboard’ widget shows that this wobble would have been identified as ‘Off-Target’ in the progressive Conformance Status logic:
Here’s the same view for the MPP_2 sister unit:
(C9b) Kogan Creek Coal-Fired Power Station (LHS factor = +0.1404)
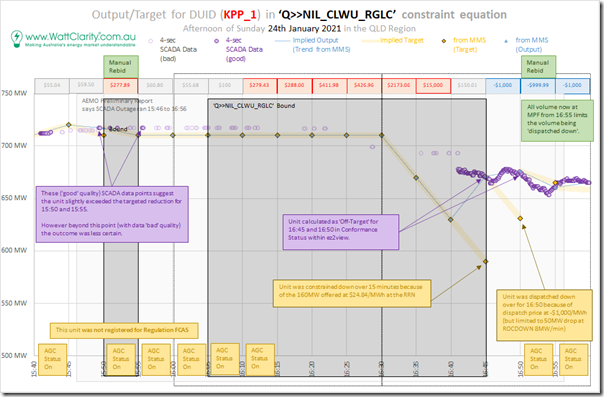
Here’s the same window for KPP_1:
The unit did have some volume (160MW) bid only at $24.84/MWh at the RRN for the early dispatch intervals (and 550MW at –$1,000/MWh), so the ‘Q>>NIL_CLWU_RGLC’ is shown to begin dispatching the unit down from 16:35.
At 16:50 (with the RRP dropping to –$1,000/MWh) the unit did see a targeted reduction (671MW to 631MW at the bid ROCDOWN rate of 8MW/min), but the unit instead appears to have increased to 676MW. A rebid from 16:55 shifted all volume down to –$1,000/MWh.
(C9c) Darling Downs CCGT (LHS factor = +0.1377)
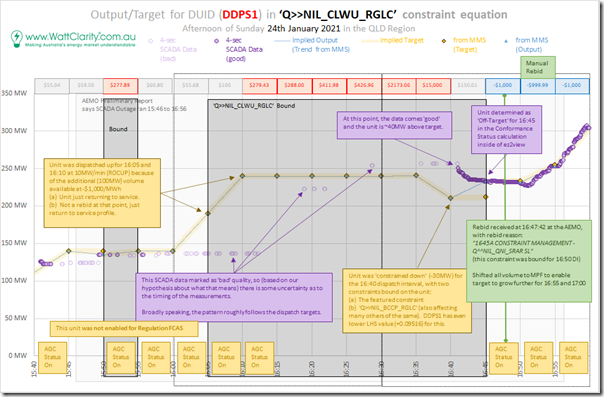
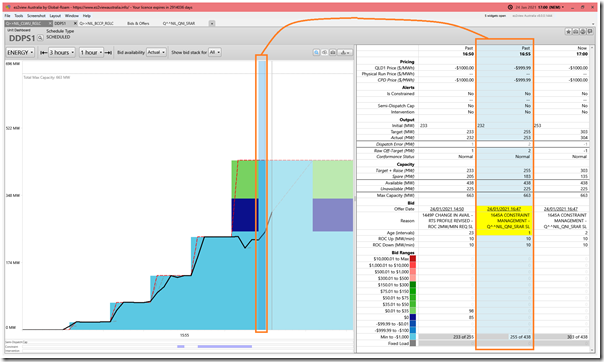
Here’s the same window for DDPS1, which had switched on earlier that afternoon at 14:30:
Because of the low LHS factor, and because most volume was offered down at –$1,000/MWh, the ‘Q>>NIL_CLWU_RGLC’ does not seem to have had any effect on dispatch targets. The exception was the 16:40 dispatch interval (which also saw the ‘Q>>NIL_BCCP_RGLC’ constraint bind and affect the same units).
We do see a rebid take effect from 16:55, shifting that additional volume down to –$1,000/MWh as a result of the ‘Q^^NIL_QNI_SRAR’ (affects capability of QNI) constraint equation binding.
Here’s a view in the ‘Unit Dashboard’ widget from ez2view:
(C9d) Darling Downs Solar Farm (LHS factor = +0.1377)
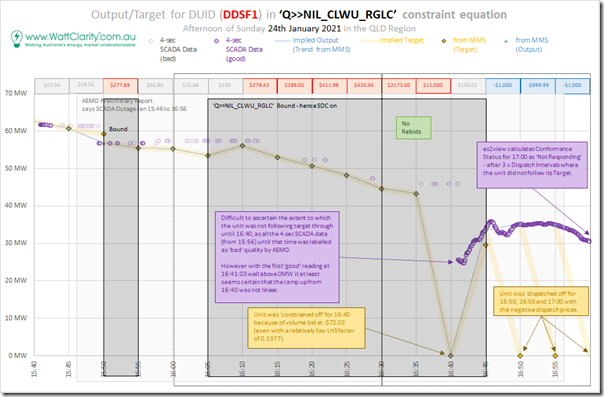
The same view for the DDSF1 is shown here:
This unit was not bid down at –$1,000/MWh (instead at –$72.03/MWh at the RRN) and so was fully constrained off at 16:40.
The 4-second SCADA data does present some questions about what actually happened with unit output then – and also afterwards for 16:50, 16:55 and 17:00 when dispatch prices down at or near the Market Price Floor delivered 0MW targets that the data (marked ‘good’ quality then) suggests were not followed.
(C9e) Braemar A Gas-Fired Peaker (LHS factor = +0.1385)
The BRAEMAR1, BRAEMAR2 and BRAEMAR3 units had no volume offered – and hence played no role during these 16 x dispatch intervals.
(C9f) Braemar B Gas-Fired Peaker (LHS factor = +0.1385)
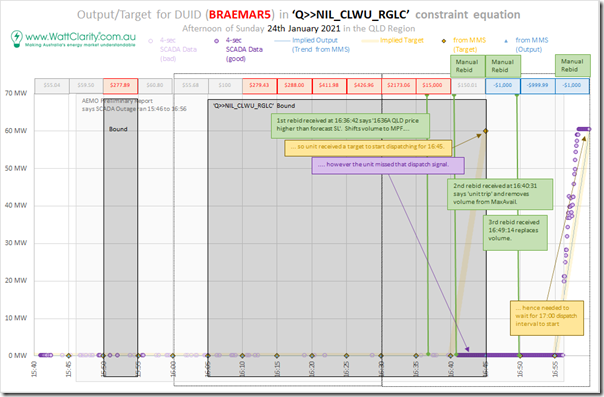
Here’s the same view of the BRAEMAR5 unit:
The unit initially had volume offered above $500/MWh, but rebid most of this to –$1,000/MWh at 16:45 and so received a target and failed to start.
1) The subsequent rebid reason ‘1640 Unit Trip SL’ explains why.
2) The unit subsequently did start successfully for 17:00.
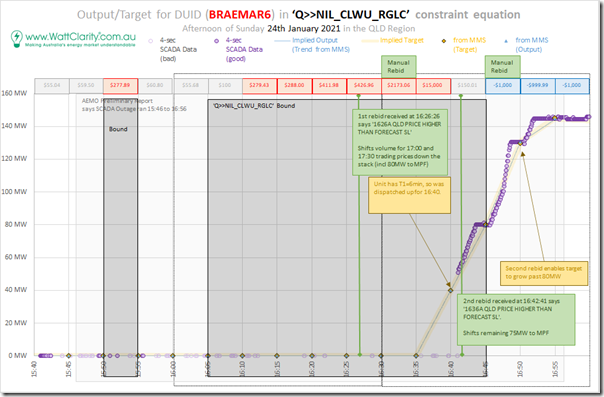
Here’s the neighbouring BRAEMAR6 unit:
The operations pattern was similar to BRAEMAR5 – except that the rebid occurred earlier (submitted 16:26 to take effect for 16:35) and the start was was more successful.
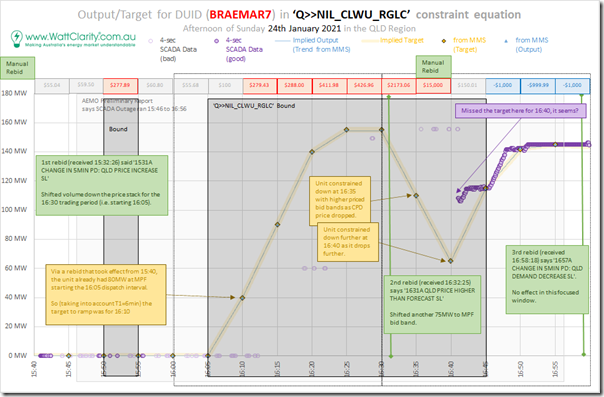
Here’s BRAEMAR7:
This unit had targets to start from 16:05 (i.e. first dispatch interval in 16:30 trading period) – earlier than the other two units, as a result of a rebid submitted at 15:31 noting ‘change in 5MIN PD: QLD Price Increase’.
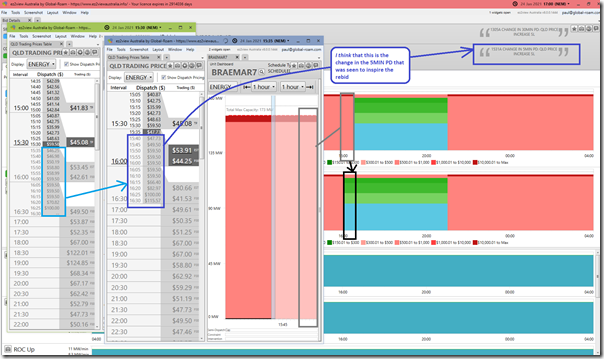
Out of curiosity I had a look at what the initial conditions seems to have been, to prompt the restart in this collage of 3 windows from ez2view Time-Travelled to different dispatch intervals on Sunday 24th January 2021:
Whilst (in retrospect) it certainly turned out prescient for BRAEMAR7 to have a target to start from 16:05 with the price climbing in that trading period, it’s not immediately obvious to me what it was in the P5 Predispatch price forecasts referenced in the rebid reason that would have prompted the decision to rebid. I obviously have much more still to learn!
(C10) QNI interconnector (LHS factor = +0.1205)
Not a zone in itself, but we’ve also looked at what happened for QNI, as well.
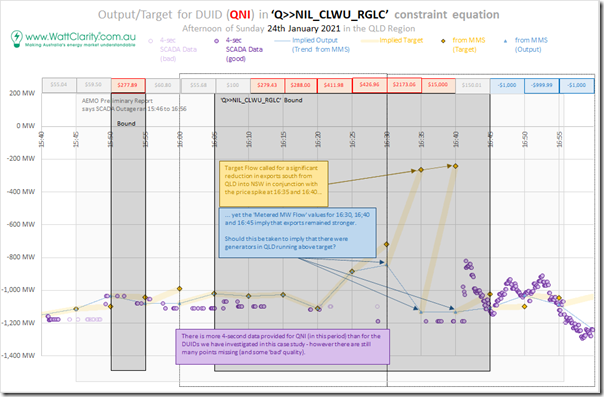
Here’s a view of what we see happened with QNI – where, quite understandably, the ‘actual’ flow was significantly different than that implied in the dispatch targets (given the mismatch between what NEMDE was assuming as Initial MW, hence cascading through to targets).
Ultimately, the interconnectors obeyed the laws of physics in relation to any imbalance between supply and demand in each region. We presume (though have not looked) that the interconnectors between the other regions showed similarly large deviations.
(C11) Zones not discussed
Not discussed here are the stations in the ‘Moreton’ zone (which encapsulates Brisbane and the Brisbane Valley) and the ‘Gold Coast’ zone.
(D) Two other questions
Two other quick questions, which perhaps we (or someone else) could delve into?
(D1) Contributions of Primary Frequency Response
One unfortunate by-product of the loss of SCADA signals was that the 4-second pulses sent to mainland generators (8 seconds in Tasmania) for the purposes of Regulation FCAS control were no longer received by generators.
(a) At a local level, this led to some generators not following their targets, as we have seen above.
(b) More systemically, however, it seems likely that it would have led to no control of frequency within the bands at which Contingency Frequency control triggers – had it not been for the relatively recent initiative of generators starting to provide Primary Frequency Response (PFR) again, to keep the system stable.
We have no real way of understanding this – and will look forward to reading this portion of the AEMO’s final Incident Report with great focused interest!
(D2) Market Suspension?
With SCADA data feeds disrupted across the NEM, with the resultant flow-on effect for those generators relying on SCADA for dispatch targets and other data, it does beg the question about the point at which the market might have been suspended – where dispatch and pricing were compromised? I think this might be Rules 3.8 and 3.9?
(E) Why do we complete analysis like this?
Back in November 2019 we drew specific attention to these two big reasons why we engage in forensic analysis of NEM events, such as in this series of articles (and also, at a deeper level, through reports like the upcoming Generator Insights 2021).
This exercise (whilst it has been frustrating to find the time to give it focused attention) has been worthwhile for us, as it has identified other enhancements we can make to our software products (particularly ez2view ) moving forwards. We’ll look forward to letting our clients know as these enhancements are rolled out in the months ahead.
Do you know of people who can help us – to do more of this analysis, or who can drive the quality of our analysis even further?


Leave a comment