On Friday 2nd July 2021 – right at the end of quarter – we looked back at price outcomes in a Q2 2021 period that’s been ‘anything but boring’.
Since that time, we have continued to ponder what happened (both with respect to looking particularly at the quarter, but also in terms of broader questions being explored in the preparation of GenInsights21).
Spurred in part by the AER publication last Friday, I thought it would be useful to put this article together as a general reference to some of the significant contributing factors…
(A) References used in what follows
In coming to understand what was happening through the quarter, and now in collating the list of contributing factors – at (B) below – I’ve found it useful to refer to four different kinds of sources:
|
Source 1 |
Source 2 |
Source 3 |
Source 4 |
|
One of the advantages of a blog-style insight sharing tool like here at www.WattClarity.com.au is that insights can be progressively explored and shared as the event unfolds. That was certainly the case through Q2 2021, with many articles published in April 2021 (a few), May 2021 (many) and June 2021 (even more). This was an advantage not only to readers (who were able to access insights sooner), it was also an advantage to us (both internally at Global-Roam Pty Ltd, and to our valued guest authors as well) as it allowed us to progressively ‘peel the onion’ to explore in greater depth as time has allowed. Now that the quarter’s over, we’re able to look back at the quarter on a more systematic basis in articles like this. |
On Friday 23rd July 2021 the AEMO released its Quarterly Energy Dynamics for Q2 2021: I’ve found that the QED, as it has been progressively developed over recent years, has evolved into being a very useful reference resource for a particular time-slice in history. |
Just last Friday (13th August), the AER published its Wholesale Markets Quarterly for Q2 2021: This is not something I’ve read as frequently as the AEMO’s QED (no particular reason other than general busyness) – but I did read it with respect to Q2 2021 given the heightened level of interest in what unfolded through the quarter. Indeed, it was publication (or perhaps more correctly my reading of this report) that prompted me to put this article together. |
In addition to these three main sources of analysis and insight about Q2 2021, I’ve also tried to keep my eye out for other pieces of analysis from a wide range of sources. Some of these were noted in various WattClarity articles through the quarter. |
With the use of these four types of reference, let’s move on to summing up the contributing factors…
(B) Some of the contributing factors
In the table below, we highlight some of the factors that contributed to the price outcomes seen through Q2 2021. Others factors will be linked into this table as other articles are subsequently written.
| Contributing Factor | Brief Summary Notes |
| High Electricity Consumption |
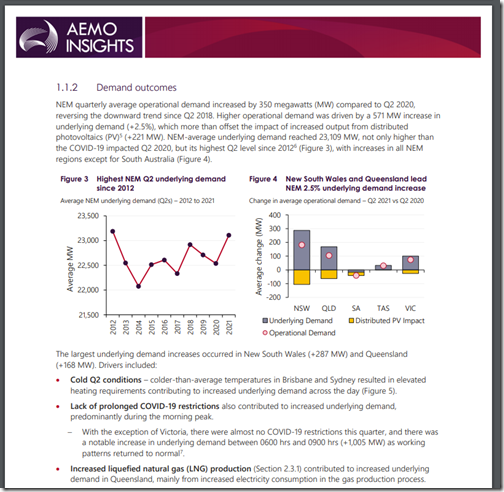
In section 1.2.1 of the AEMO’s QED (P10 of the PDF), the AEMO highlights increased electricity demand as one of the two ‘general drivers of increased electricity price this quarter’. On p7, the AEMO notes that there was a significant increase in underlying demand, averaged across Q2 2021 when compared against Q2 2020: Three factors are listed in contributing to this increase in the average consumption over the quarter: Factor 1 = colder Q2 conditions than prior years (particularly in QLD and NSW) Factor 2 = absence of COVID restrictions, except in VIC, compared to Q2 2020 Factor 3 = higher electricity consumption for upstream gas compression for LNG export. To me, Factor 1 and 3 seem clearly significant and Factor 2 seems more uncertain (my prior analysis of COVID effects showed it was difficult to see a huge difference in aggregate through 2020 in any case) As shown in AEMO’s Figure 4 above, these increases in underlying consumption were not outweighed by ongoing growth in rooftop PV, as a result of which Operational Demand (i.e. ‘Grid Demand’) was also increased. ———- Section 1.8 of the AER report (p30 of the PDF) notes that: “Demand increased over the quarter as temperatures fell and there were some particularly cold days.13 14 On June 10, Sydney had its coldest June day in 100 years and NSW experienced its highest Q2 daily demand since 2010 (Figure 1.25). Increased demand at a time that supply was reduced due to generator outages lead to more volatile prices (section 1.1). For example on 10 June, prices in NSW rose to above $5,000/MWh.” Here’s a record of some two-region volatility seen at 17:10 (and afterwards) on Thursday 10th June, published on that day in WattClarity. ———- Perhaps a larger point is that, whilst the AEMO analysis speaks about average underlying demand (i.e. aggregate consumption over the quarter) – which would have affected underlying ‘all hours’ prices in the QLD and NSW regions in particular, it would be peak demand that was present for many of the extreme price spikes. Time permitting in a future article I might have a chance to look at how those compared to prior Q2 periods. |
| Coal Unit Unavailability |
In section 1.2.1 of the AEMO’s QED (P10 of the PDF), the AEMO highlights thermal generator outages as one of the two ‘general drivers of increased electricity price this quarter’. It should be noted here that AEMO highlighted not just coal unit outages. The AEMO also notes (p17 of the PDF) that: “Despite a significant level of outages, black coal-fired output was comparable to Q2 2020. This was due to available generators running at high capacity factors, including units at Stanwell and Eraring. ” ——— The AER, in the Executive Summary of their report (page iv), highlight coal unit unavailability as one of the two main causes of the higher prices: “These high prices were largely driven by a high number of planned and unplanned coal generator outages, as well as network (line) outages that limited Queensland and NSW’s ability to import cheaper generation from other regions.” ——— Frequent readers here will remember the ongoing coverage of two of the headline events from Q2 2021 affecting coal units: 1) The Callide C4 Catastrophe that rolled on from Tuesday 25th May 2021 and still continues; and 2) The Yallourn flooding from Friday 11th June However these two events were added to the mix in a quarter where (as shown here in this article) aggregate availability of all black coal units across QLD and NSW had been towards the lower end of performance experienced
|
| Outages at Gas and Hydro plant |
It was not specifically mentioned in the AER’s report (unless I missed it) and we also did not single it out in articles on WattClarity through the quarter, but worth nothing that AEMO also flagged (section 1.2.1 at P10 of the PDF), that it was not just coal plant outages – but also at gas and hydro plant as one of the two ‘general drivers of increased electricity price this quarter’. AEMO says: “Outages at Braemar 1, Darling Downs and Swanbank E reduced gas-powered generation (GPG) availability by 773 MW.” “Hydro availability reduced by 668 MW, with the largest availability reductions occurring at Shoalhaven (due to an extended outage), Murray, and Tumut 3..” Note that AEMO bundles these all under a ‘Thermal generator outages’ heading, so you may have missed the reference to hydro if you did not read closely!
|
| High Gas Prices |
As a result of the unexpectedly low coal unit availability, gas plant was required to run more (such as discussed here on 3rd June) – which (combined with additional factors) drove gas prices higher (extending into July as noted here). These higher gas prices flowed through into the bid prices offered by gas-fired generators in the NEM. The correlation between these higher gas prices and the higher electricity spot prices was shown by Allan O’Neil in his appetiser in ‘Eating the NEM’s Q2 Elephant’ article. ——— Section 1.10 of the AER’s report (p32 in the PDF) notes: “Gas input costs increased over the quarter in every region. For example, the Queensland gas proxy input cost rose from below $51/MWh in March to above $87/MWh in June 2021, the highest level we have observed since July 2016. The drivers of rising gas spot prices in June included unexpectedly high domestic demand for gas powered generation and rising international gas prices (section 2.1). The price set by gas generators in Queensland increased as the quarter progressed and exceeded the proxy input costs by over $510/MWh in May and June, driven by numerous high priced events in the region when the most expensive peaking gas was needed to meet demand.”
|
| Constraints |
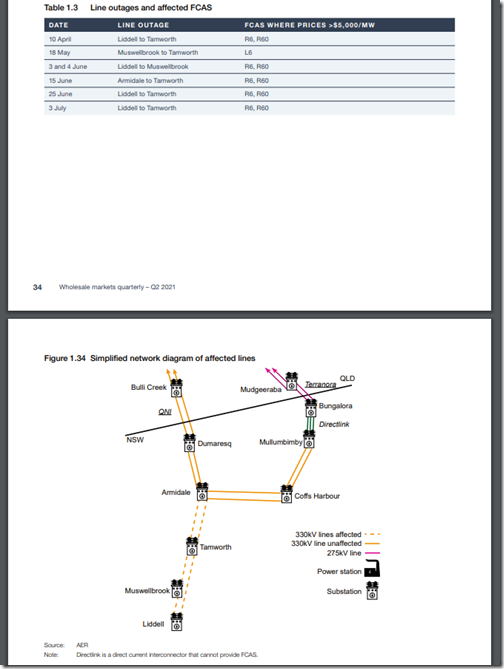
The AER, in the Executive Summary of their report (page iv), highlight coal unit unavailability as one of the two main causes of the higher prices: “These high prices were largely driven by a high number of planned and unplanned coal generator outages, as well as network (line) outages that limited Queensland and NSW’s ability to import cheaper generation from other regions.” In section 1.7 (on p29 of the PDF) there was this additional note: “NSW’s access to cheaper generation from Victoria on the Vic-NSW interconnector was also limited in Q2 2021 which contributed to higher prices in both NSW and Queensland. When NSW was importing from Victoria, flows were constrained 40% of the time in Q2 2021 compared to 25% of the time in Q2 2020, with line outages accounting for two thirds of those constraints. On average, imports into NSW from Victoria were limited to around 520 MW during the evening peak due to planned outages around Canberra and South Morang in Victoria. Without line outages, the normal limit on the Vic-NSW interconnector is around 1,300 MW.” ——— I did also note (on p39 in the PDF) there is discussion about how ‘QNI upgrade meant local FCAS was required’ with this diagram of the parts of the network affected by outages as part of the QNI upgrade: The AER report shows how these outages contributed to high FCAS prices in QLD (which was something also discussed in Allan’s ‘second serving of the elephant’ article – and they would also have contributed to ENERGY price outcomes as well in QLD and NSW. ——— We need to remember that there were also constraints on the VIC-NSW interconnector that (at times) played a significant role in the price volatility seen in QLD and NSW but not in VIC. |
| Low Wind, at times |
Section 1.11 of the AER’s report talks about increased capacity of solar (particularly NSW) and wind (particularly VIC) during the quarter – from p22 in the PDF. “Of all fuel types, wind generation increased the most in Q2 2021 compared to Q2 2020 with the majority of that increase coming from Victoria. In Victoria, average wind generation increased by 30% compared to Q2 2020. Wind generation increased in every other region, except South Australia which experienced mild conditions at the start of the quarter”. However the AER report (p22 of the PDF) also notes that: “However on 17 and 18 May, calm conditions saw wind generation fall across all 3 regions at the same time. At its lowest point only 320 MW was generated out of a possible 6,500 MW of capacity. The lack of low priced wind capacity was one of several factors that contributed to prices rising above $5,000/MWh in the 3 regions. The other factors included unavailable baseload generation due to outages and high demand.”. Early in the evening of Monday 17th May we’d captured this snapshot of what was happening at 17:40 – with: 1) Prices up in all 4 mainland regions; and 2) Low wind generation, NEM-wide. ——— The AEMO QED notes (p23 of the PDF) about a ‘wind drought’ in April 2021: “South Australian wind output declined to 594 MW, its lowest quarterly average since Q1 2019, largely due to very low wind speeds in April (Figure 36). South Australia’s wind farm capacity factor during the month was only 21%, substantially lower than April 2020 (29%) and April 2019 (31%), with a prolonged period of low wind output between 23 April to 29 April.” “While Victorian wind farms experienced similarly still conditions to South Australia in April, increased output from ramping up of recently installed capacity (Berrybank and Bulgana wind farms) more than offset the decrease.”. These lulls in the wind occurred before the issues at Callide and Yallourn, so did not coincide with exceptional volatility.
|
| Low Solar, at times | Worth noting this example highlighted on Tuesday 20th April 2021 when unexpectedly low solar harvest due to a widespread rain event in QLD was one of the reasons for spot price volatility seen on that day.
|
Hopefully some readers will find this useful as a launch page to understanding some of the factors that were relevant to delivering price outcomes in Q2 2021 that were ‘anything but boring’.


Leave a comment