
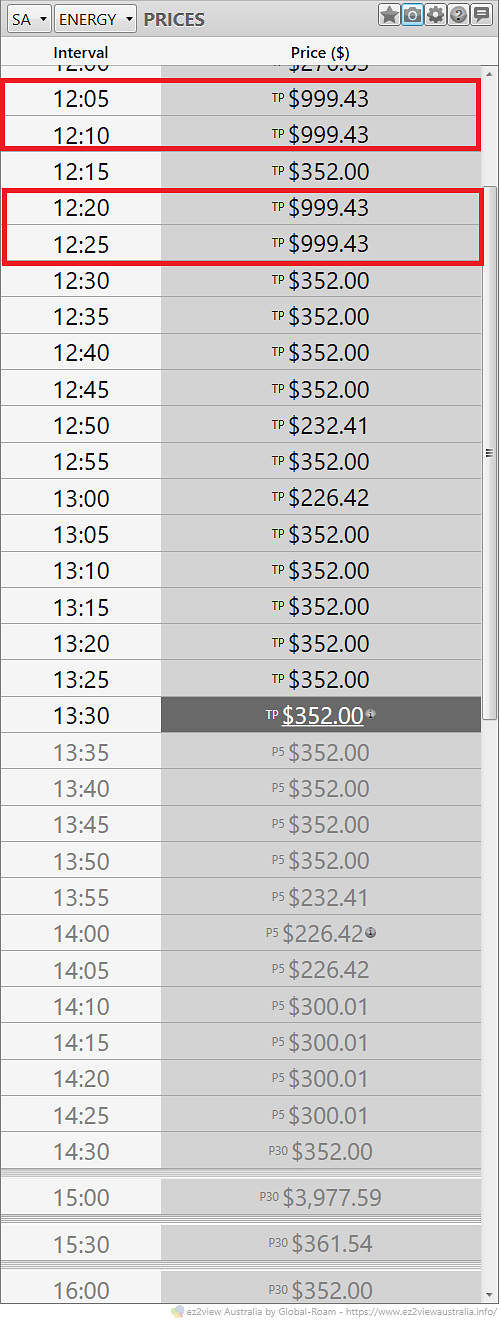
Energy spot prices reached $999 $/MWh in SA on 1st August 2023 at 12:05 and 12:10, and again at 12:20 and 12:25.
Observations
The higher prices, initially, provoked some surprise. Usually SA is swimming in cheap renewable energy during the midday hours.
A glance at our internal dashboards captured the situation.
Firstly, with SA prices via ez2view, we saw prices remain above 300 $/MWh following the highlighted spikes to 999 $/MWh just after 12:00.
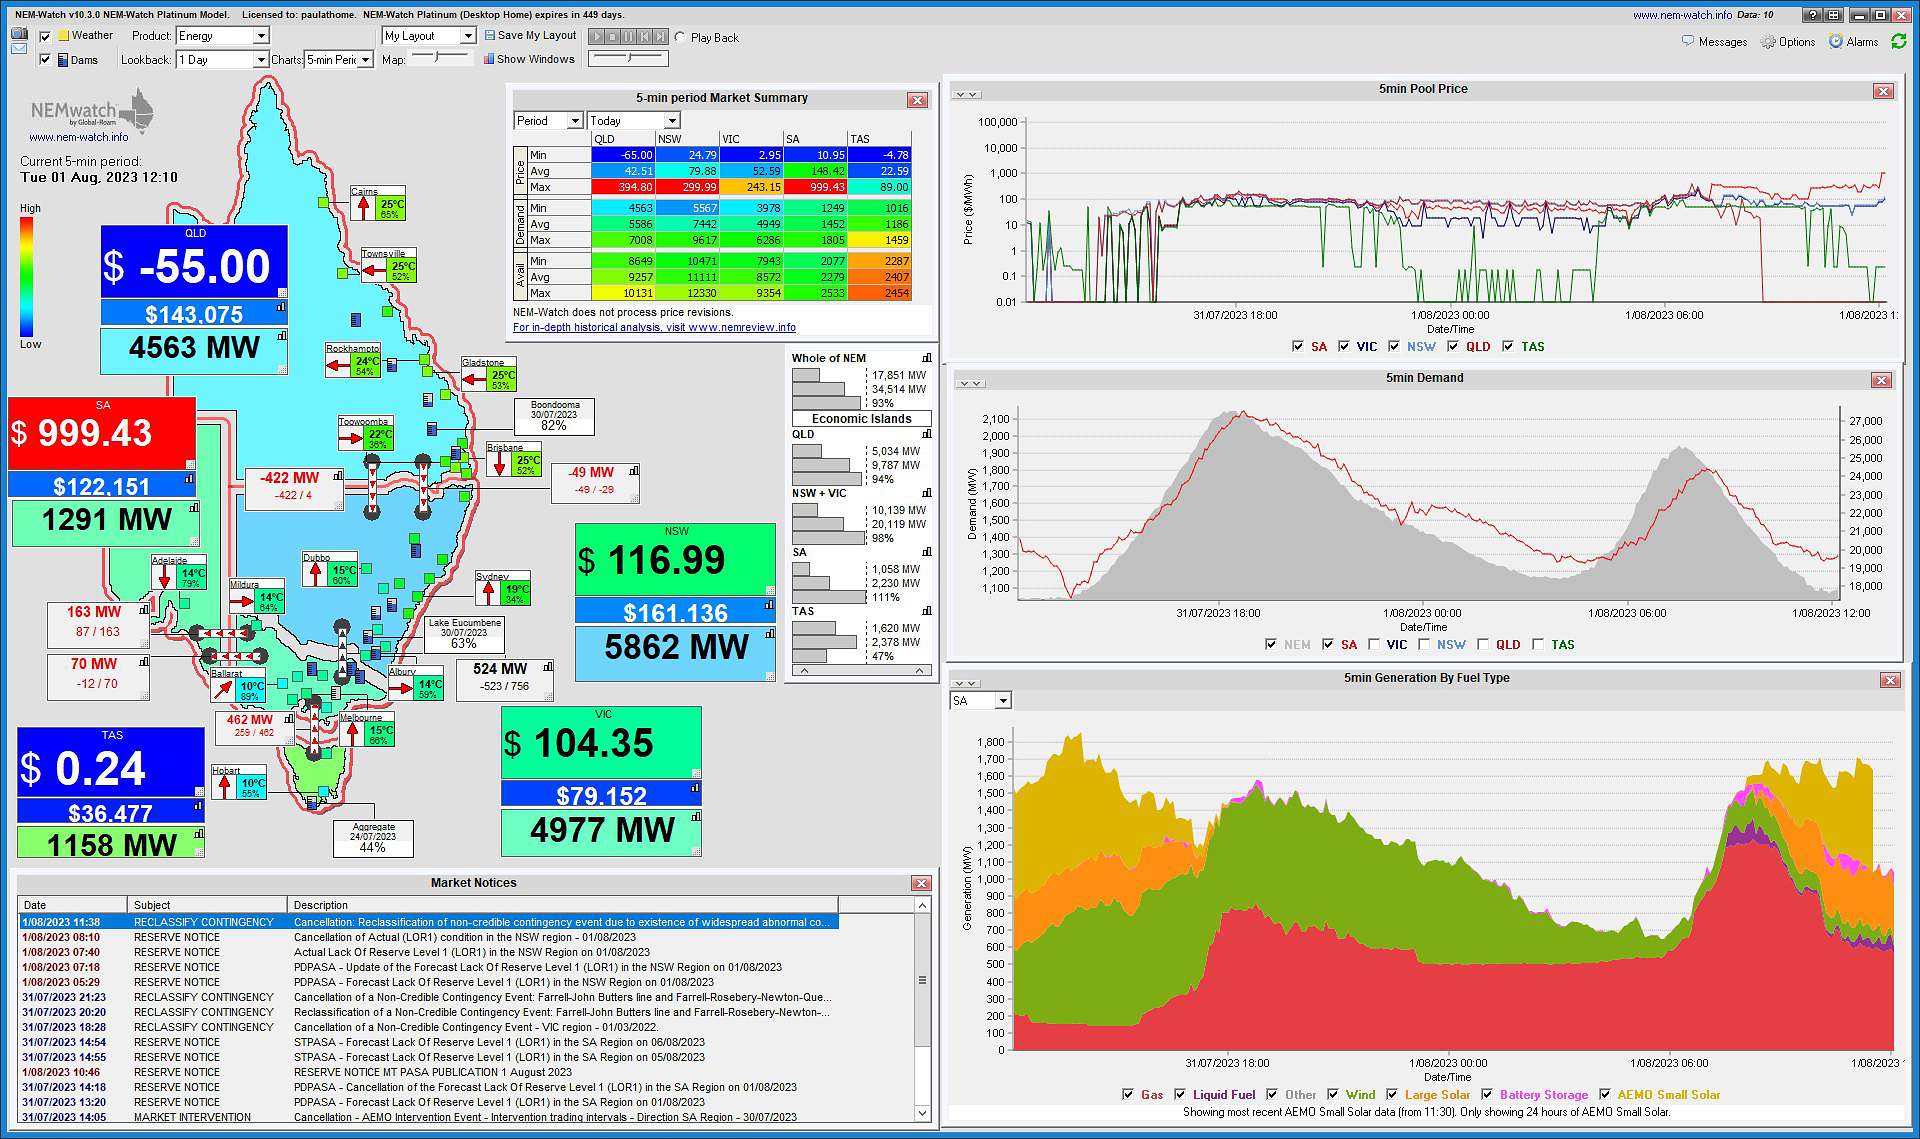
And in the context of the other NEM regions, using NEMWatch, interconnector flows were of interest. For the 12:10 interval we noted:
- Exports from VIC to SA across the Heywood interconnector were limited (to 70 MW at 12:10). Yet, across Murraylink (at the north of VIC, into SA) the flow was healthy albeit also at limit (163 MW into SA at 12:10).
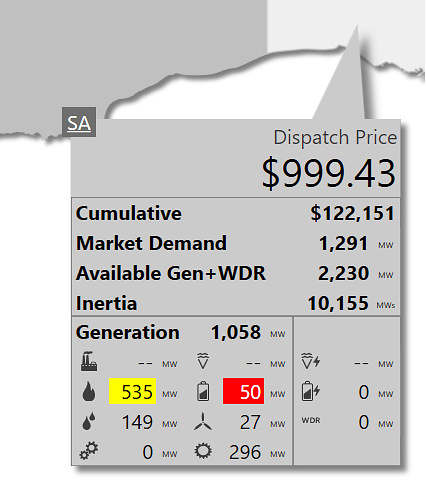
With the following excerpt from ez2view’s NEM Map:
- Wind power generation was down (to 27 MW at 12:10), and slipped into the teens in subsequent dispatch intervals.
- That’s 1% of the 2536 MW of installed capacity.
- Large Scale Solar power generation was low (296 MW at 12:10).
- Just above 50% of installed capacity.
- Gas powered generation of 535 MW had been running to help meet a market demand requirement of 1,291 MW at 12:10.
This general theme, of constrained imports and light wind power generation, was observed to follow in subsequent intervals helping to sustain prices above $300 $/MWh.
Drivers
Constrained interconnector
Using ez2view we were able to see that the constraint on the Heywood interconnector is for a planned outage impacting one of the South East to Tailem Bend 275kV lines. The “S-TBSE” set, currently due to last 6 days.
The lack of wind
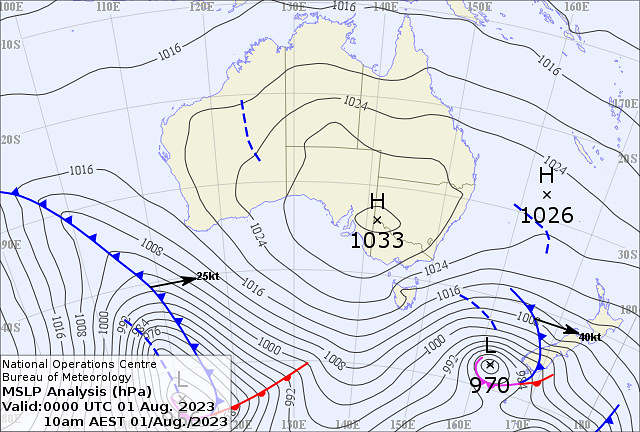
A large high pressure system is slowly moving across the southern NEM states. Currently it is centered on top of SA and this is leading to the light wind conditions at wind farms in the region.
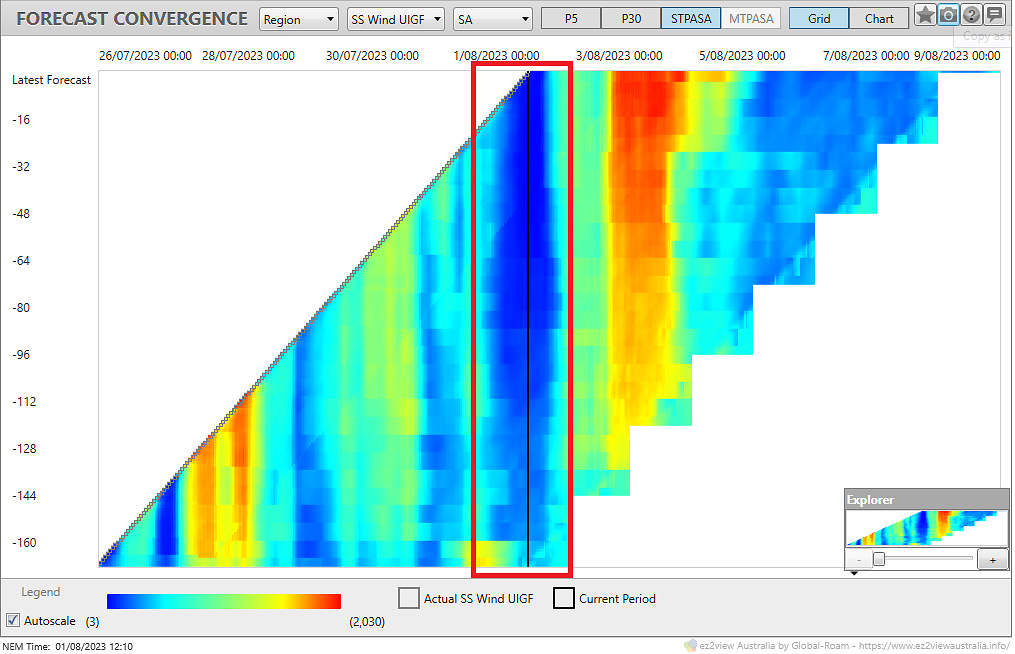
We’ve recently enhanced ez2view to display the forecast unconstrained wind power generation into the STPASA timeframe (~7 days).
The following visualisation from 12:10 shows the lack of wind power potential (blue cells, highlighted by the the red box). It was well anticipated in advance: we can see that it was anticipated 160 30-minute intervals in advance which equates to 80 hours, or more than 3 days ahead. Yet the strength of wind lull appeared to emerge more accurately about 80 intervals in advance (1-2 days in advance).
Looking forward
Briefly, looking forward, we note the wind power generation forecast (available at 12:10) suggests a return to higher levels from around 21:00 today, and increasing to 1,900 MW by late tomorrow (2nd August).
Postscript
These aspects directly relate to the GenInsights Quarterly Updates for Q2 2023 Among a treasure trove of insights on the NEM (both physical and financial) the analysis includes a quarterly and longer-run assessment of the forecasts of unconstrained wind generation availability. As the energy transition progresses, and more and more wind powered generation is commissioned, we are keeping a keen eye on the changing predictability of wind power generation potential.
PS1 evening volatility
Note that the low wind harvest became a NEM-wide pattern, and this combined with ‘after dark’ rise in Scheduled Demand to deliver mainland volatility across all 4 x Regions.
What happened to all the big batteries? Down to 100KW by 14:00