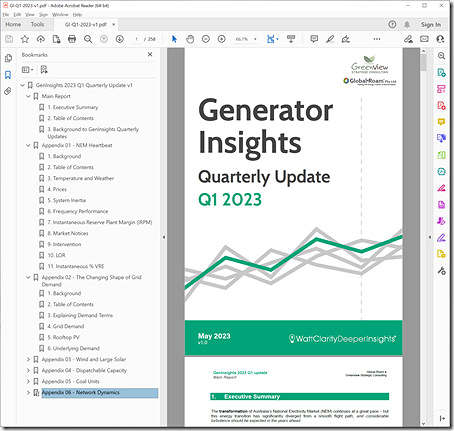
On Wednesday 31st May 2023 we* released GenInsights Quarterly Update for Q1 2023:
* noting again that this was a collaborative effort between some of us at Global-Roam Pty Ltd (the producers of WattClarity) and the analytical team at Greenview Strategic Consulting.
This is now the fourth in the series of quarterly updates, and follows:
1) We first published the Q2 Update (132 pages);
2) Then the Q3 Update (204 pages), including an additional Appendix for ‘One Year on from 5MS‘
3) Then the Q4 update … which was released on 14th February 2023 (198 pages)
4) Which brings us to the current Q1 update (now up to 258 pages).
These quarterly updates seek to update and extend some of the analysis published in our widely-read GenInsights21 publication, which built on the popular GRC2018 (which, incidentally was released on this date 4 years ago today).
(A) What’s in GenInsights 2023 Q1?
Here’s a quick view of the content:
This report (supplied to subscribers as an integrated PDF) at the following address:
https://downloads.wattclarity.com.au/#/
The report contains:
(1) An Executive Summary including 6 Key Observations; and
(2) Six appendices which each explore different aspects of the energy transition through the detailed analysis of historical data.
These 7 components are explained more below:
| . | About this Component |
| Executive Summary
18 pages |
The Executive Summary includes 6 x Key Observations that have been gleaned from what has been observed through the evolution of Q4 2022.
These Key Observations follow in the vein of: 1) the 22 x Key Observations included in GenInsights21, and 2) the 14 x Key Themes in the earlier GRC2018. |
| Appendix 1
34 pages |
NEM Heartbeat
In this appendix we take a look at a number of different ‘heartbeat’ metrics that help to identify the overall health of the NEM, including: 1) Weather factors (like temperature) 2) Prices 3) System inertia ——- With GVSC we’ve been analysing system inertia as far back as in the GRC2018, as highlighted with this article of August 2019. More recently the AEMO has been publishing its own derivation … which allowed us (beginning with the Q4 2022 Update) to begin highlighting how the two different measures compare: (a) Our bottom-up estimate, showing contribution from different types of plant (b) The AEMO’s published regional aggregate. ——- 4) Frequency Performance, which is topical given exploration by others, such as Allan O’Neil in February 2023. 5) Instantaneous Reserve Plant Margin (IRPM) … following from its inclusion in the Q3 update: ——- With respect to the Q3 update, one small snippet of the content of that Update was shared with WattClarity readers on 6th November 2022 in the article ‘Long-range trend of Instantaneous Reserve Plant Margin (IRPM) and focus on Q3 2022 – from GenInsights Quarterly’. As discussed in Appendix 1 for the Q4 Update, what a different quarter this one was! ——- … + others. |
| Appendix 2
24 pages |
The changing shape of Grid Demand
In this appendix we take a look at the changing nature of Grid Demand, which necessitates looking into: 1) Different shapes of demand: (a) Starting with ‘Grid Demand’ (b) But then also analysing Rooftop PV shapes to also assess ‘Underlying Demand’. 2) Beginning with the Q4 Update, we’ve also added in some analysis of the forecastability of ‘Operational Demand’ … this uses a method of ‘Forecast Convergence’ we introduced in GenInsights21 to assess the changing challenges of forecasting what ‘Operational Demand’ will be 24 hours from the point of dispatch.
|
| Appendix 3
70 pages |
Wind and Large Solar
In this appendix we take a look at different aspects of the performance of Wind and Large Solar assets (separately and together), including: 1) Production 2) Commercial Performance 3) Curtailment 4) Self-Forecasting … and in particular for Q1 what changes in usage patterns can we see for those Solar Farms and Wind Farms who have deployed self-forecasting – given: (a) AEMO upgraded its AWEFS and ASEFS forecasting systems on 23rd November 2022; and (b) The 3-month long ‘Grace Period’ ended on 23rd February 2023 5) ‘Forecast Convergence‘ for aggregate VRE Capability (a) how accurate are the AEMO’s forecasts of Wind + Large Solar capability across the NEM, 24 hours from the point of dispatch? (b) given the growing installed capacity, with more Wind and Solar Farms being developed, to what extent is this challenge growing? 6) Aggregate Raw Off-Target (a) in these Quarterly Updates, we continue to watch what’s happening in terms of collective deviation from Target across all the Wind and Solar Farms – updating and extending the analysis covered in WattClarity articles to 2020. (b) Following the Q4 Update, we shared ‘some revelations in GenInsights Q4 2022 about Aggregate Raw Off-Target for Semi-Scheduled Units’ (c) In subsequent Updates we continue to explore… + more to come. |
| Appendix 4
31 pages |
Dispatchable Capacity
In this appendix we take a look at different aspects of the performance of (fully) Scheduled assets (at various levels of bundling), including: 1) Performance specifically through Q4 2) Aggregate Scheduled Target (AggSchedTarget): (a) In absolute terms ——- With respect to the Q1 update, there are three snippets to be shared here on WattClarity: i. On 14th May 2023 we shared how ‘we’re not building enough replacement dispatchable capacity’ ii. Also today (Wed 31st May 2023), we shared ‘Digging further into ‘Aggregate Scheduled Target’, to understand what Dispatchable Capacity is actually required’ iii. A little later on, we’ll delve further into ‘Details to come’. ——- (b) Ramping from one Dispatch Interval to the next 3) ‘Forecast Convergence‘ for AggSchedTarget |
| Appendix 5
34 pages |
Coal Units
The 47 x coal units still operational in the NEM in Q1 2023 (albeit with 3 units at Liddell closing soon) are a special subset of dispatchable plant that have been addressed in more detail in this particular Appendix – because: 1) They still provide a large share of the Energy consumed in the NEM (and also the ‘Keeping the Lights on Services’); 2) But suffer from the big drawback of high emissions intensity. What this contains includes: 1) Performance specifically through Q4 2) Coal unit ‘dependability’ In the 180-page analytical component of the GRC2018 we included an extensive focus on the changing nature of different aspects of coal unit ‘dependability’. This was extended and updated in GenInsights21. Now, in each quarter, we’re extending and updating further, with the inclusion of analysis of: (a) Changing levels of Unavailability (b) Three different metrics that help to indicate the changing rate of ‘Sudden Failure’: … number of Starts, number of ‘Sudden Trip’, and Aggregate Raw Off-Target. (c) New in these Quarterly Updates, we’re now also separating out all hours in the quarter for each of the remaining coal units into three categories (Operational, Planned Outage and Forced Outage), which makes it clearer which units appear to be struggling and which units don’t appear to be struggling. 3) We also look at ‘Forecast Convergence‘ for Aggregate Coal Unit Availability across the 47 units operational in this quarter. 4) Each quarter we take an updated look at the Closure Schedule. |
| Appendix 6
46 pages (a major increase in analytical content) |
Network Dynamics
In this Appendix, we look at: 1) Regional Energy Balances 2) Regional Transfer Duration Curves 3) Specific interconnector operations (including, new to the Q1 update, the impact of various types of constraint) 4) Renewable energy congestion 5) Changing Marginal Loss Factors (MLFs) … and in future Editions will add in other aspects.
|
Hopefully this has provided some sense of what’s included in this Quarterly Update for Q1 2023.
(B) How to order?
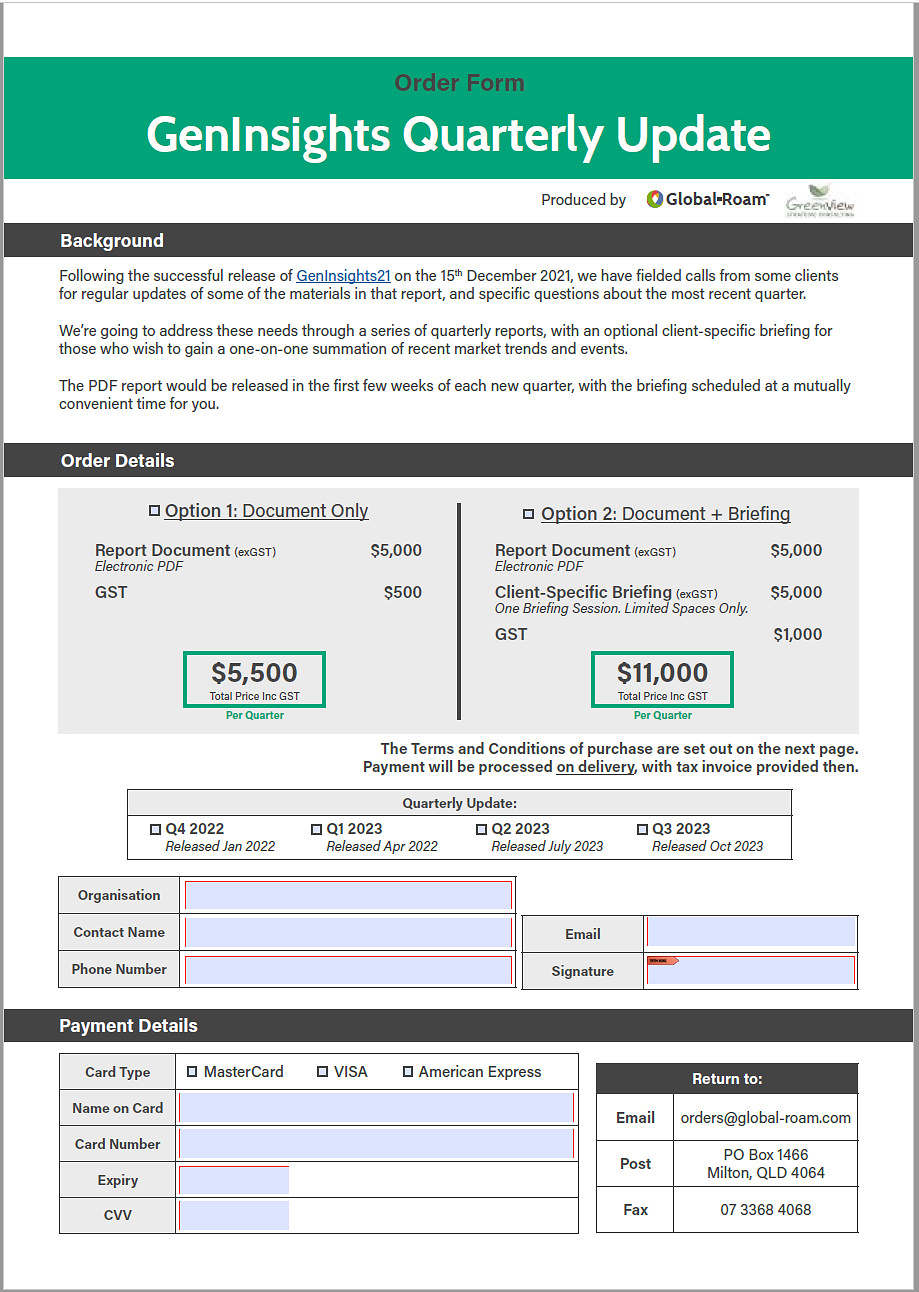
Please contact us if you have more questions on the above, and please complete this order form and return to us to secure your order, remembering to flag which option you prefer:
Option 1 = Document only (as integrated PDF); or
Option 2 = both:
(a) Document (as integrated PDF) +
(b) Executive Briefing (noting that this is subject to availability).
We look forward to receiving your order.


Leave a comment