
Already this week, Paul McArdle posted three articles pertaining to AEMO’s forecasts for the coming Friday 3rd February 2023:
1) On Monday morning 30th January, Paul noted that we ‘might see more price volatility this week … at least in QLD?’.
2) By Tuesday morning, the first forecast of an LOR2 Low Reserve Condition gained a mention, along with forecast for possible ‘… new record demand) for QLD region on Friday 3rd February’.
3) By Tuesday evening (yesterday), the tone became more concerned (and the article and title was updated several times, including about possible Reserve Trader deployment) with ‘Tuesday afternoon look at the (escalating) forecast for Friday 3rd February 2022 … but later the forecast LOR2 was cancelled, and then reinstated’.
… so it’s fair to say that this coming Friday afternoon is shaping up to be an interesting one for Queensland.
As at 09:00 this morning (NEM Time), the AEMO were forecasting total demand in the region to be 10,496MW at 5:30PM Friday – a mark that would smash the current record in the region by a few hundred megawatts. Equally interestingly, the forecast for the same date and time was 2,500MW less just a few days ago, as illustrated here:
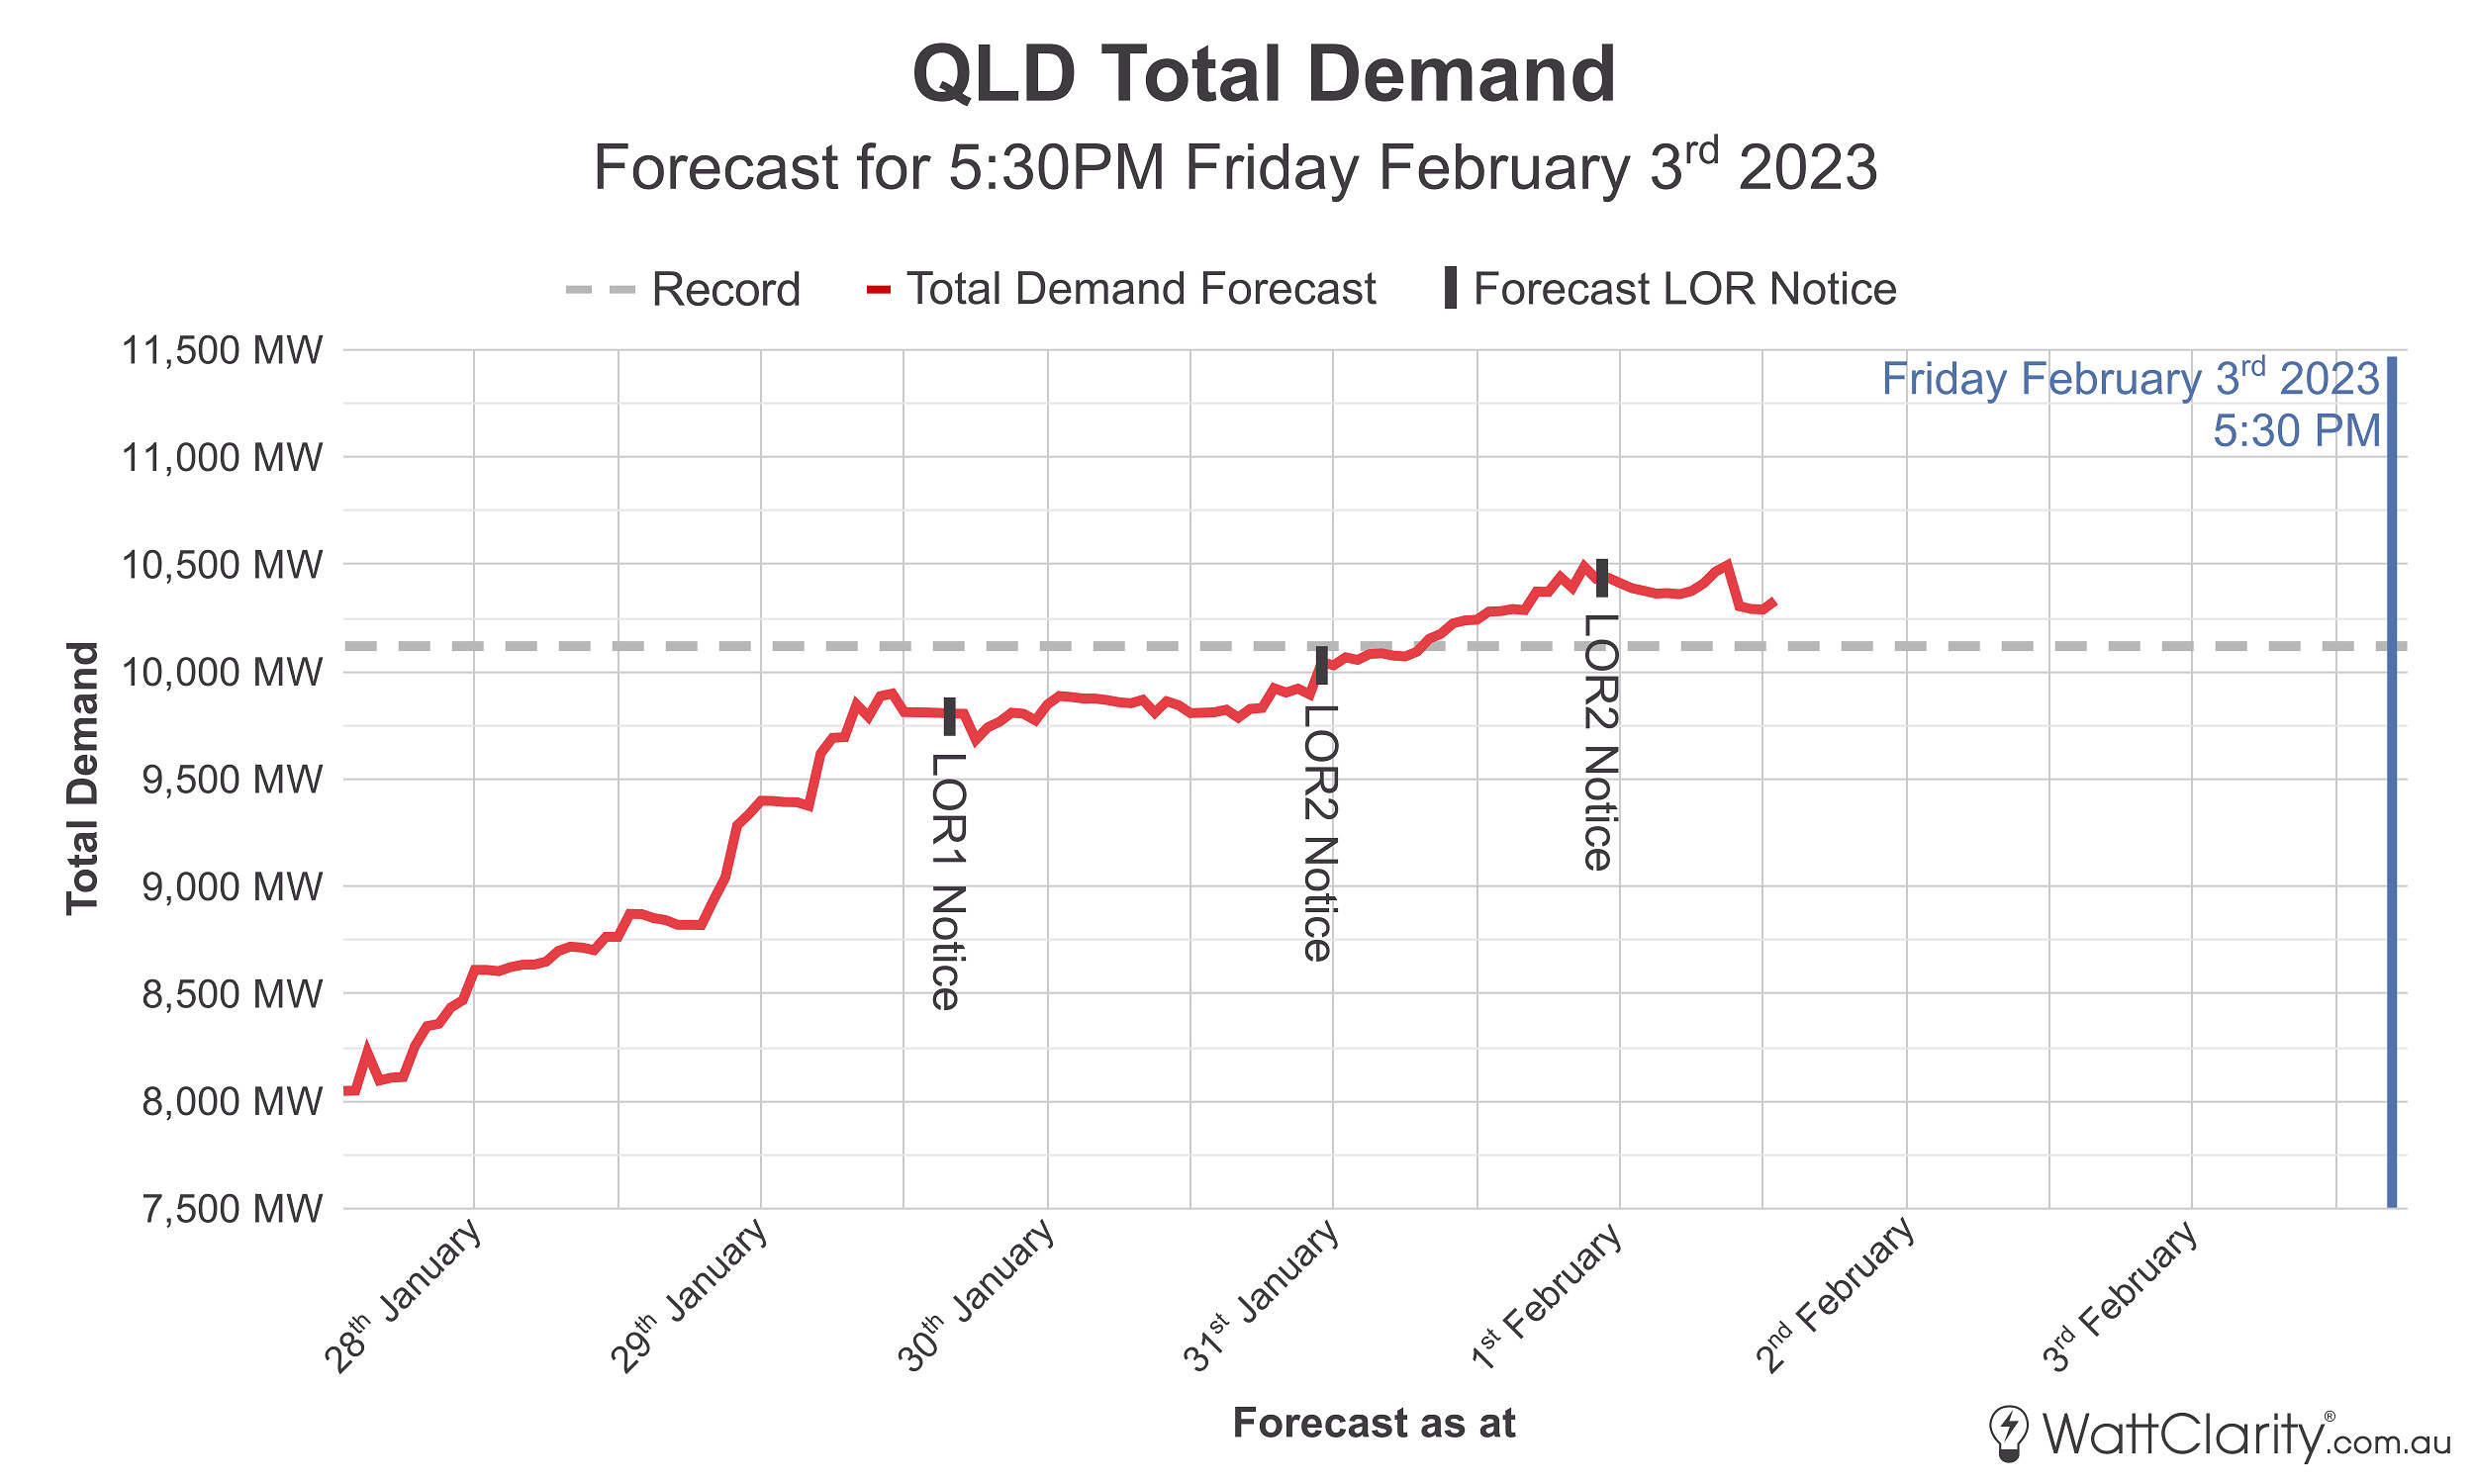
I’ve made the chart above to show how the total demand forecast for 5:30PM Friday has been evolving over the past several days. The chart uses the AEMO’s Demand50 data series, and is another way of ‘looking up a vertical’ to view that other dimension of time – which we commonly show in our ‘Forecast Convergence’ widget in our ez2view software.
To provide some background about what that means – as part of their Short-Term Projection of System Adequacy (STPASA) process, every hour the AEMO publishes three forecasts for total demand looking six trading days into the future:
- Demand10 – The forecast with a 10% probability of execution – i.e. a high demand forecast
- Demand50 – The forecast with a 50% probability of execution – i.e. an average demand forecast
- Demand90 – The forecast with a 90% probability of execution – i.e. a low demand forecast
My chart shows only the average demand forecast and like most weather-dependent forecasts, accuracy increases as we move closer to the date in question.
Weatherzone is currently forecasting a temperature of 30.6° and humidity of 59% in Brisbane at 5pm on Friday. It would seem cloud cover may also impact both electricity supply (limiting large Solar Farm output) and demand (limiting rooftop solar output, which might boost Grid Demand). As at 1pm this afternoon the STPASA forecast for aggregate QLD Wind and Solar farm output for 5:30pm Friday is only 563MW – less than half of what is currently forecast for the same time on Thursday afternoon.
Some things to watch for this Friday afternoon
- Temperature and humidity levels. Both of these obviously have a big bearing on underlying demand as Queenslanders will look to their air-conditioners and fans.
- Cloud cover – especially clouds passing over the west of SEQ. I believe it was Paul Simshauser who coined the term “the Russ Christ Effect” to explain the impact on rooftop solar when westerly clouds cover a city while the sun is setting to the west.
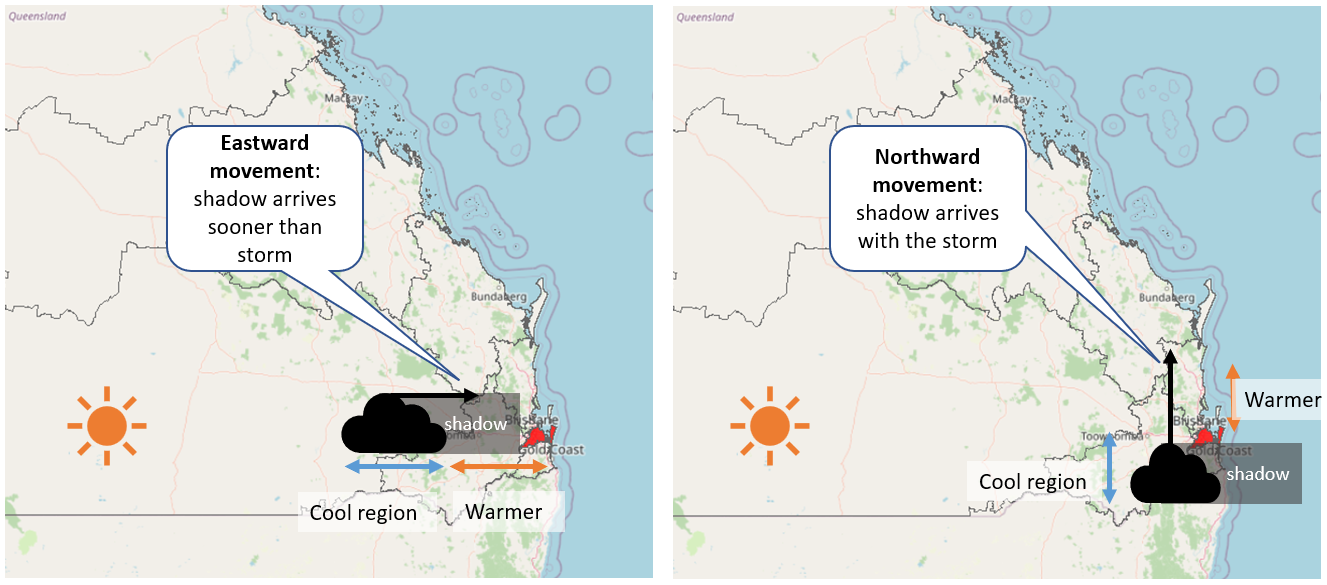
The ‘Russ Christ Effect’ – how westerly cloud shadows impact rooftop PV output.
The caveats
In the words of Danish physicist Neils Bohr, “Prediction is very difficult, especially about the future”.
- High sensitivity of forecasts to temperature/humidity changes. We understand that there’s considerable uncertainty about what will ensue, in terms of humidity levels for Friday afternoon – a couple of extra degrees of dew point can equate to hundreds of extra megawatts of demand.
- Changing weather patterns have an effect on forecast modeling systems. As we slowly move towards El Nino (or at least away from a strong La Nina), we must think about the limitations of forecast modeling as more recent years’ data was based on strong La Nina weather. Perhaps the last time summer conditions were similar to this week in Queensland was in 2019? If that’s the case, we need to think about how many air conditioners have been installed in South-East QLD since then that the AEMO has not experienced in the (La Nina dominated) summers of 2020-21 and 2021-22?
Watch this space.
Leave a comment