
Tuesday the first of February and Wednesday the second of February, 2022, saw high Queensland electricity demand put pressure on electricity supply. On both days temperatures soared with uncomfortable humidity levels pushing apparent temperatures towards 40 degrees Celsius.
This article follows on from Part A which inspected how Queensland rooftop PV output varied on the 1st and 2nd of February 2022 at the state level.
In this article we look closer into where and when the changes in rooftop PV occurred, narrowing our assessment to south-east Queensland regions.
Background from Part A
In Part A we noted how rooftop PV output varied in association with demand and temperature.
On Tuesday 1st February, variations included:
- Afternoon storms bringing a 10-degree temperature drop in the space of 40 minutes to help subdue the high demand levels.
- A halt to declining afternoon rooftop PV output between 14:30 and 16:00, suggesting the sky was clearing in some parts of the state and this was mitigating the effect of the setting sun.
On Wednesday 2nd February, variations included:
- A demand rise of 660 MW in the space of 25 minutes.
- A coincident rooftop PV decrease of approximately 700 MW.
- A temperature decrease that lagged the change in rooftop PV and demand by an estimated 30 minutes; rooftop PV started decreasing around 14:10, temperatures at Archerfield started cooling from 14:50
Part B – Analysis at a 2-digit postcode level
In this article we look closer into where and when the changes in rooftop PV occurred.
To do this, we delve further into the detail, using the APVI’s estimates for rooftop PV production at a 2-digit postcode level. The following map shows the locations of the postcode regions in Queensland. The region we’ve described as North Brisbane is 40XX, coloured as the tiny green space in the map below.

Postcode regions
Clearly, the 40XX postcode region is the smallest one, geographically – but that’s not to dismiss its contribution to rooftop PV, which can be seen (below) is as great as 400MW through recent months.
On the 1st and 2nd February 2022, rooftop PV wasn’t impacted across the whole state
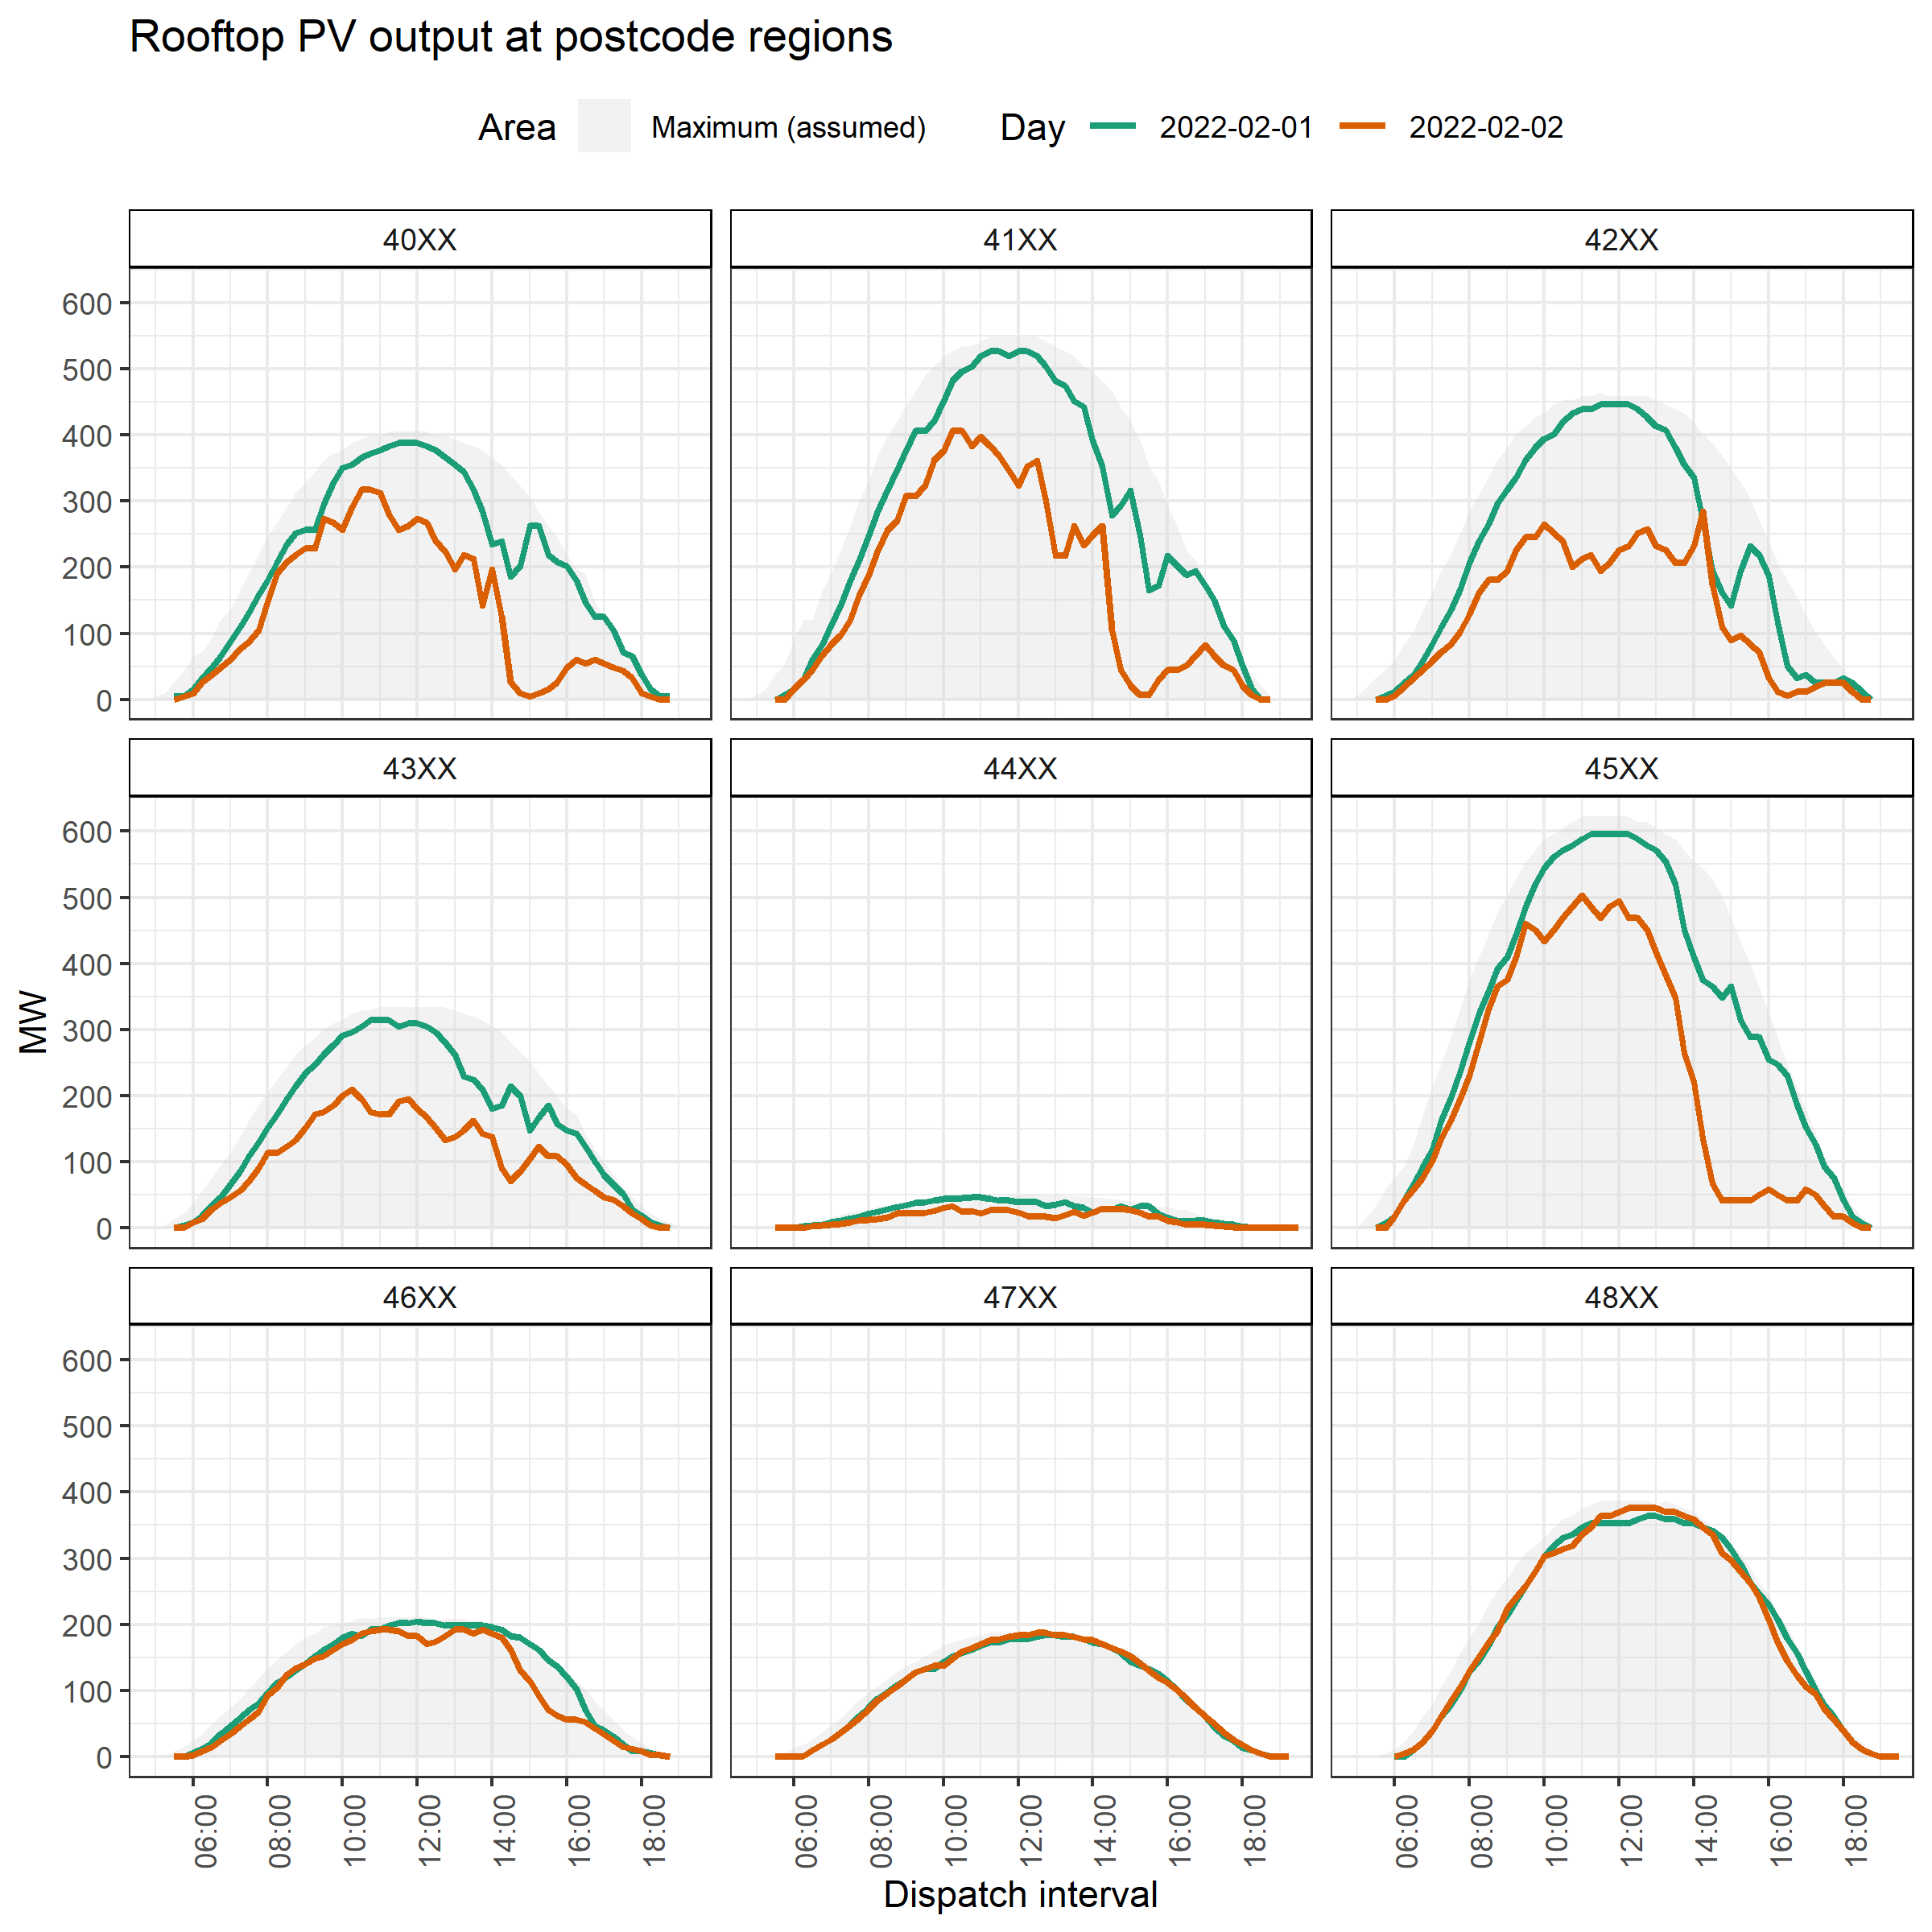
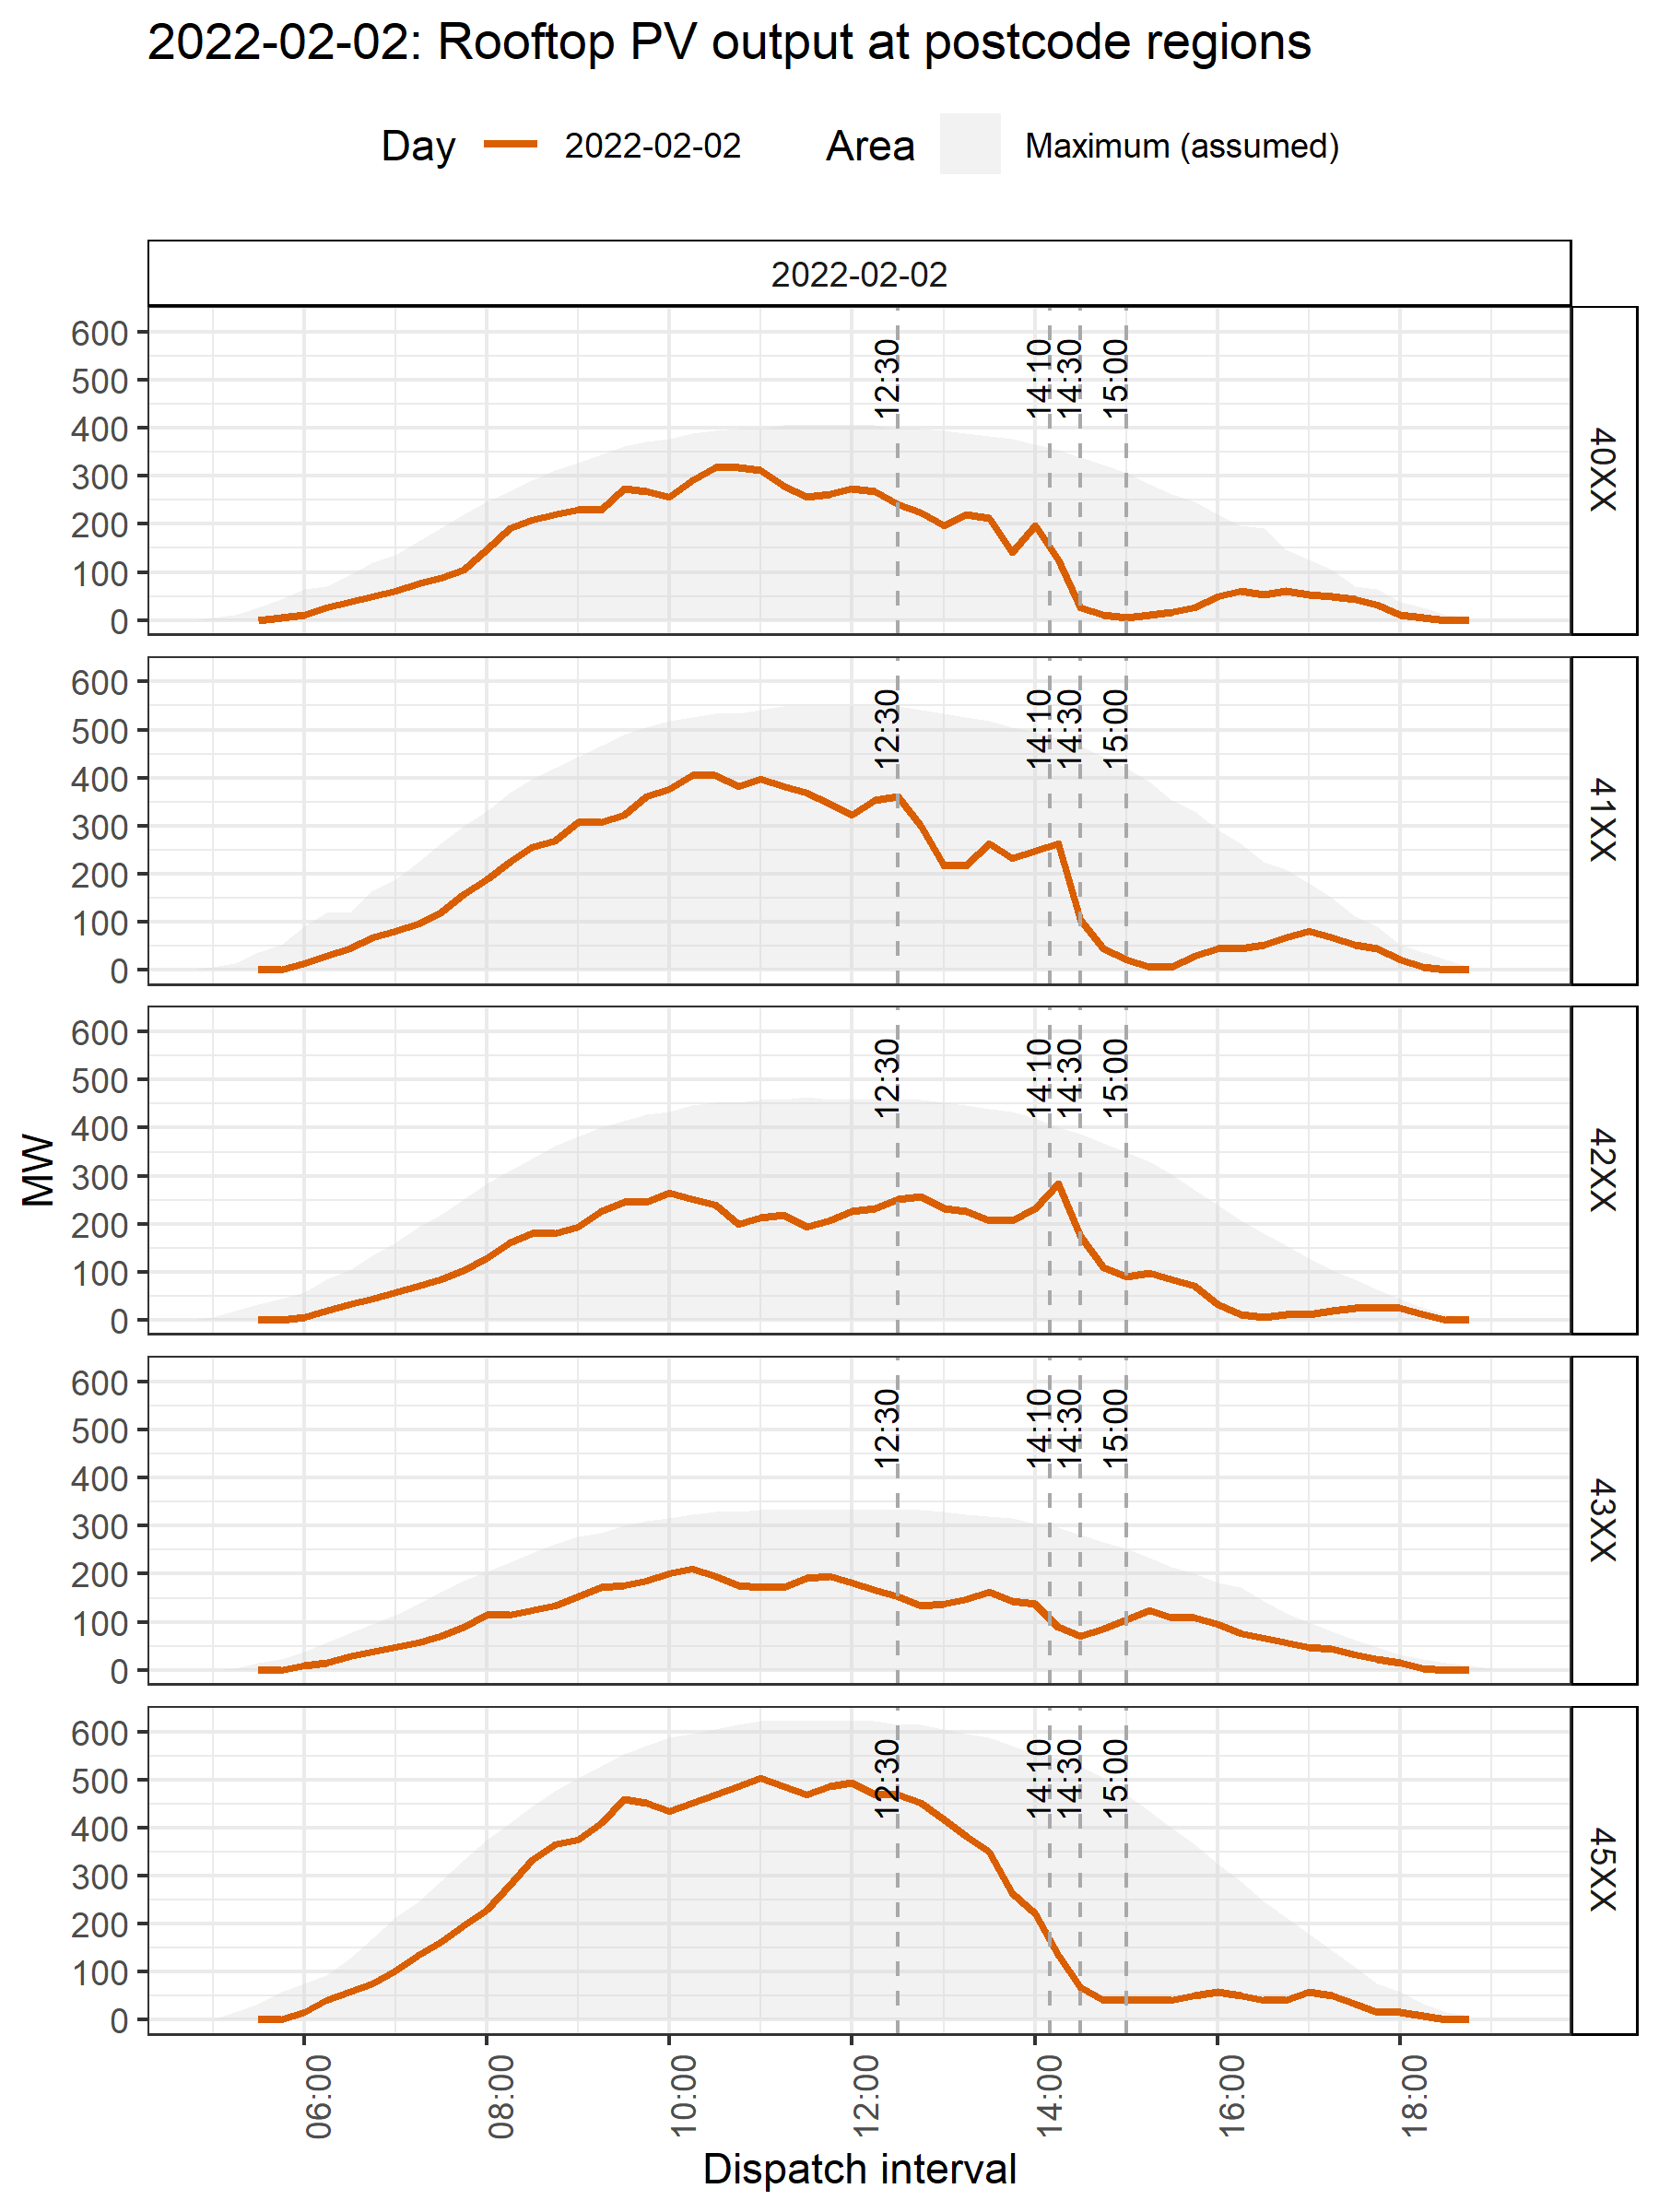
Inspecting APVI rooftop PV output estimates aggregated to our postcode regions, we can see that postcode regions 40XX, 41XX, 42XX, 43XX and 45XX were most impacted by cloudiness on the 1st and the 2nd of February (i.e. the ones in the south-east corner, from Gympie south to the border).
The grey shaded area in the chart below represents the assumed maximum output for early February 2022.
- It is derived from the highest output separately recorded for each discrete time point on any of the days over the prior 2 months (January 2022 and December 2021).
- Hence, it is a manufactured ‘real world maximum day’ for solar output in those regions.
Comparing the two days, Wednesday the 2nd resulted in lower output throughout. The difference was most evident from 10:00 onwards, in the regions that were impacted.
Zones 47XX, 48XX and also 44XX and 46XX were largely unaffected by the clouds. These zones span wider areas and cover inland and northern parts of Queensland. The exception was zone 46XX on Wednesday the 2nd where afternoon output dropped earlier than usual after 14:00.
The timing of rooftop PV reductions was different among postcode regions
Tuesday the 1st February 2022
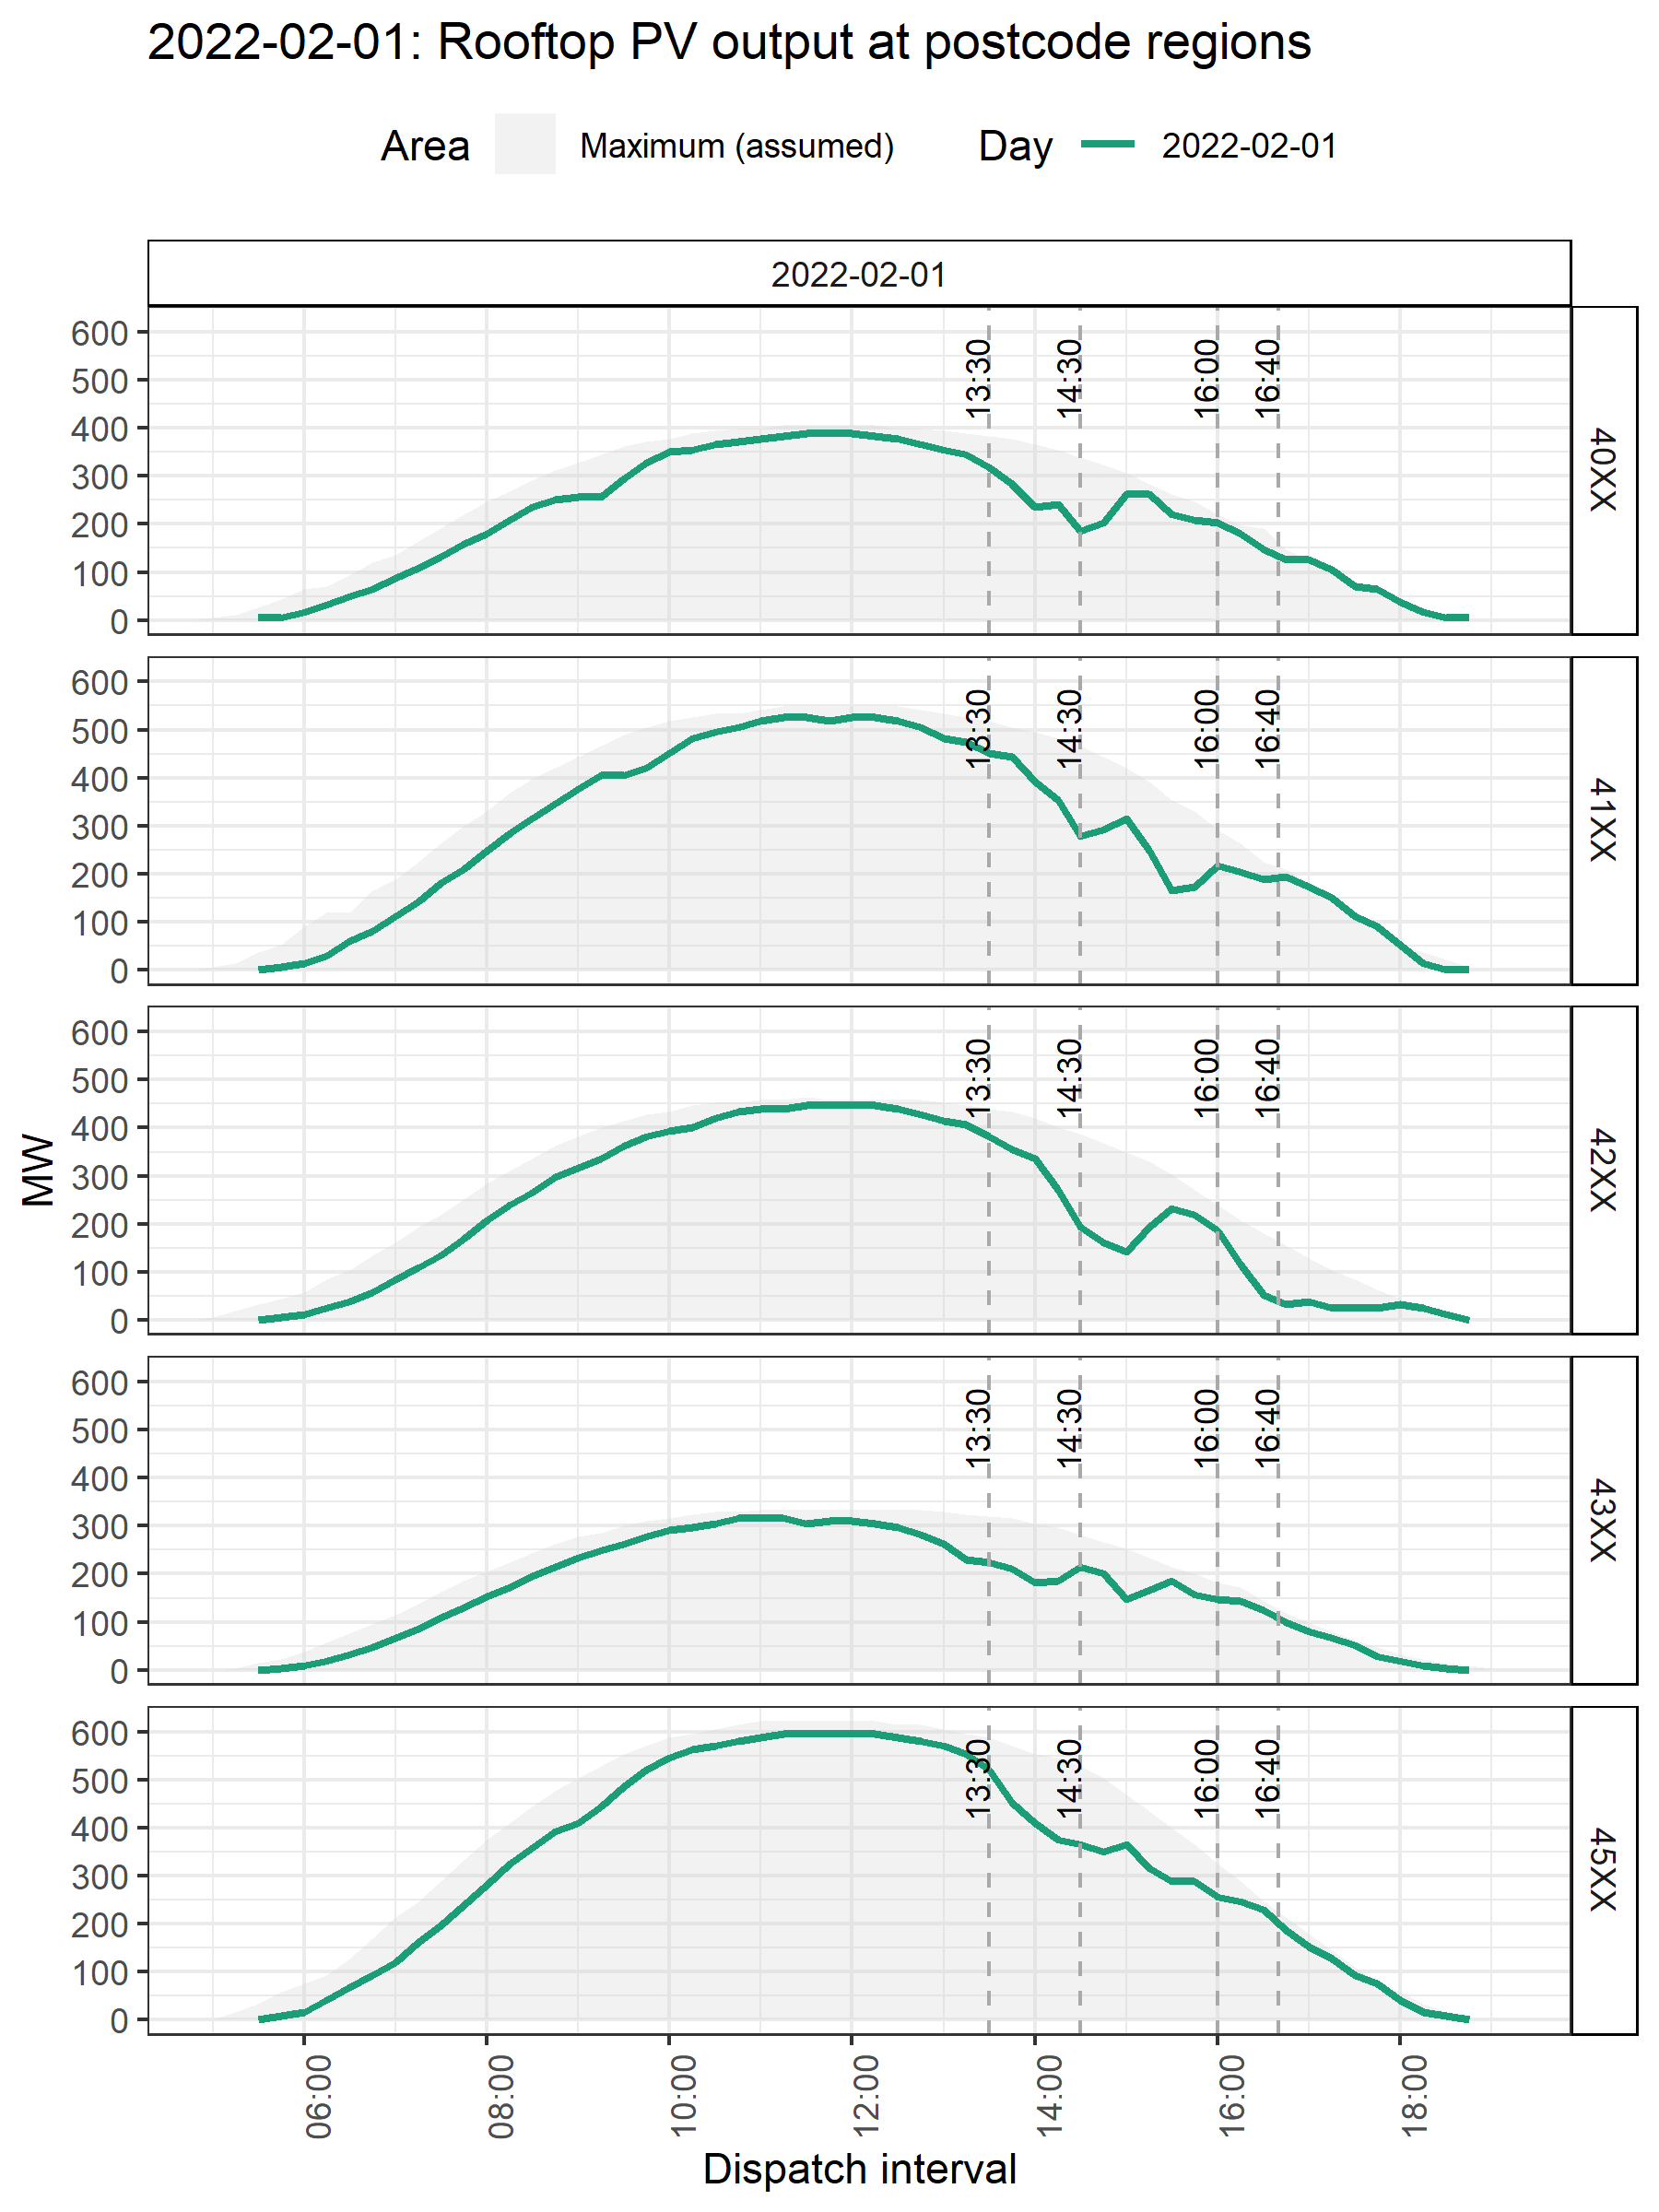
On Tuesday the 1st, region 45XX started its steepest decline earliest, from 13:30 to 14:30.
Regions 41XX and 42XX started a decline in output 20 to 30 minutes later than region 45XX.
The strongest reversal of cloudiness to clearer skies appeared in region 40XX and 42XX (and to a lesser extent 41XX), as indicated by the rise in output during the period 15:00 to 16:00.
The most considerable drop after 16:00 on Tuesday was in region 42XX (Logan City and surrounds) where output dropped almost to 0 MW by 16:40.
Rooftop PV output on the 1st
The following step-through charts show the clouds and rooftop PV output for the selected postcode regions.
Satellite images are from the Himawari-8 satellite (https://himawari8.nict.go.jp/).
Dots on the satellite images are locations (from north to south):
- Gympie, Caloundra, Caboolture in region 45XX;
- Brisbane Airport in 40XX;
- Archerfield in 41XX;
- Ipswich in 43XX;
- Logan City in 41XX;
- Gold Coast in 42XX.
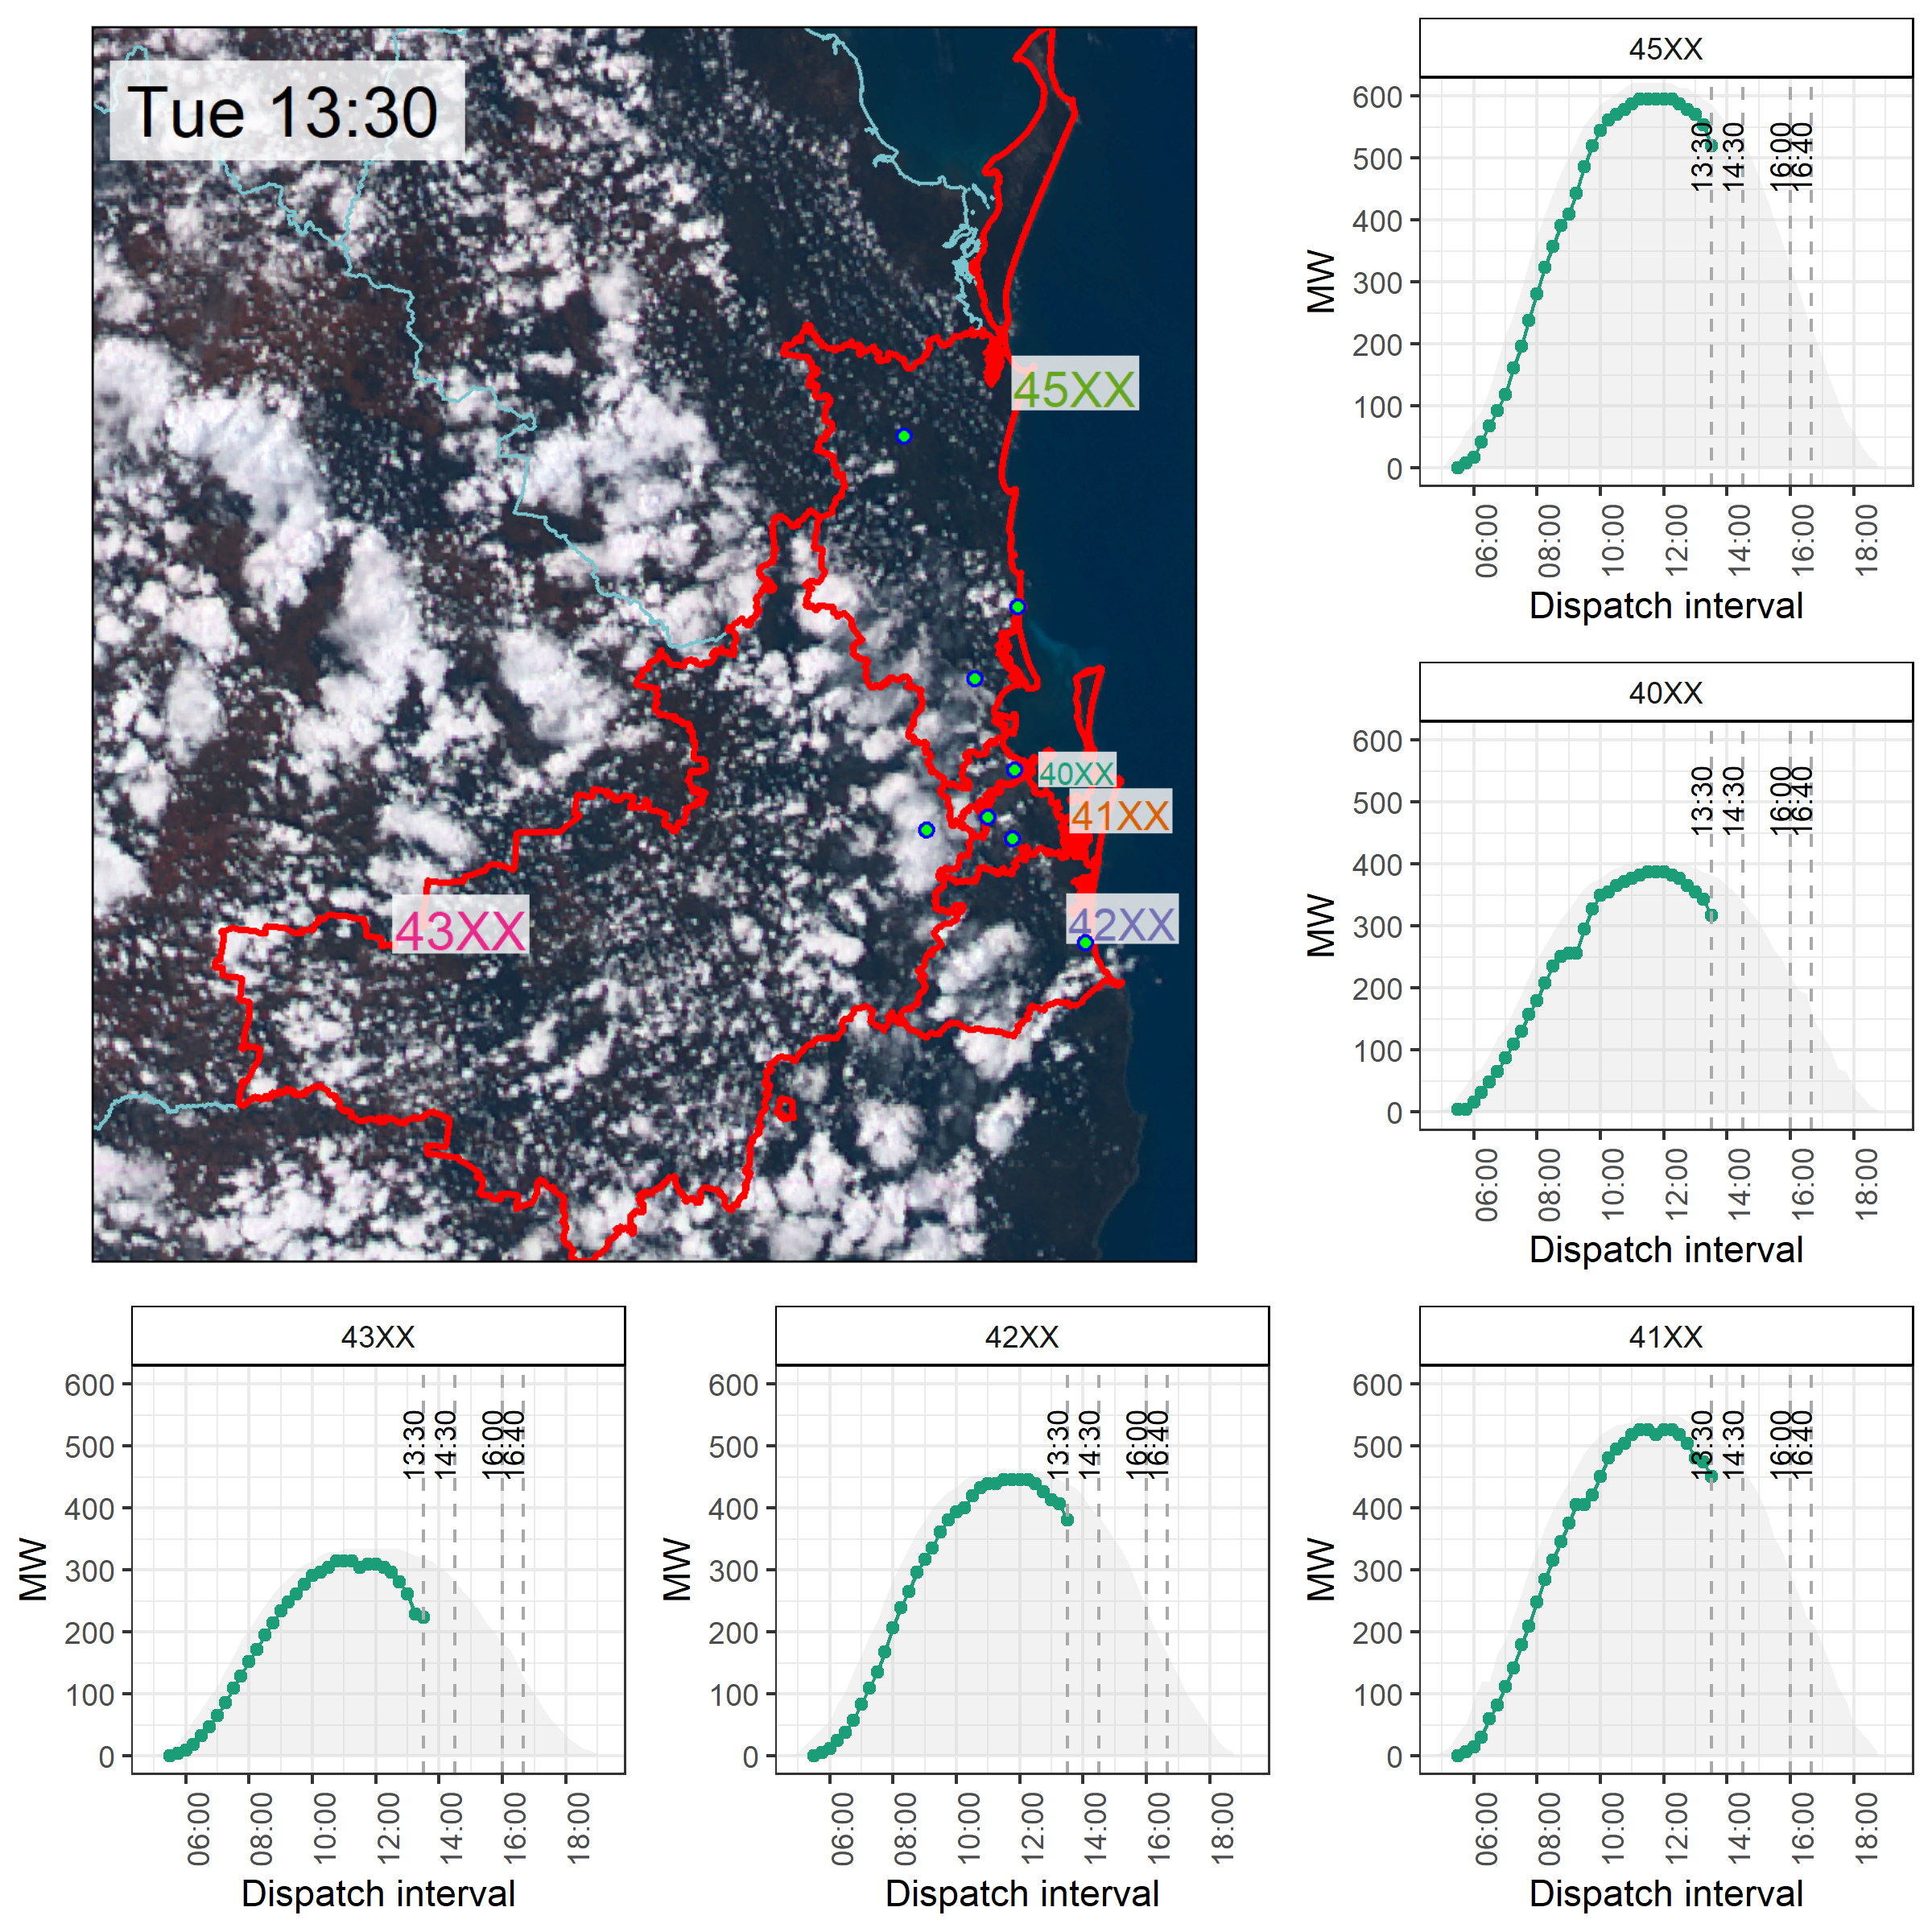
Tuesday 13:30 on 1st February 2022
Tuesday’s clouds were patchy early in the afternoon at 13:30 and would have often had localised impacts due to their sizes. PV output in most regions had started to drop away from our assumed maximum level (grey shaded area).
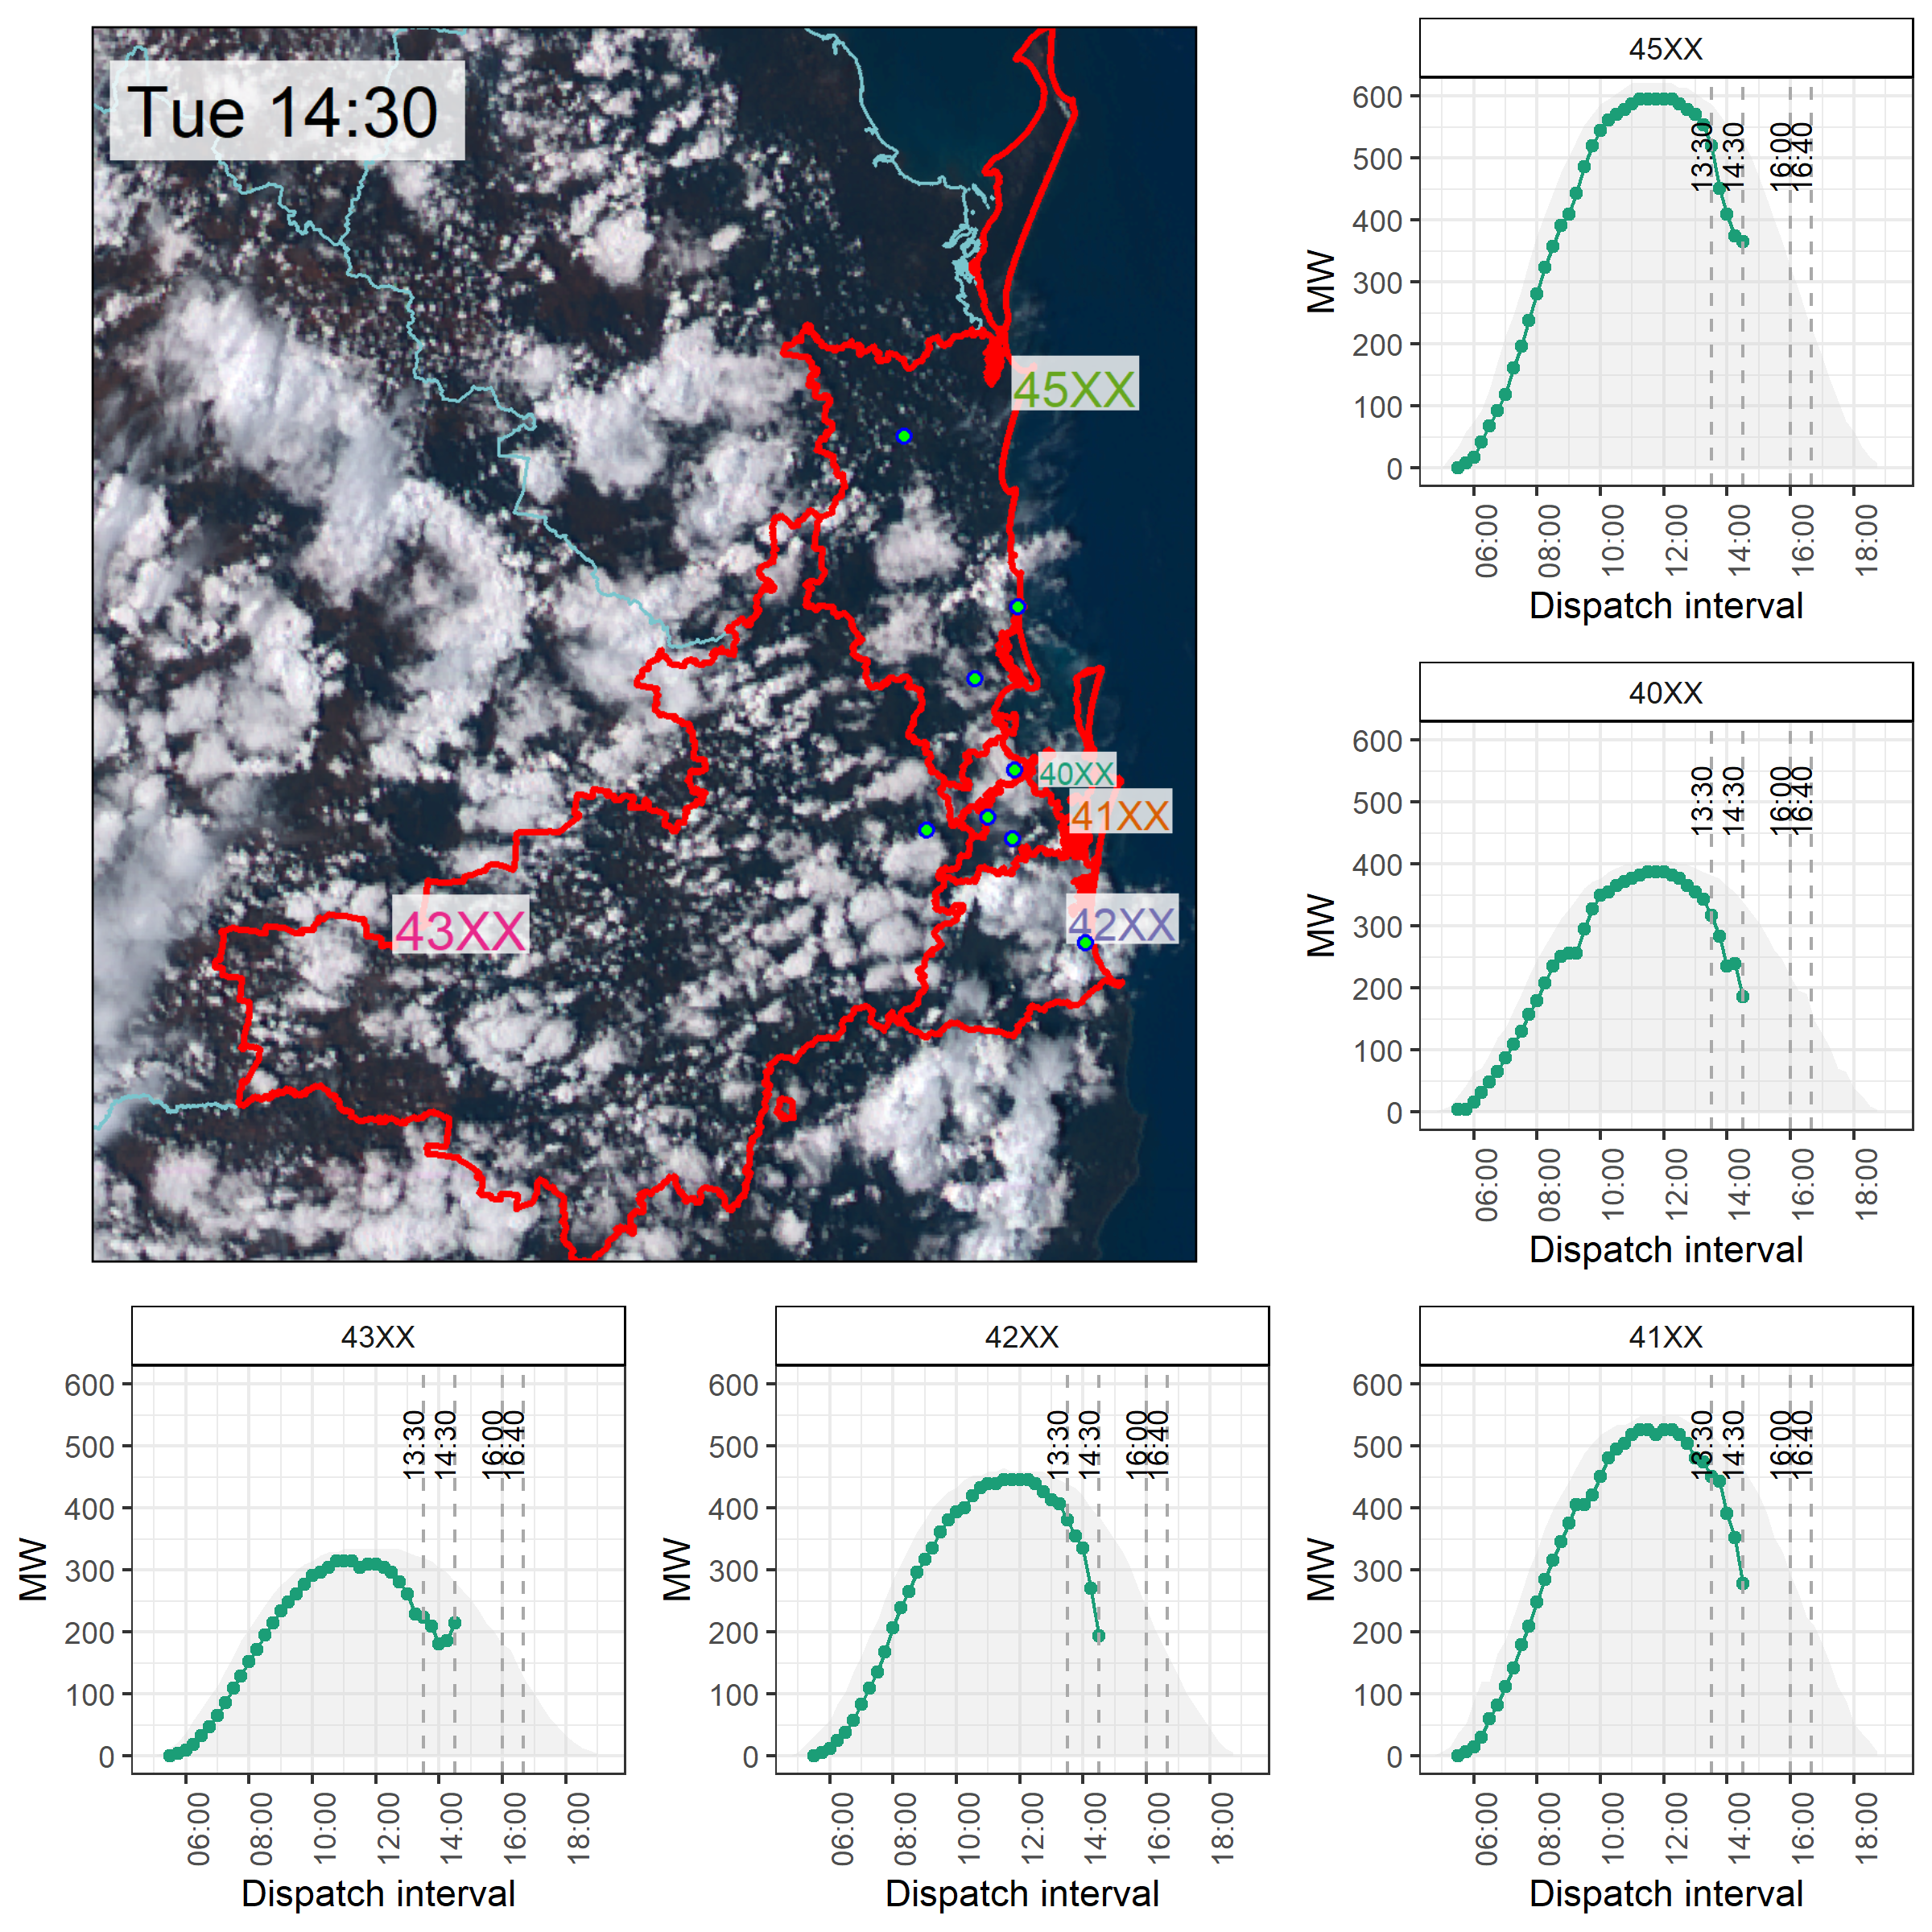
Tuesday 14:30 on 1st February 2022
By 14:30 clouds had developed over Brisbane, moving in from the south-west. By this author’s own assessment, the super-cell that was reported to have occurred around this time appears to have emerged just south of, and moving north into, region 41XX.
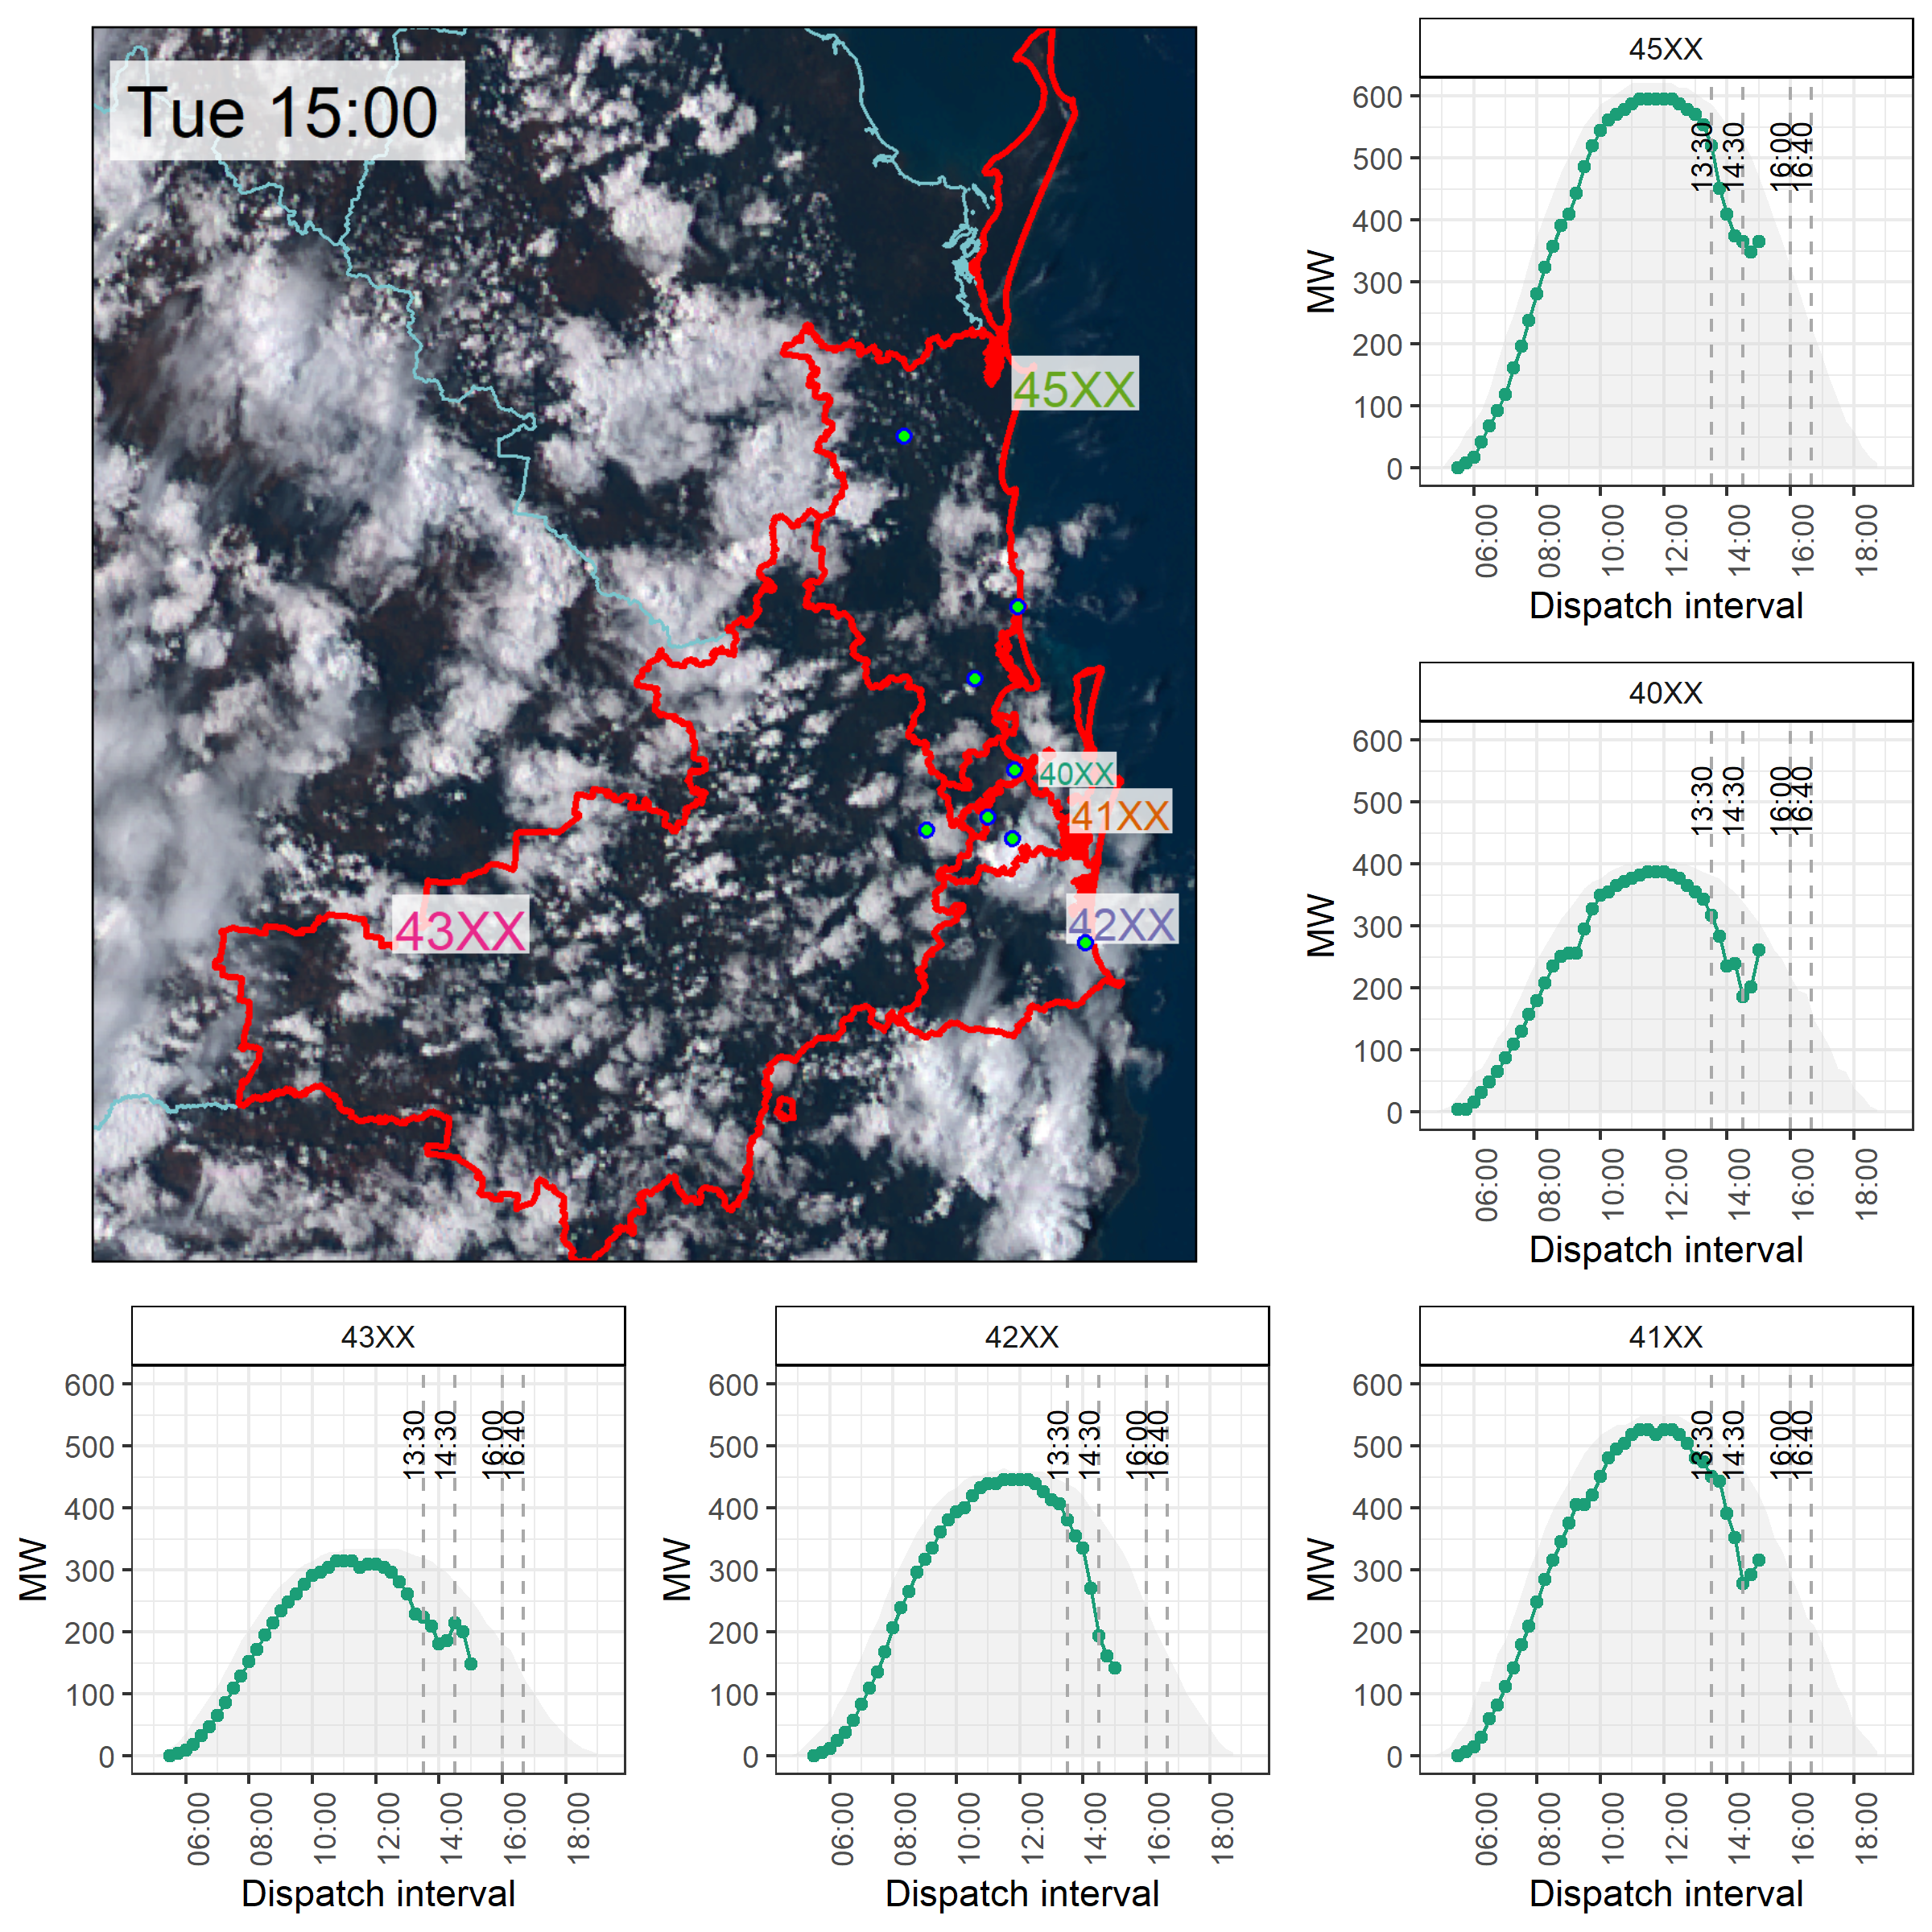
Tuesday 15:00 on 1st February 2022
The storm over region 41XX (Logan City) between 15:00 and 15:20 had started to progress northwards into the region, visible in the snapshot at 15:00.
Skies had cleared in north Brisbane (40XX) and, to a lesser extent, over populated parts of region 45XX to drive region-specific increases in rooftop PV output.
Although much of region 42XX was clear, clouds were covering the Gold Coast and populated areas in that region. This helped push the estimated PV output to below 50% of maximum for that time of day.
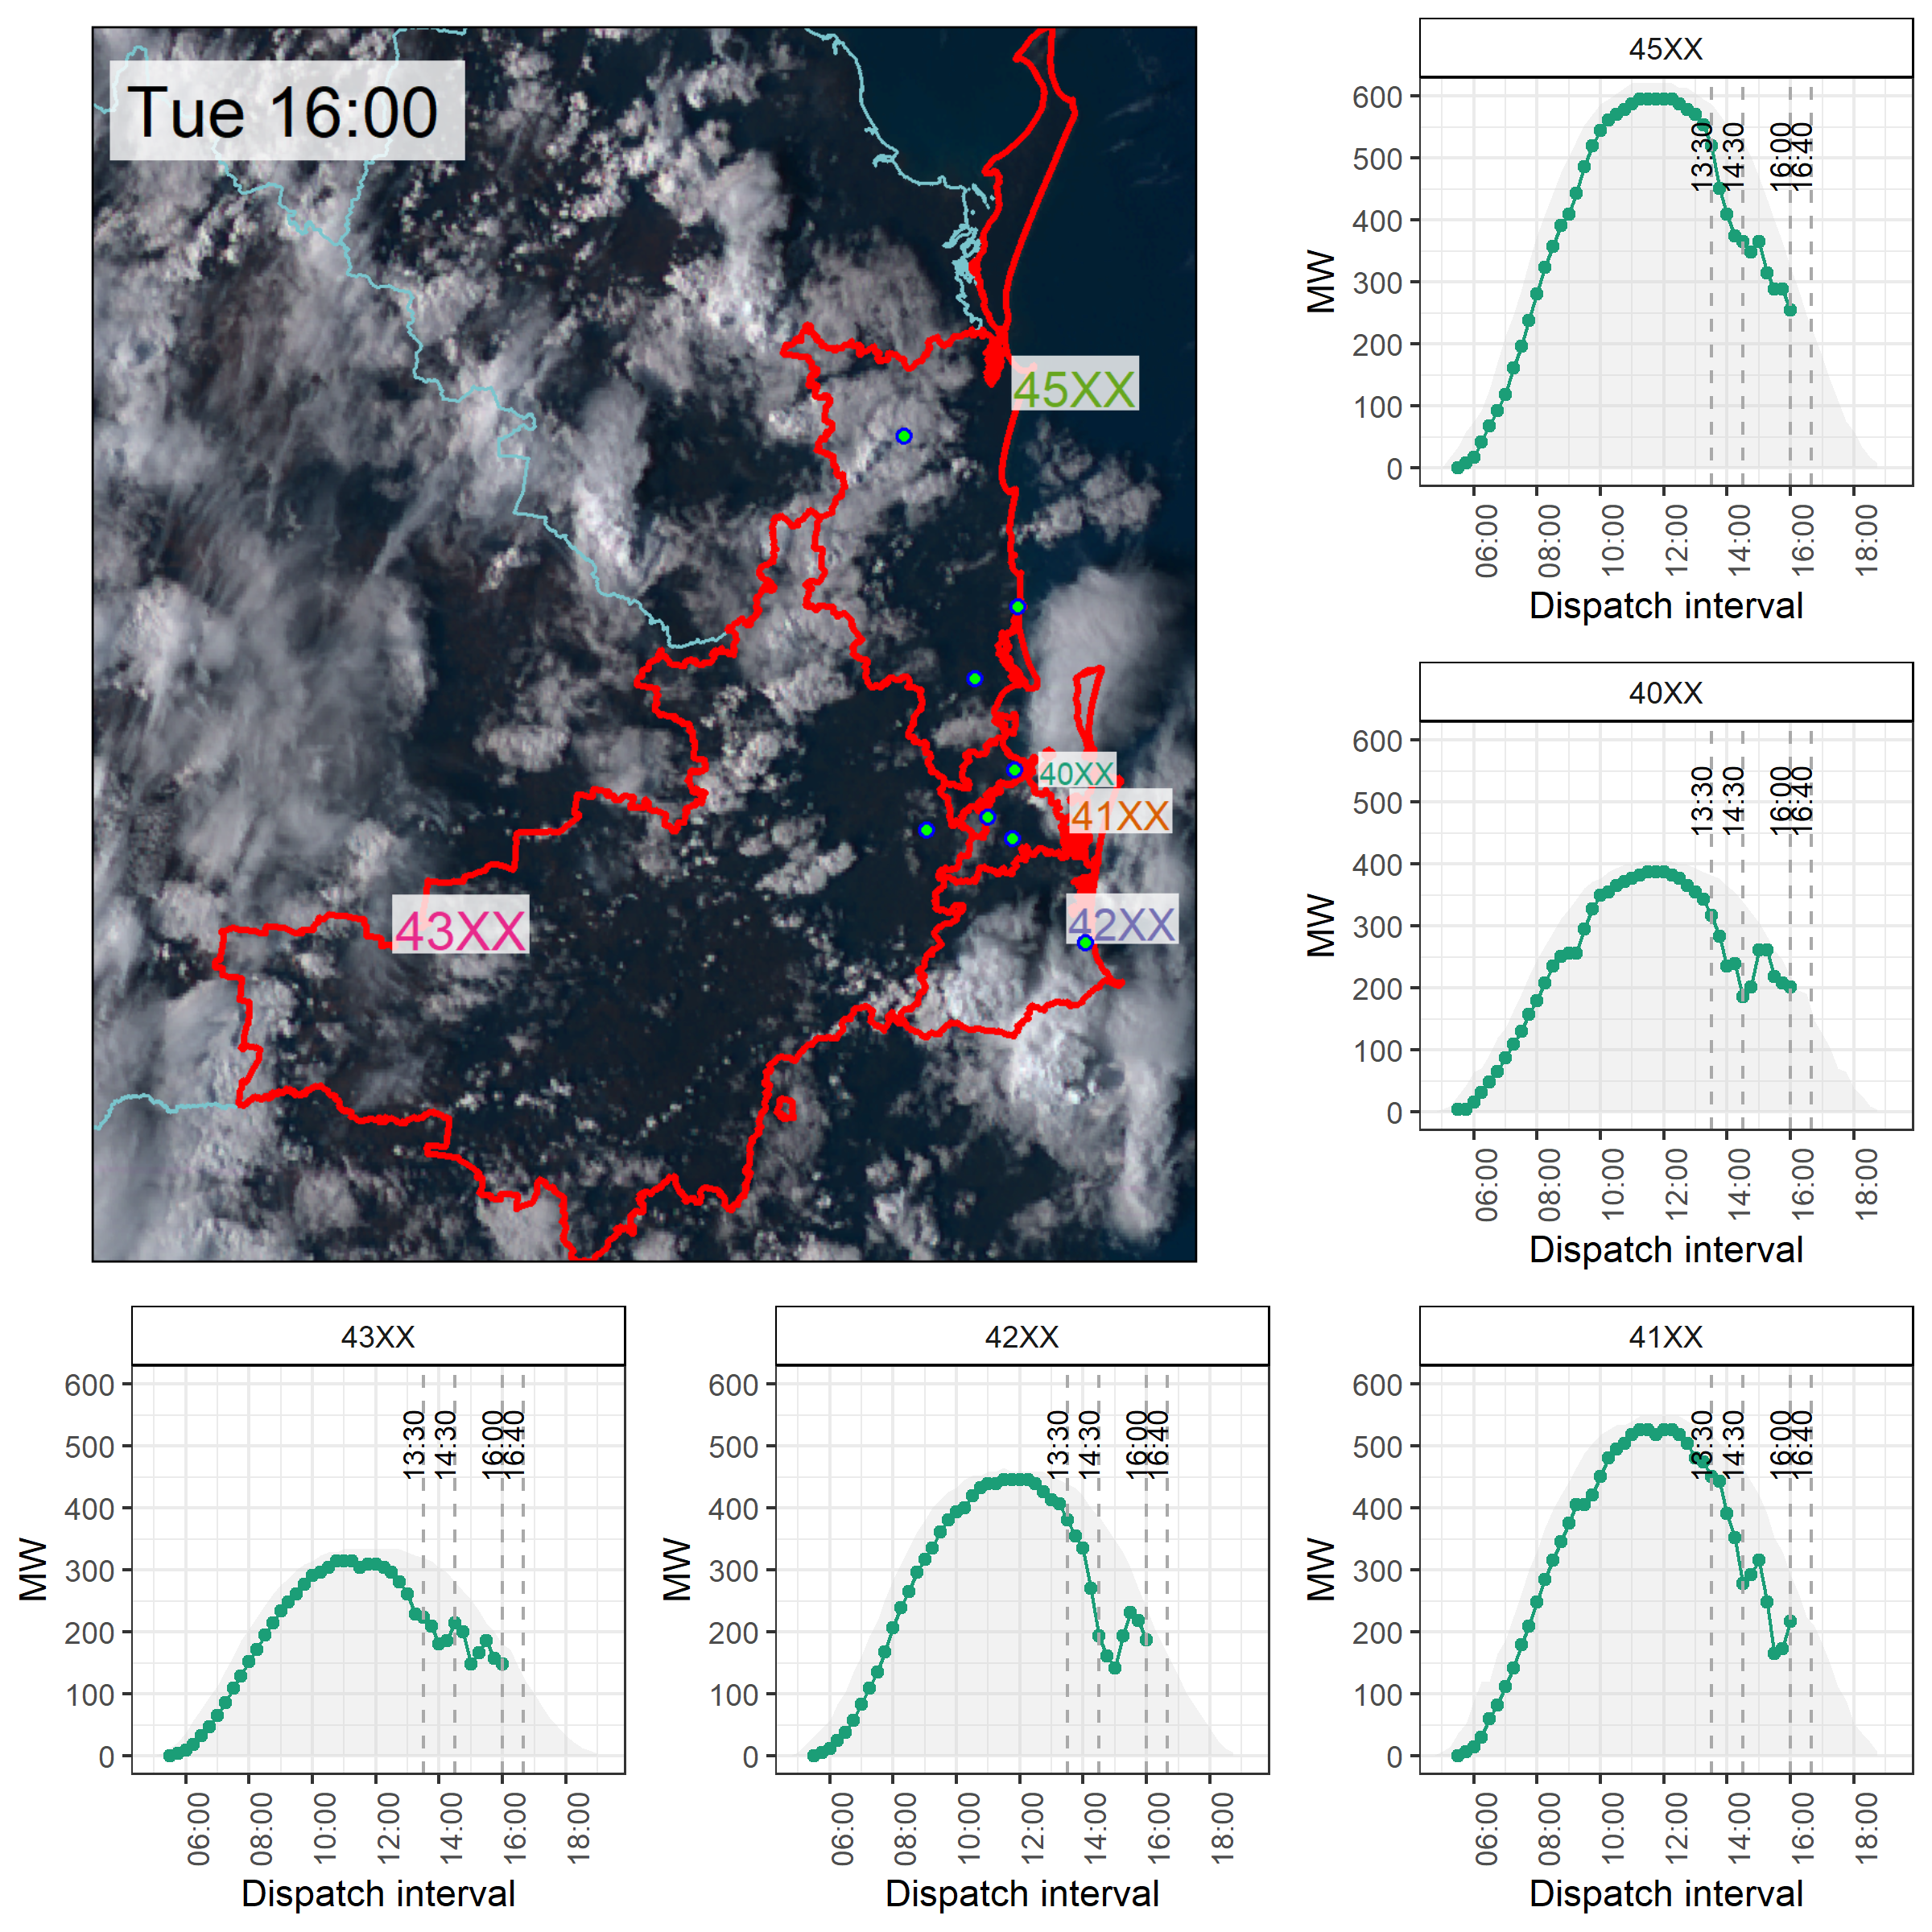
Tuesday 16:00 on 1st February 2022
Conditions had cleared in much of 45XX, 40XX and 41XX by 16:00. Further activity was developing inland from the Gold Coast (42XX), in the bottom right of the image.
Region 41XX experienced an increase in rooftop PV output due to the clearing skies.
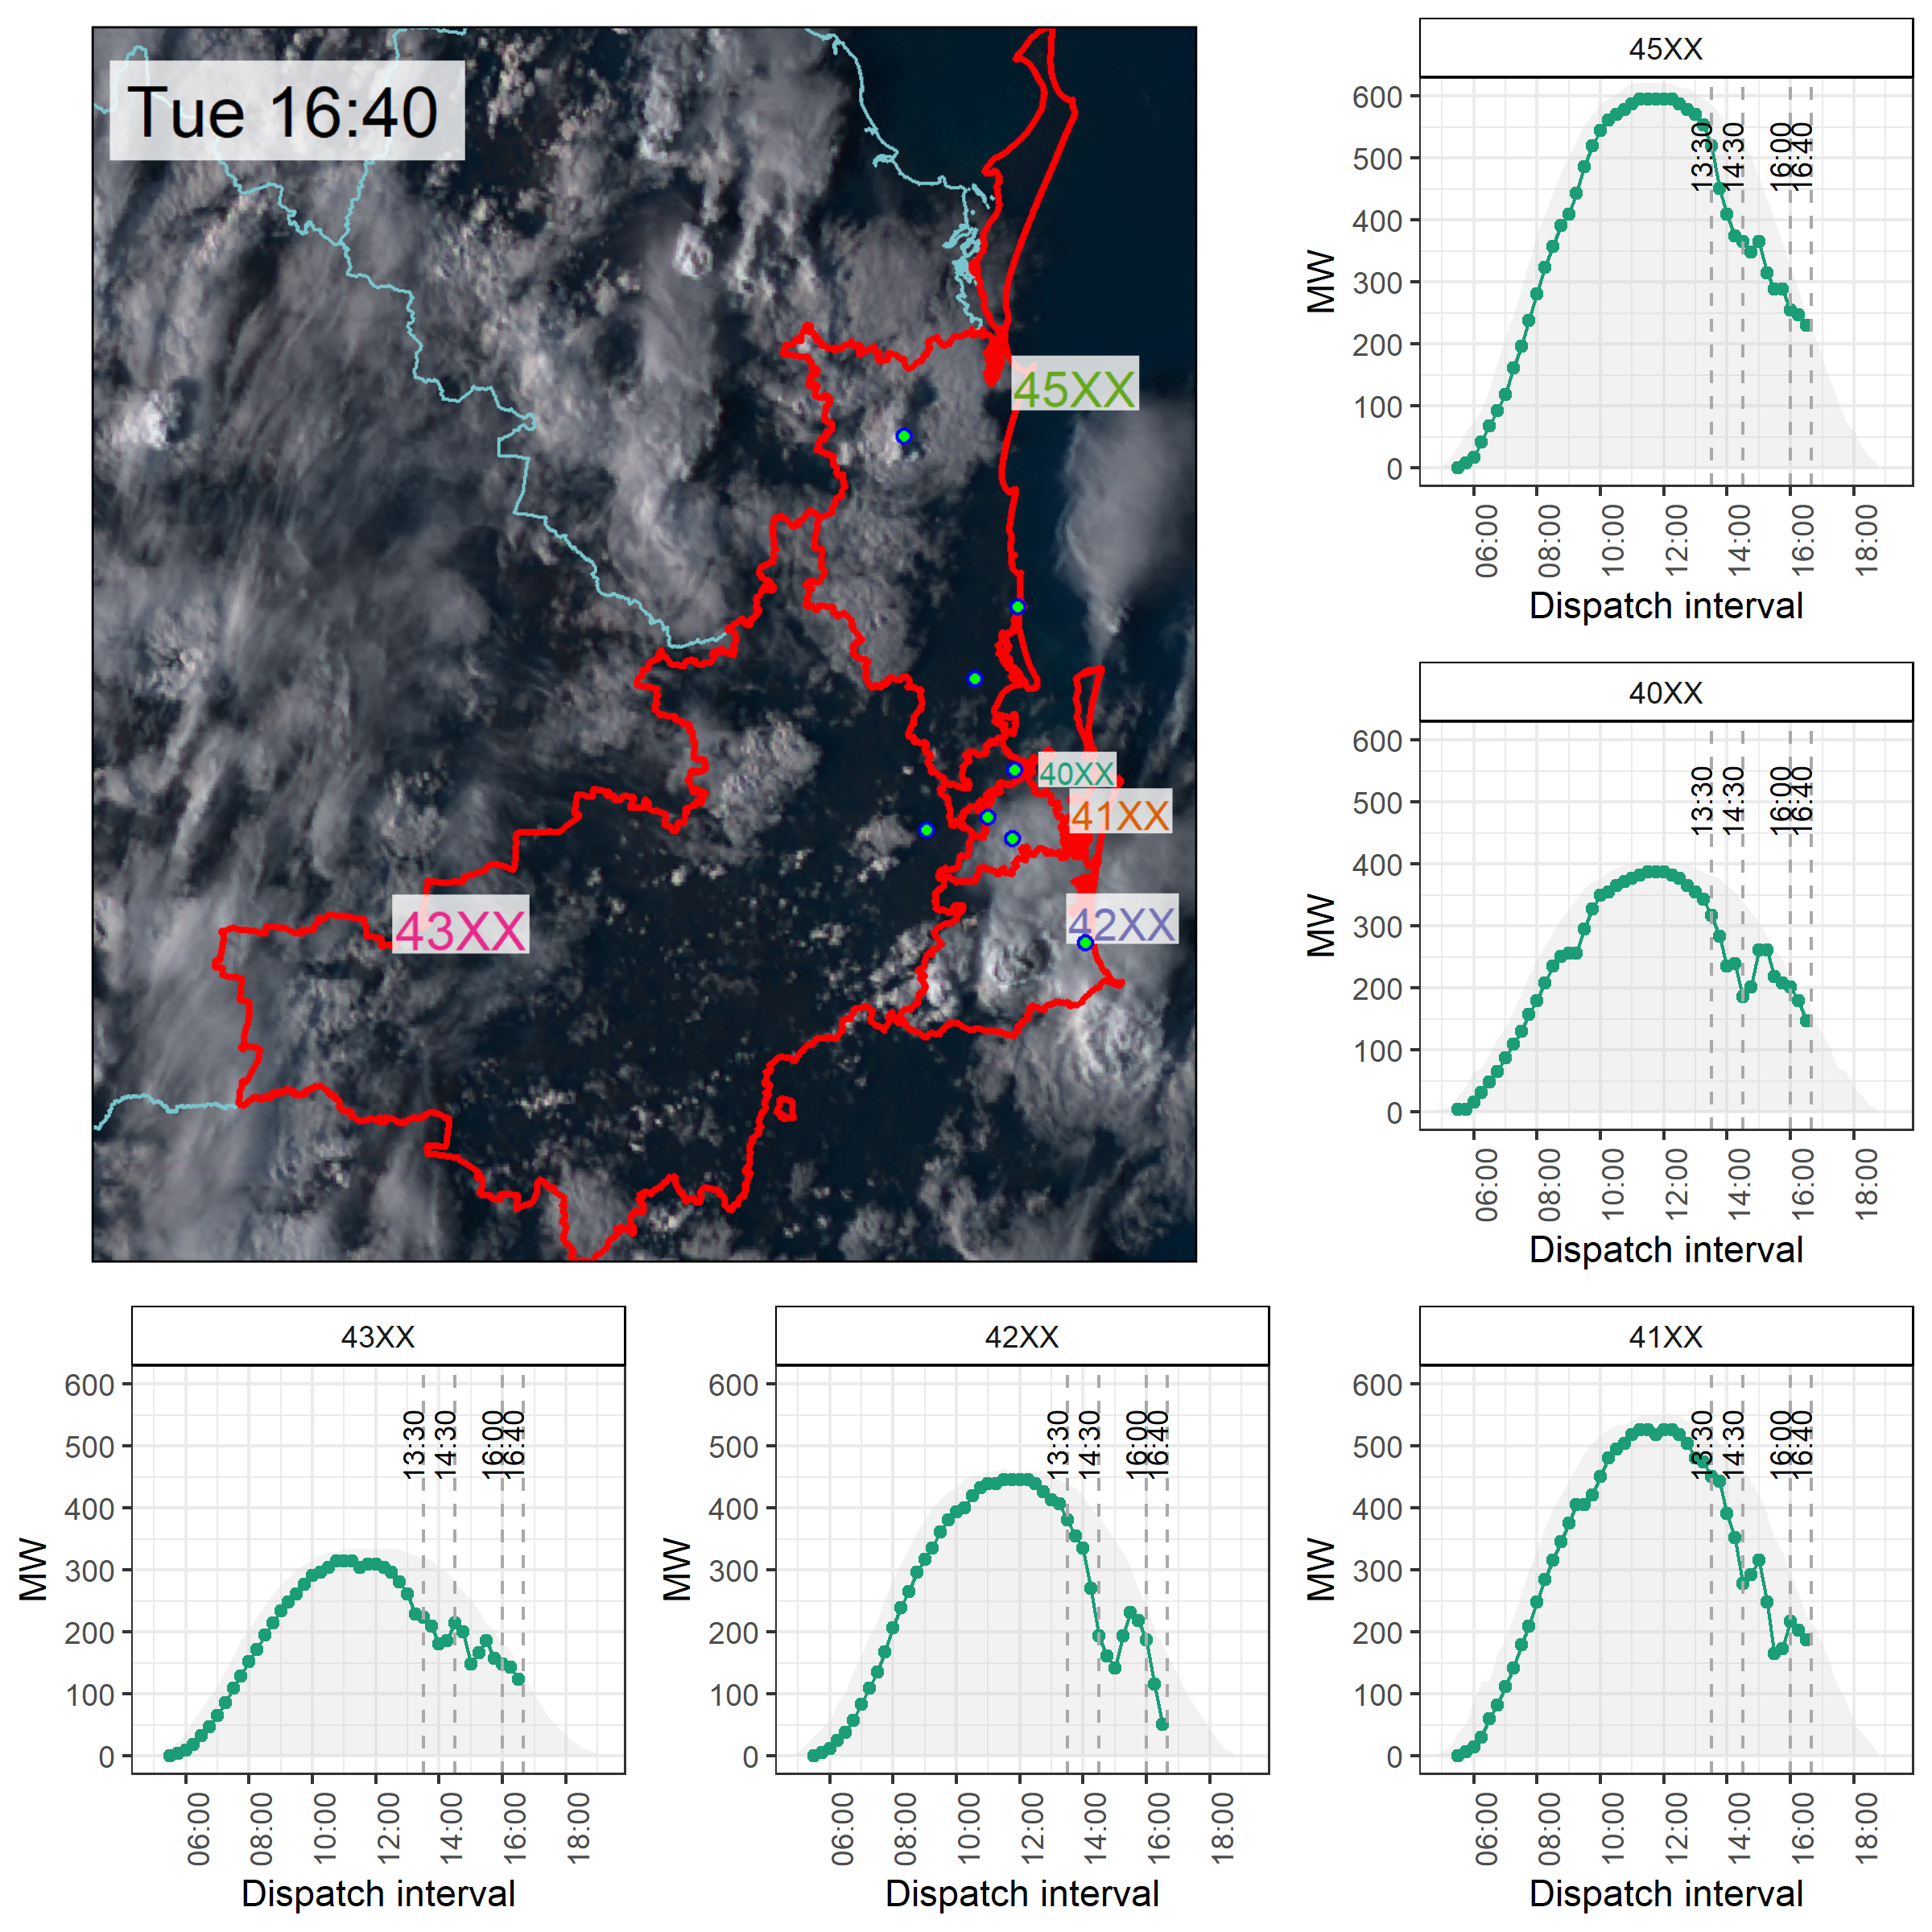
Tuesday 16:40 on 1st February 2022
By 16:40 larger clouds over the Gold Coast postcode (42XX) had intensified and were covering most of that region.
Somewhat contradicting the link between clouds and rooftop PV were what appear to be thinner (possibly higher) clouds which had progressed northwards to cover Logan City, region 41XX. In that region the estimated rooftop PV output did not decrease. Reasons for this might include the number of sampled sites (and or temporal averaging) in the APVI upscaling method that is used to estimate the postcode region-level output. As stated on https://pv-map.apvi.org.au:
“in some ‘2-digit postcode regions’, a small number of systems are contributing data and one or more systems may dominate the estimate”.
Wednesday the 2nd February 2022
On Wednesday 2nd, the declines in rooftop PV output were sharper than on Tuesday, and would have been larger in magnitude if not for the pre-existing clouds that had rolled in before midday. Some early strengthening of the pre-existing clouds over south Brisbane (region 41XX) occurred at 12:30.
Rooftop PV declines in region 45XX (north of Brisbane) commenced earlier (by 13:00) than the regions to the south (40XX, 41XX, 42XX).
Excluding region 45XX the strongest PV impacts began at 14:10 over north Brisbane, and had extended to southern Brisbane (41XX) and the Gold Coast (42XX) soon after.
Recalling a finding from Part A, the Queensland region demand spike reached its peak at 14:45. This coincides with the low levels of PV output in all postcode regions charted below.
Rooftop PV output on the 2nd
The following step-through charts show the clouds and rooftop PV output for the selected postcode regions on Wednesday. Wednesday’s clouds were more stratified than Tuesday’s, leading to low rooftop PV output for much of the day.
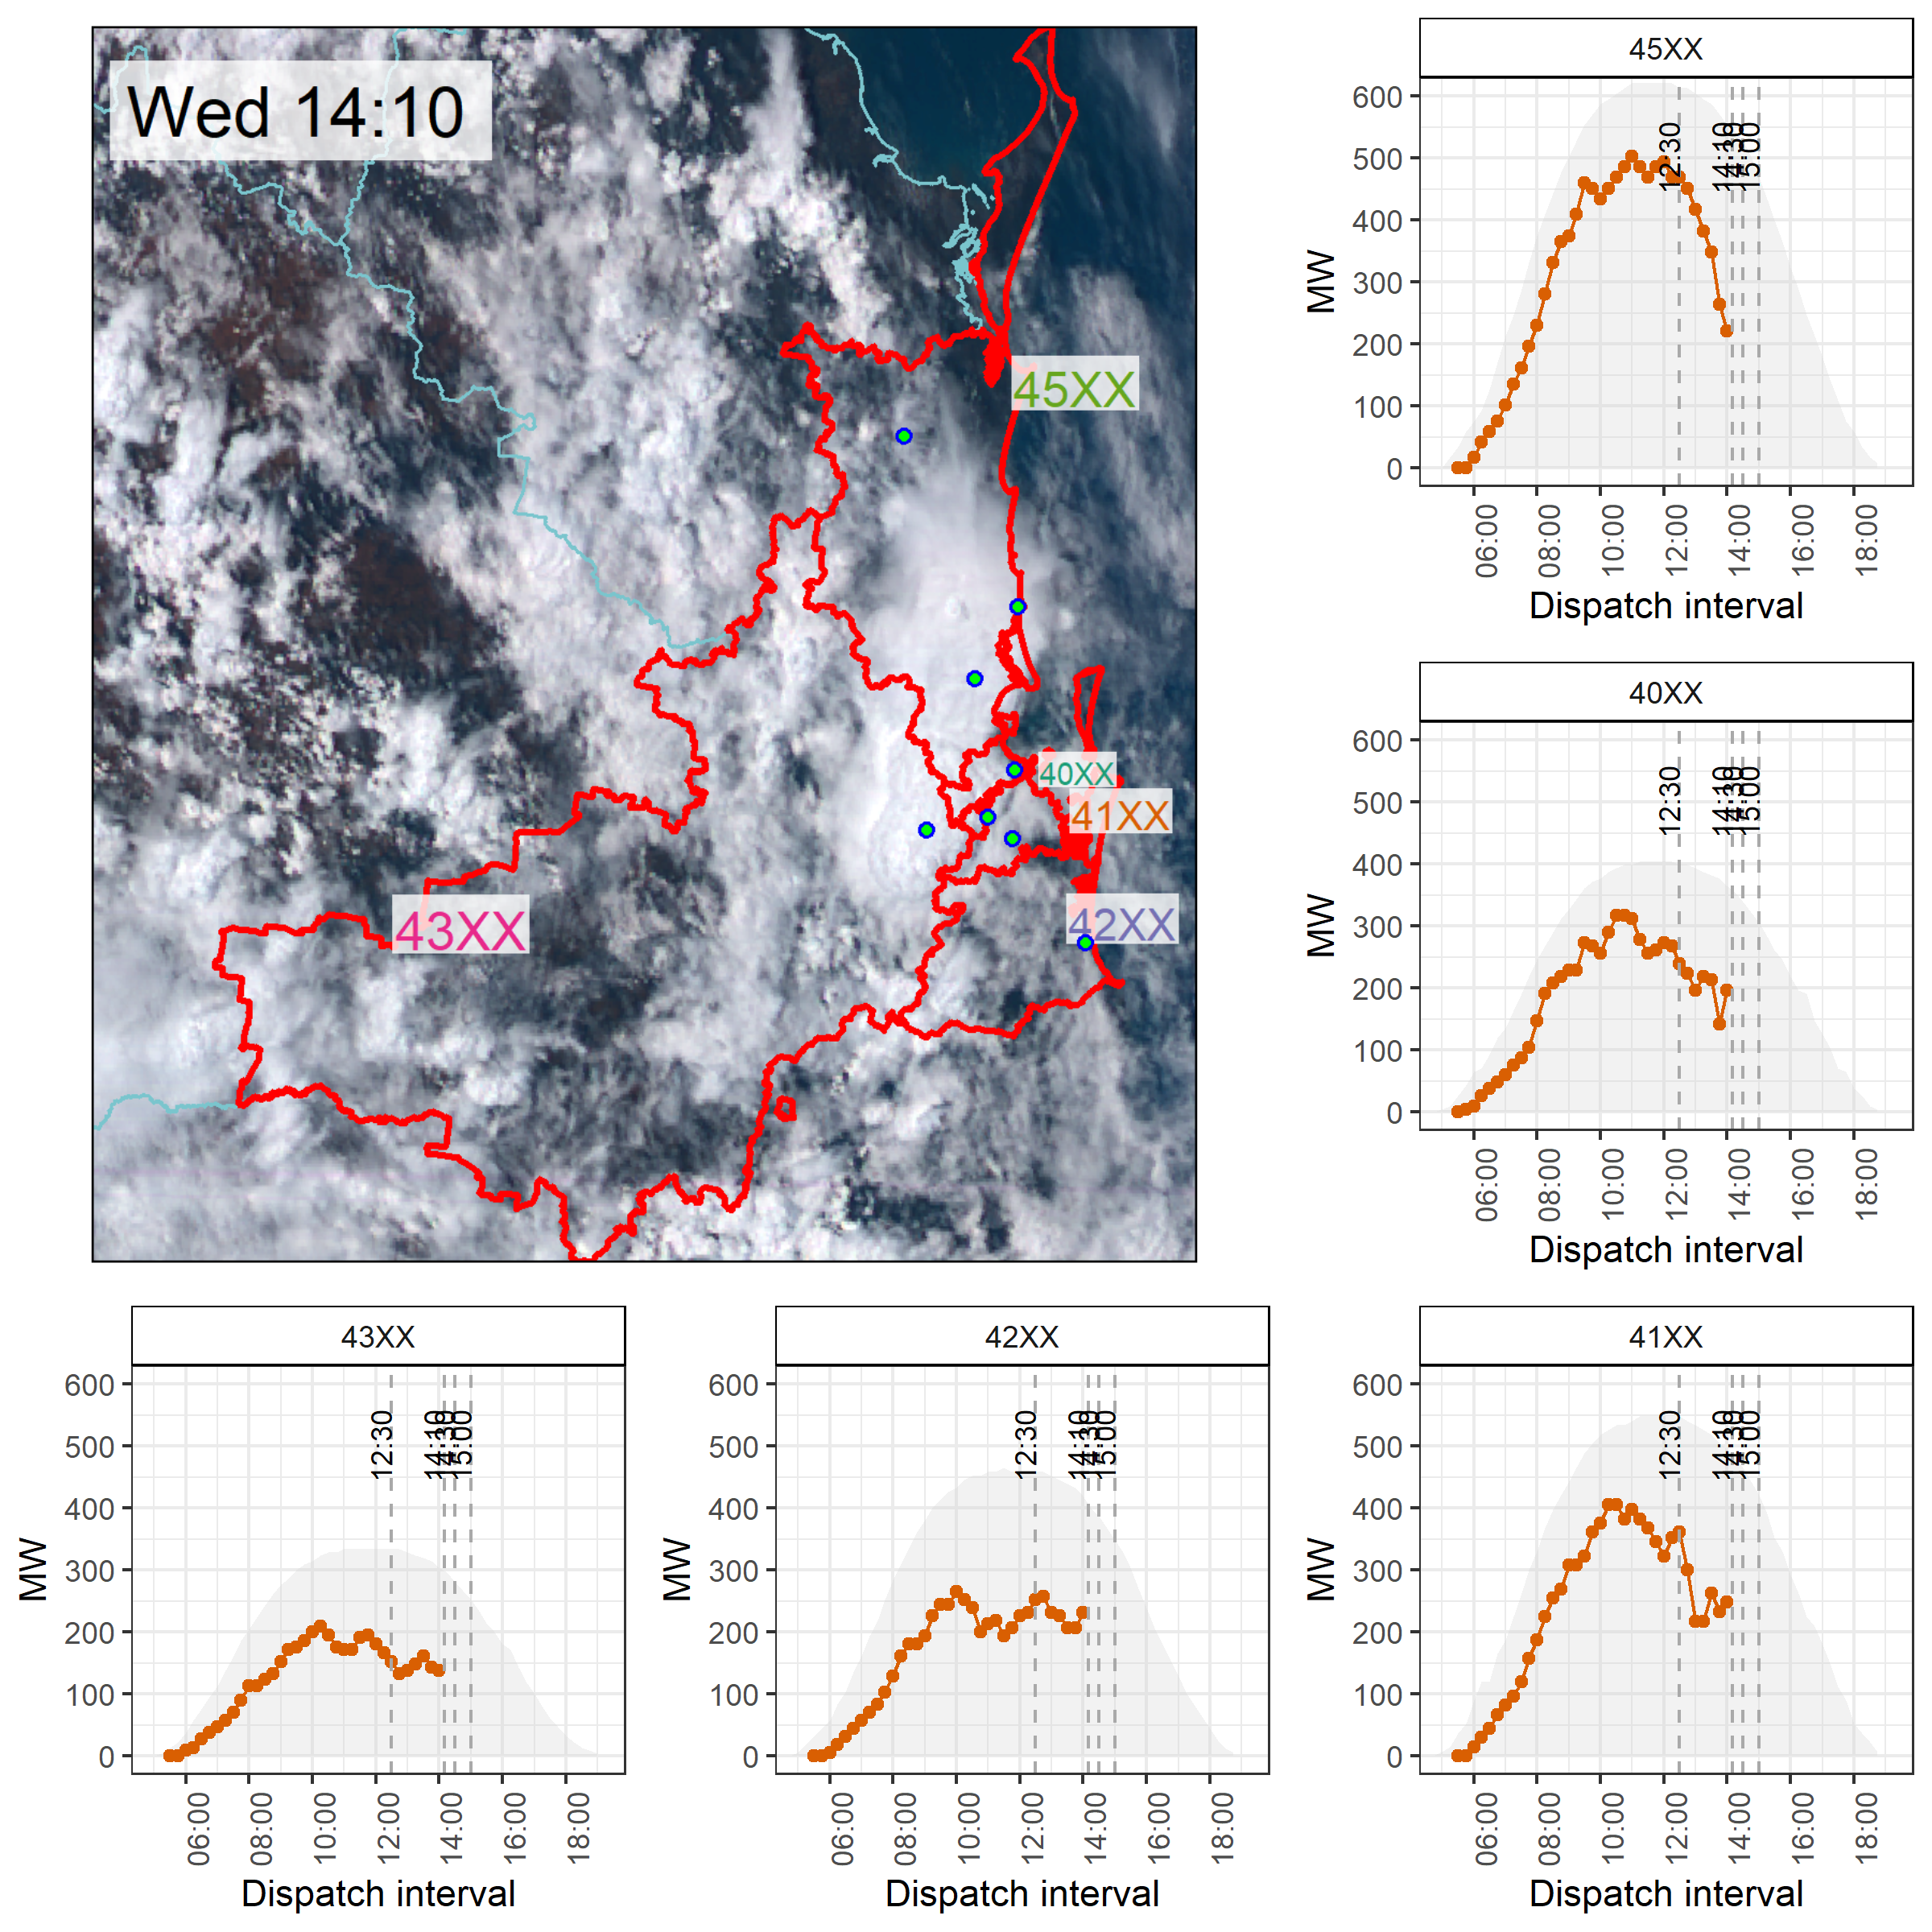
Wednesday 14:10 on 2nd February 2022
Stronger clouds had already developed by 14:10 to impact Brisbane (40XX) and Logan City (41XX), and were continuing to impact north of Brisbane (45XX). A large storm cell was positioned to the west of Brisbane, within region 43XX over Ipswich.
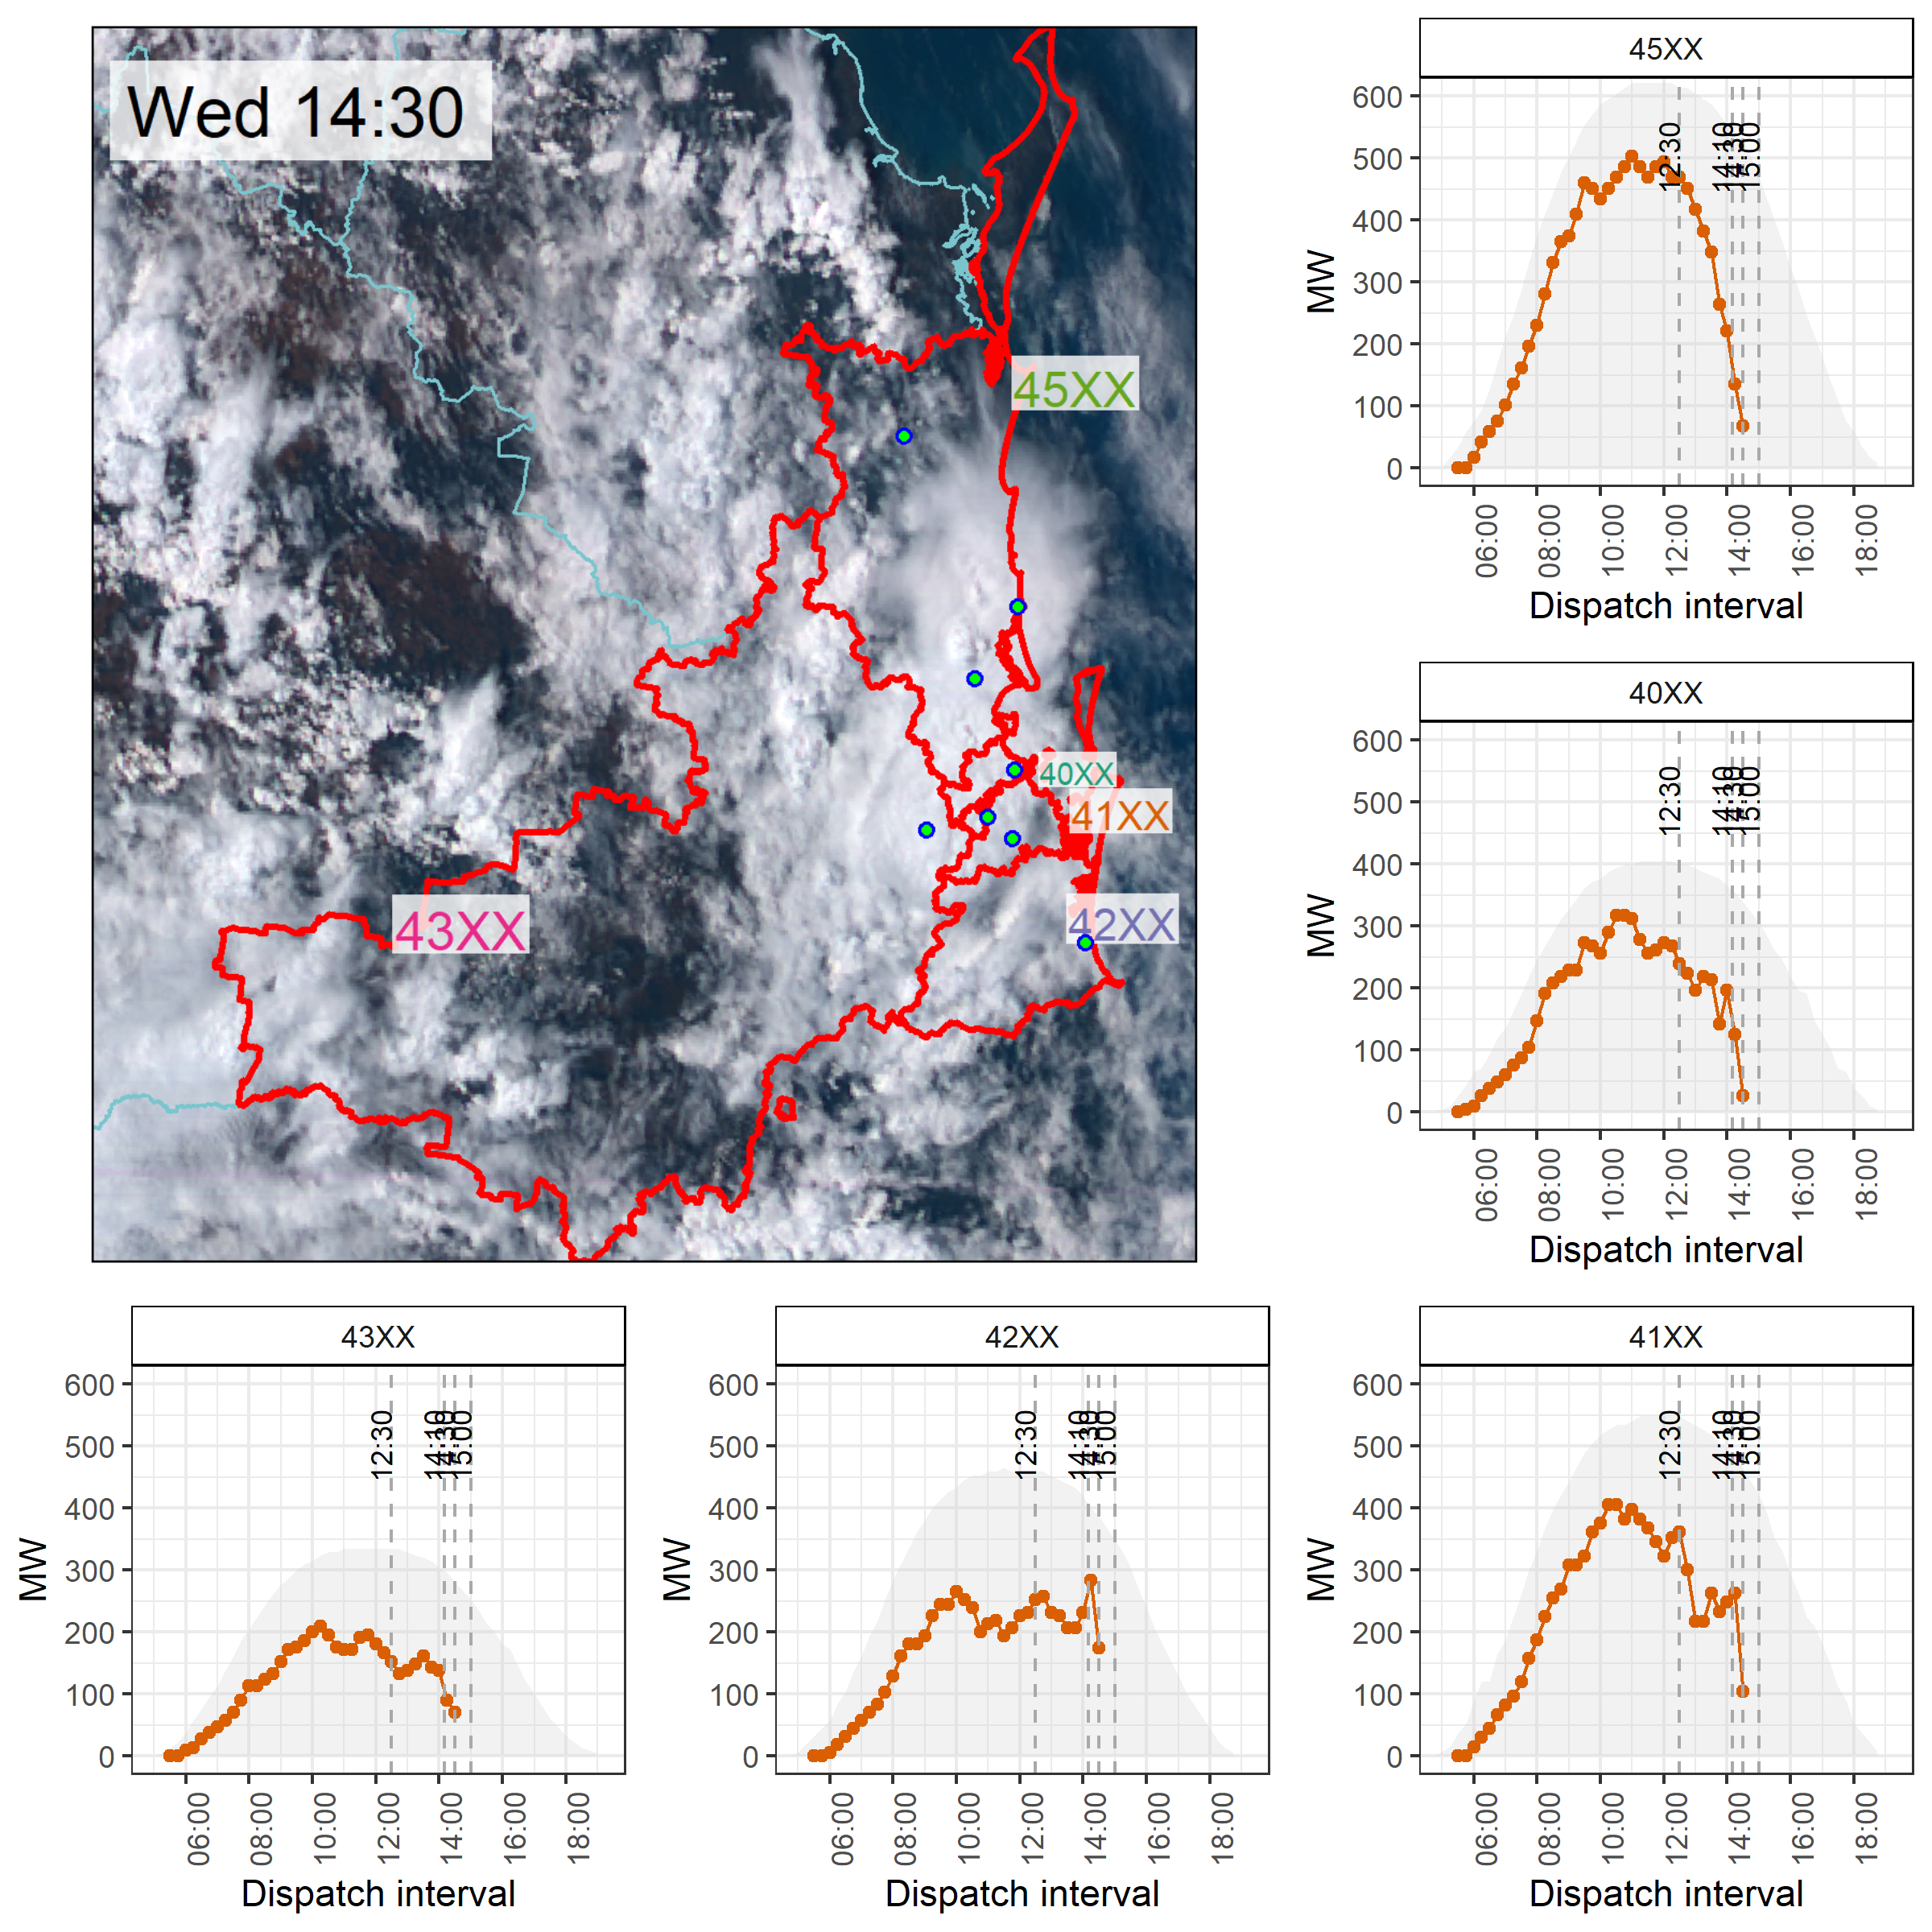
Wednesday 14:30 on 2nd February 2022
Clouds had continued to strengthen over region 45XX and 40XX, and were extending over 41XX and 42XX. The storm cell that was over Ipswich had moved eastwards – output in the north Brisbane region had dropped to levels not seen since 6am that day.
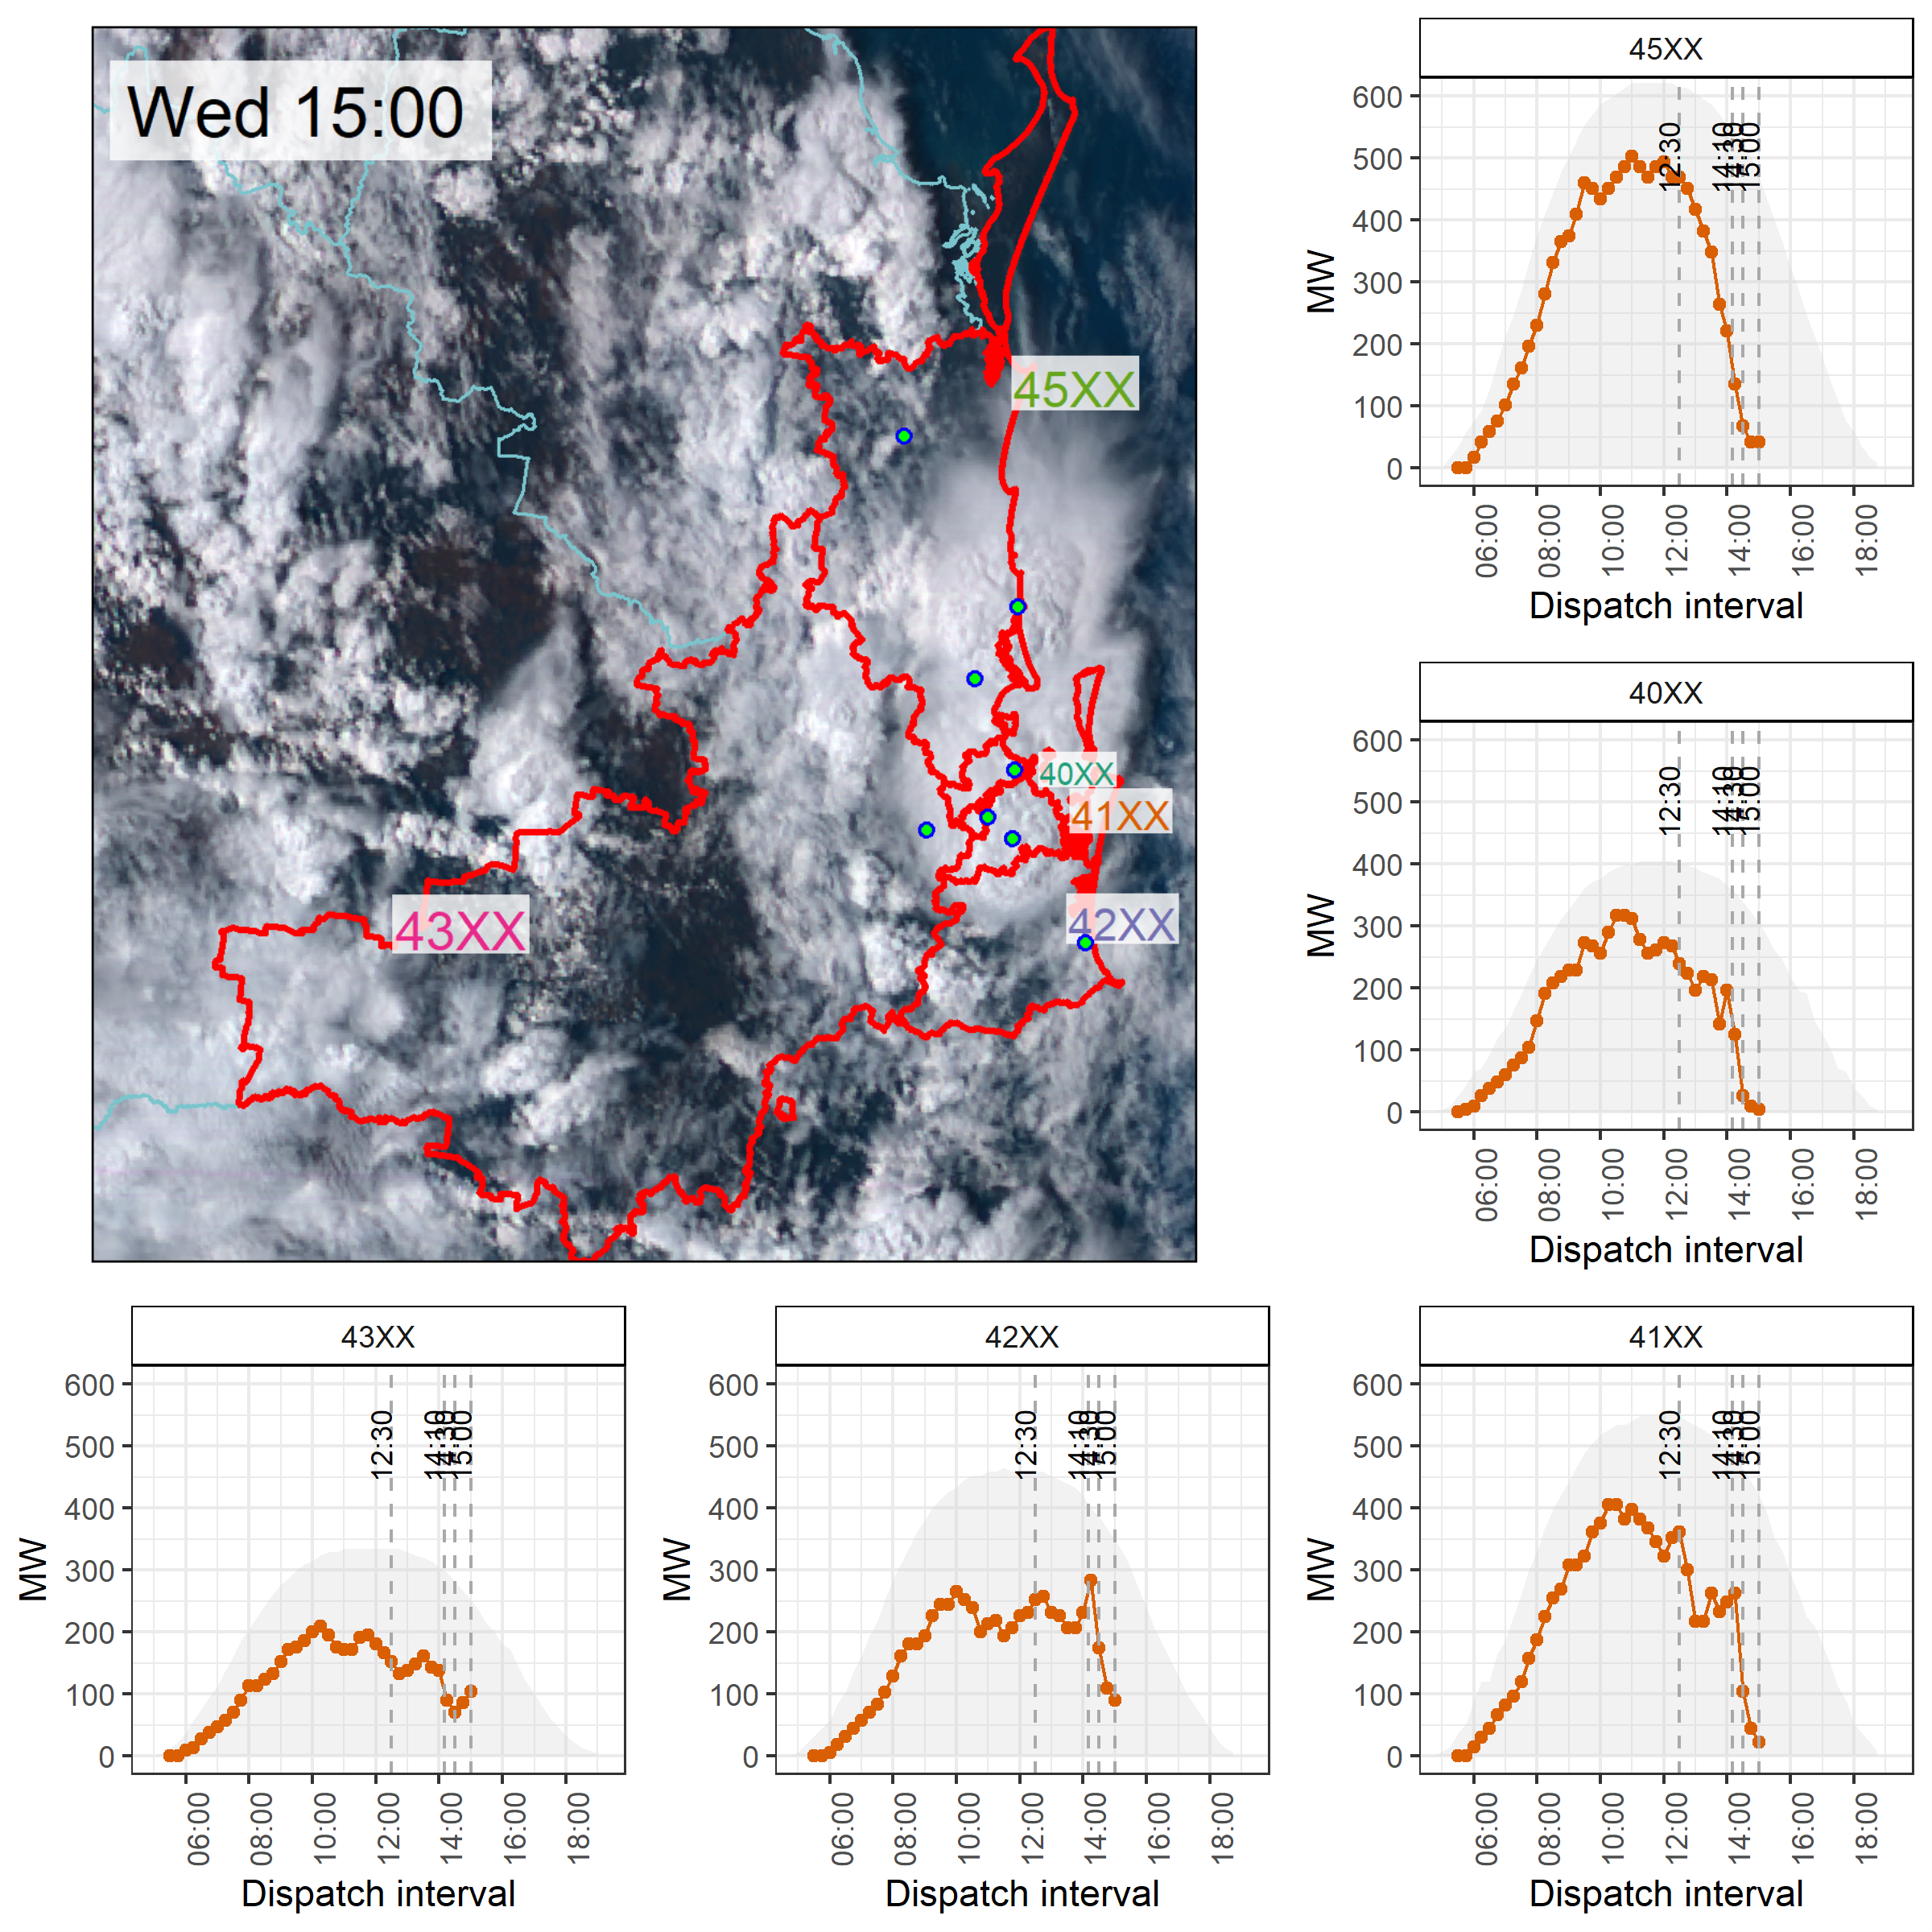
Wednesday 15:00 on 2nd February 2022
By 15:00 the clouds had developed further over much of Brisbane, to the north, south and west.
Rooftop PV output around Brisbane and Logan City and in the north through Caboolture and Caloundra was reduced to near-zero levels and this had taken roughly 45 minutes only.
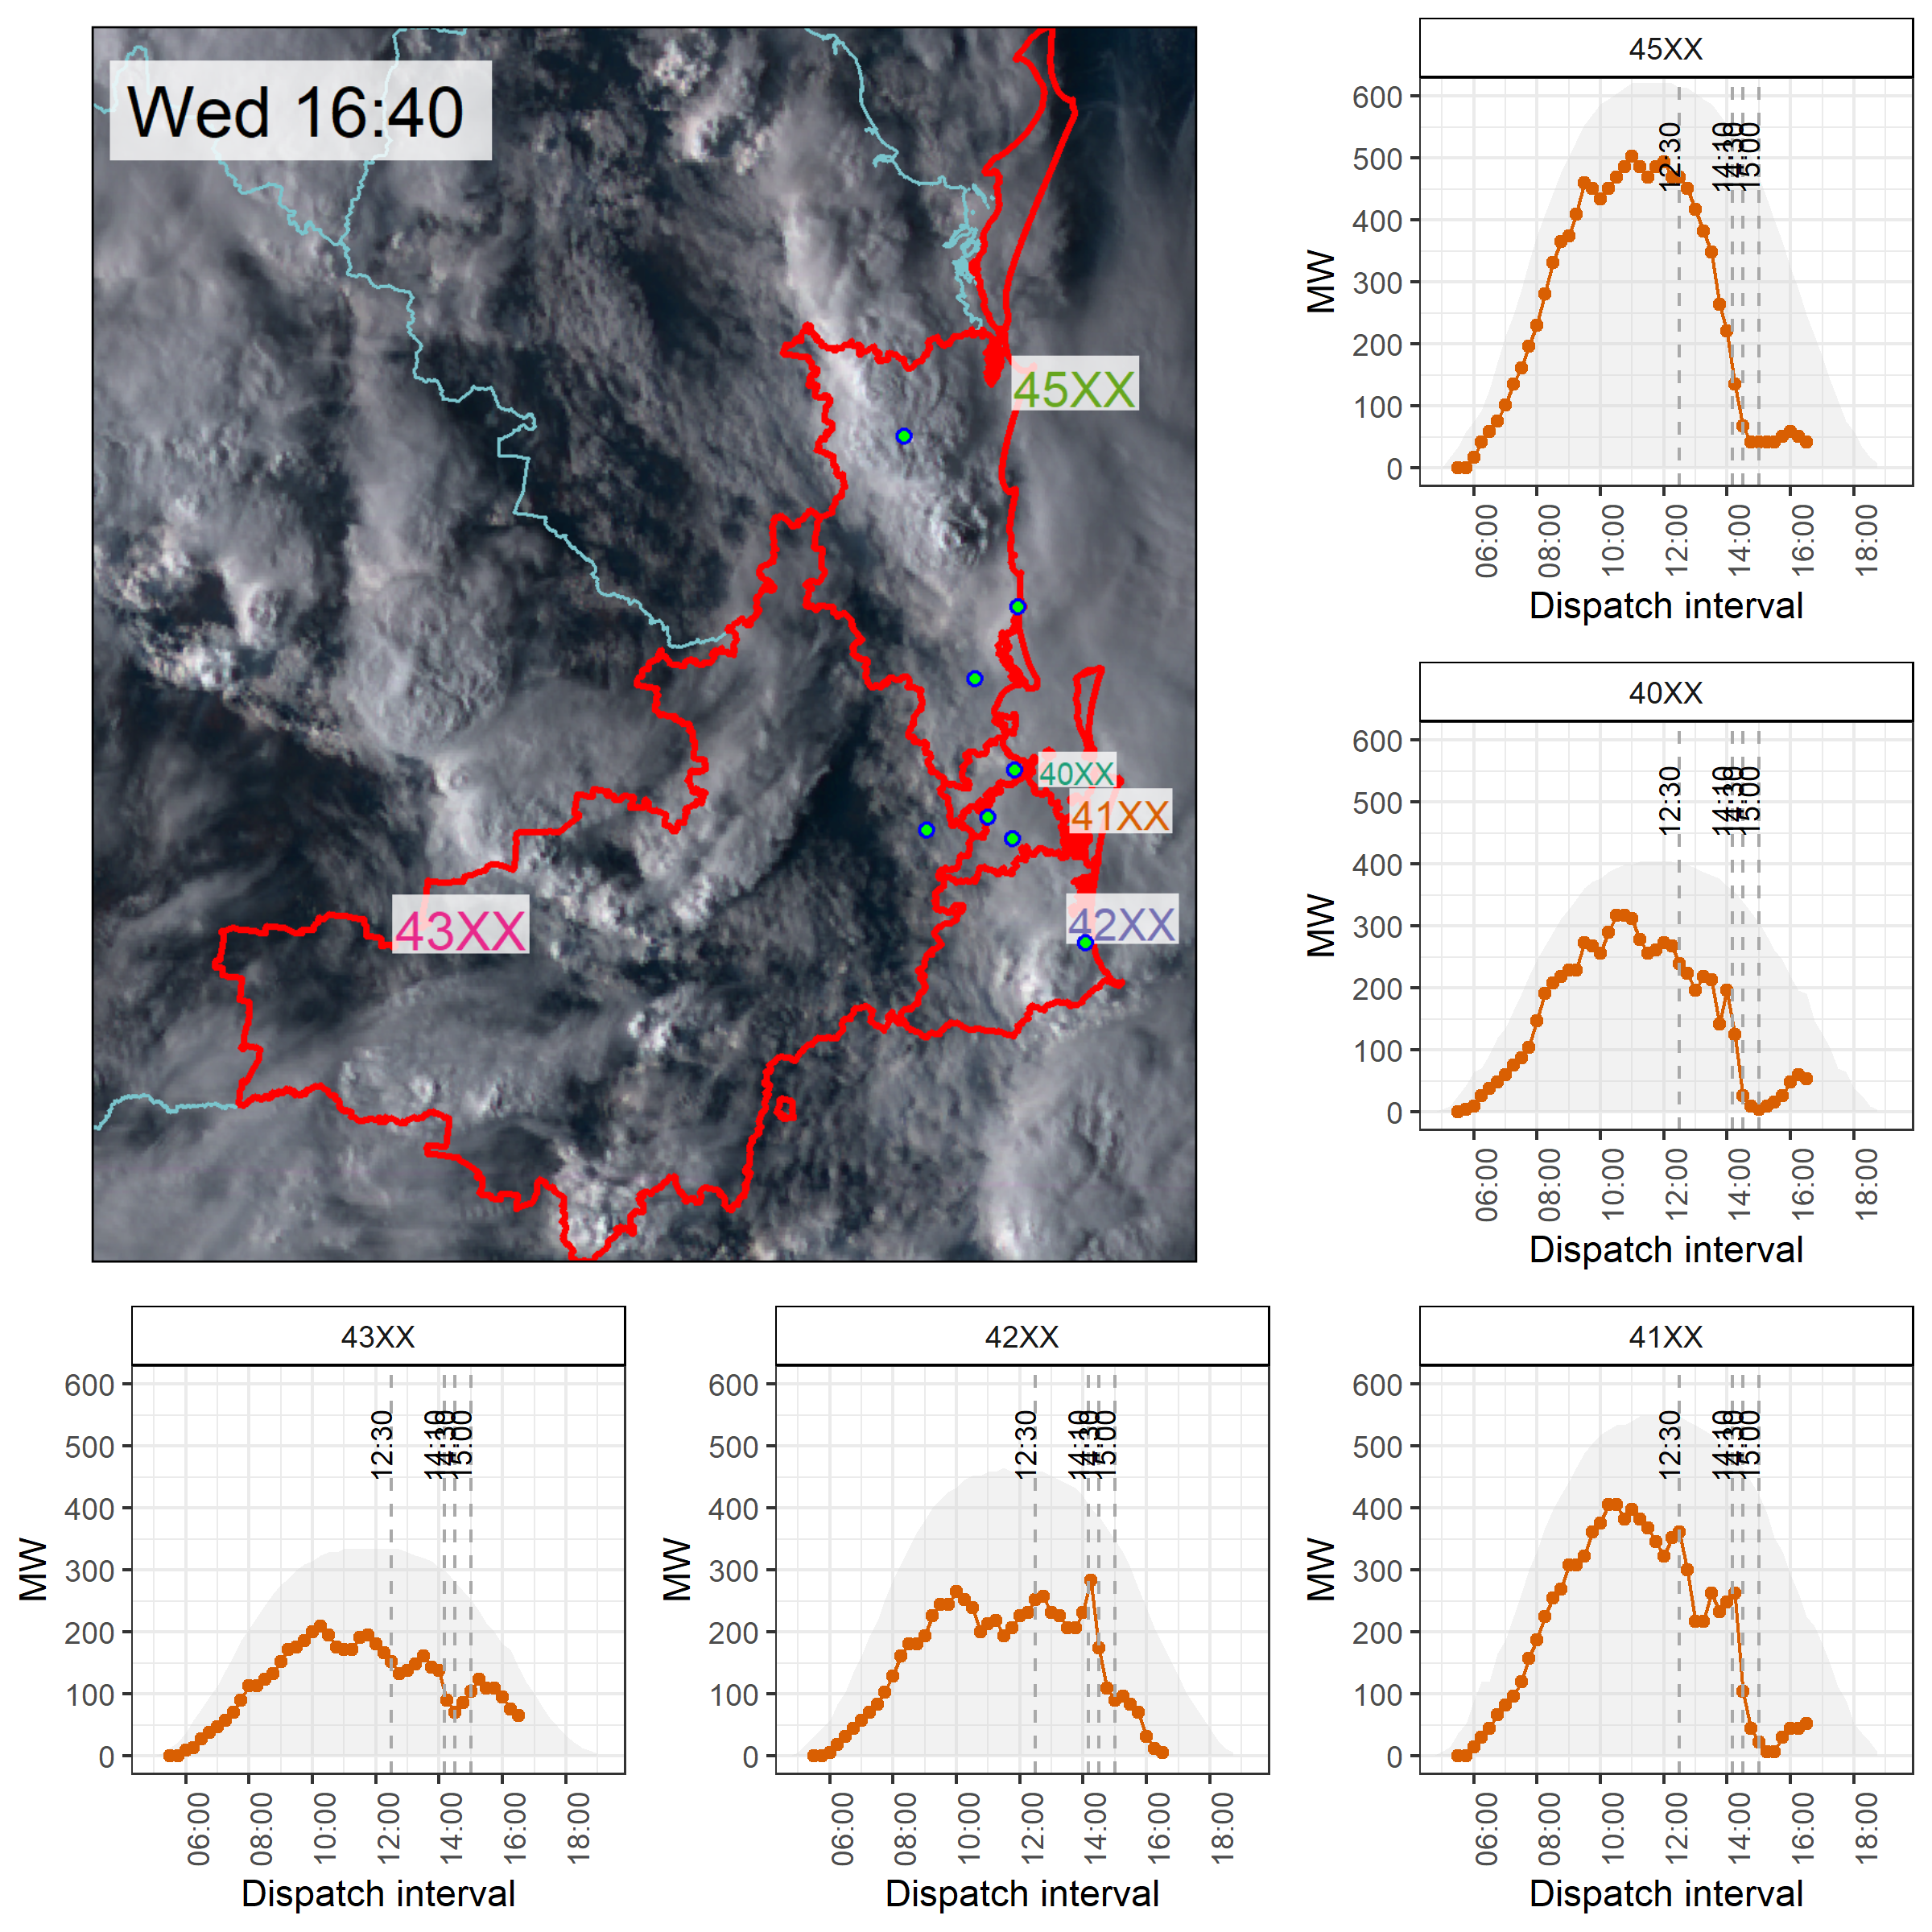
Wednesday 16:40 on 2nd February 2022
By 16:40 cloud coverage was extensive over most of the affected postcode regions. A gap in the clouds is visible to the west of Brisbane, in region 43XX approaching Ipswich. Later, this gap liberated some sunshine over Logan City, for a short period around 17:00. That led to rooftop PV output increases but the increases were short-lived and relatively small given the sun was setting.
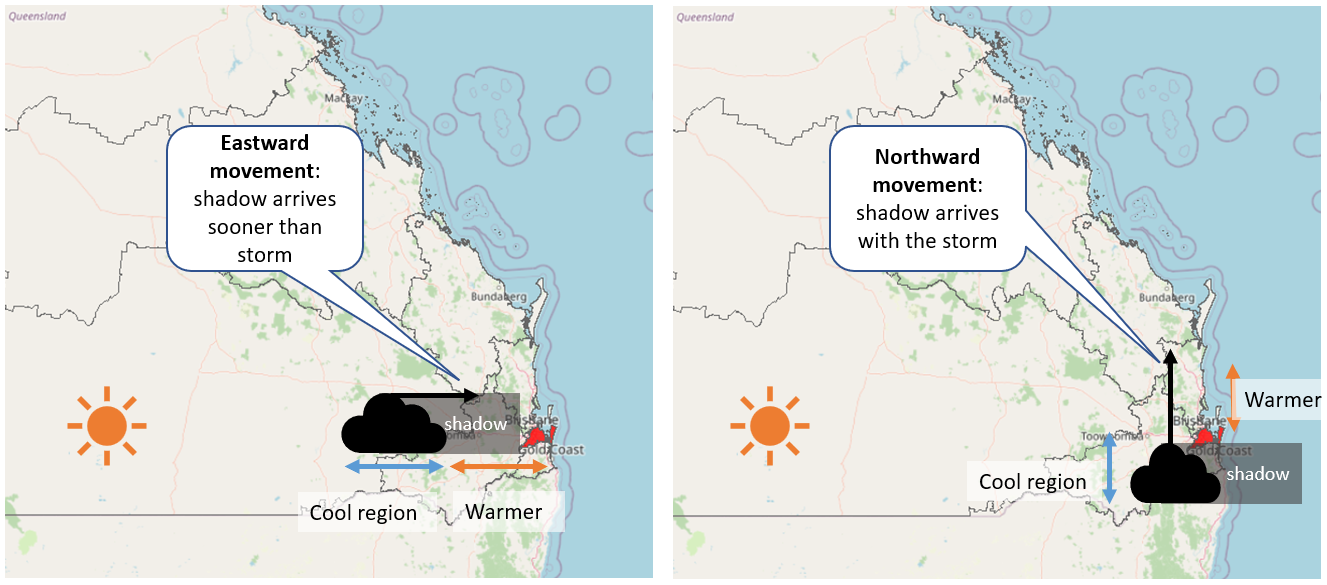
The ‘Russ Christ effect’
Having seen how rooftop PV varied in the presence of clouds on Tuesday and Wednesday, and noting from Part A how rooftop PV reductions preceded cooling on the Wednesday but not on the Tuesday, it appears that accounting for rooftop PV in demand forecasts has an additional level of nuance to it. If we note the direction the clouds may evolve in, we can consider the impact of two general situations that I describe in the figure below:
- Cloud shadows hit before cooling.
- Cooling and shadows arrive at the same time.
It was Professor Paul Simshauser’s (CEO Powerlink Queensland) presentation at the Queensland Energy Club on Wednesday 16th February 2022, where he brought this to our attention and referred to it as the “Russ Christ effect”.
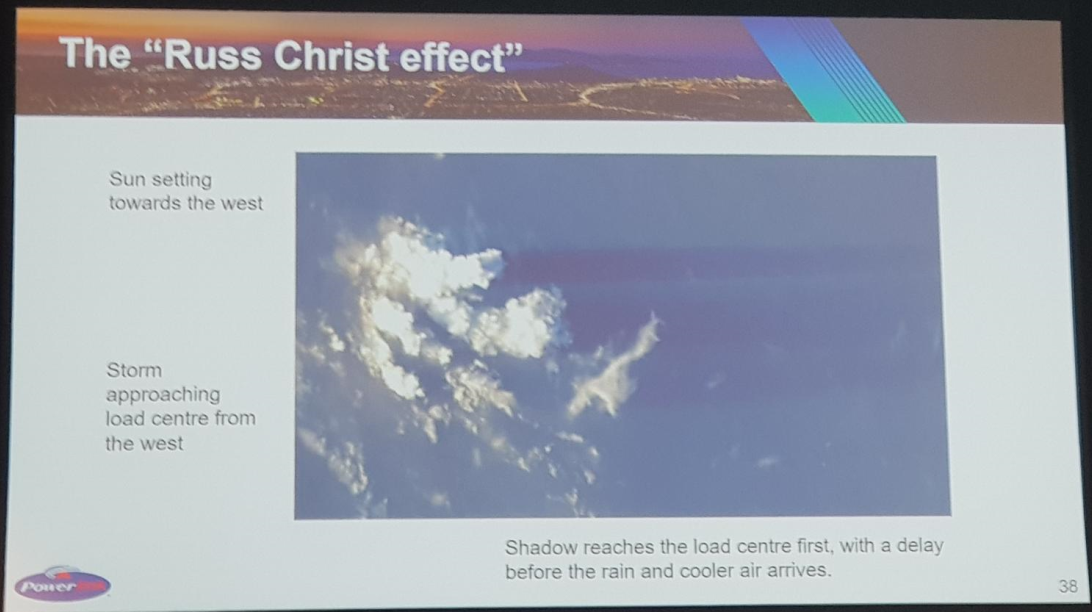
Using the example below, at left: When the sun is in the west (afternoon conditions in Queensland) cloud shadows can limit solar PV output further east of where the cooling effect of the cloud (associated rain) is.
Conversely, below, right, if the cloud is moving northward along the coast its cooling and shadows have a stronger likelihood of occurring at the same time.
Can this be the reason for the 30 minute lag between rooftop PV impacts and cooling at Archerfield?
Assessment of Large-Scale Solar Generation
We assessed how solar farms were impacted over on the 1st and 2nd of February 2022. The following chart maps the locations of the large-scale solar generators.
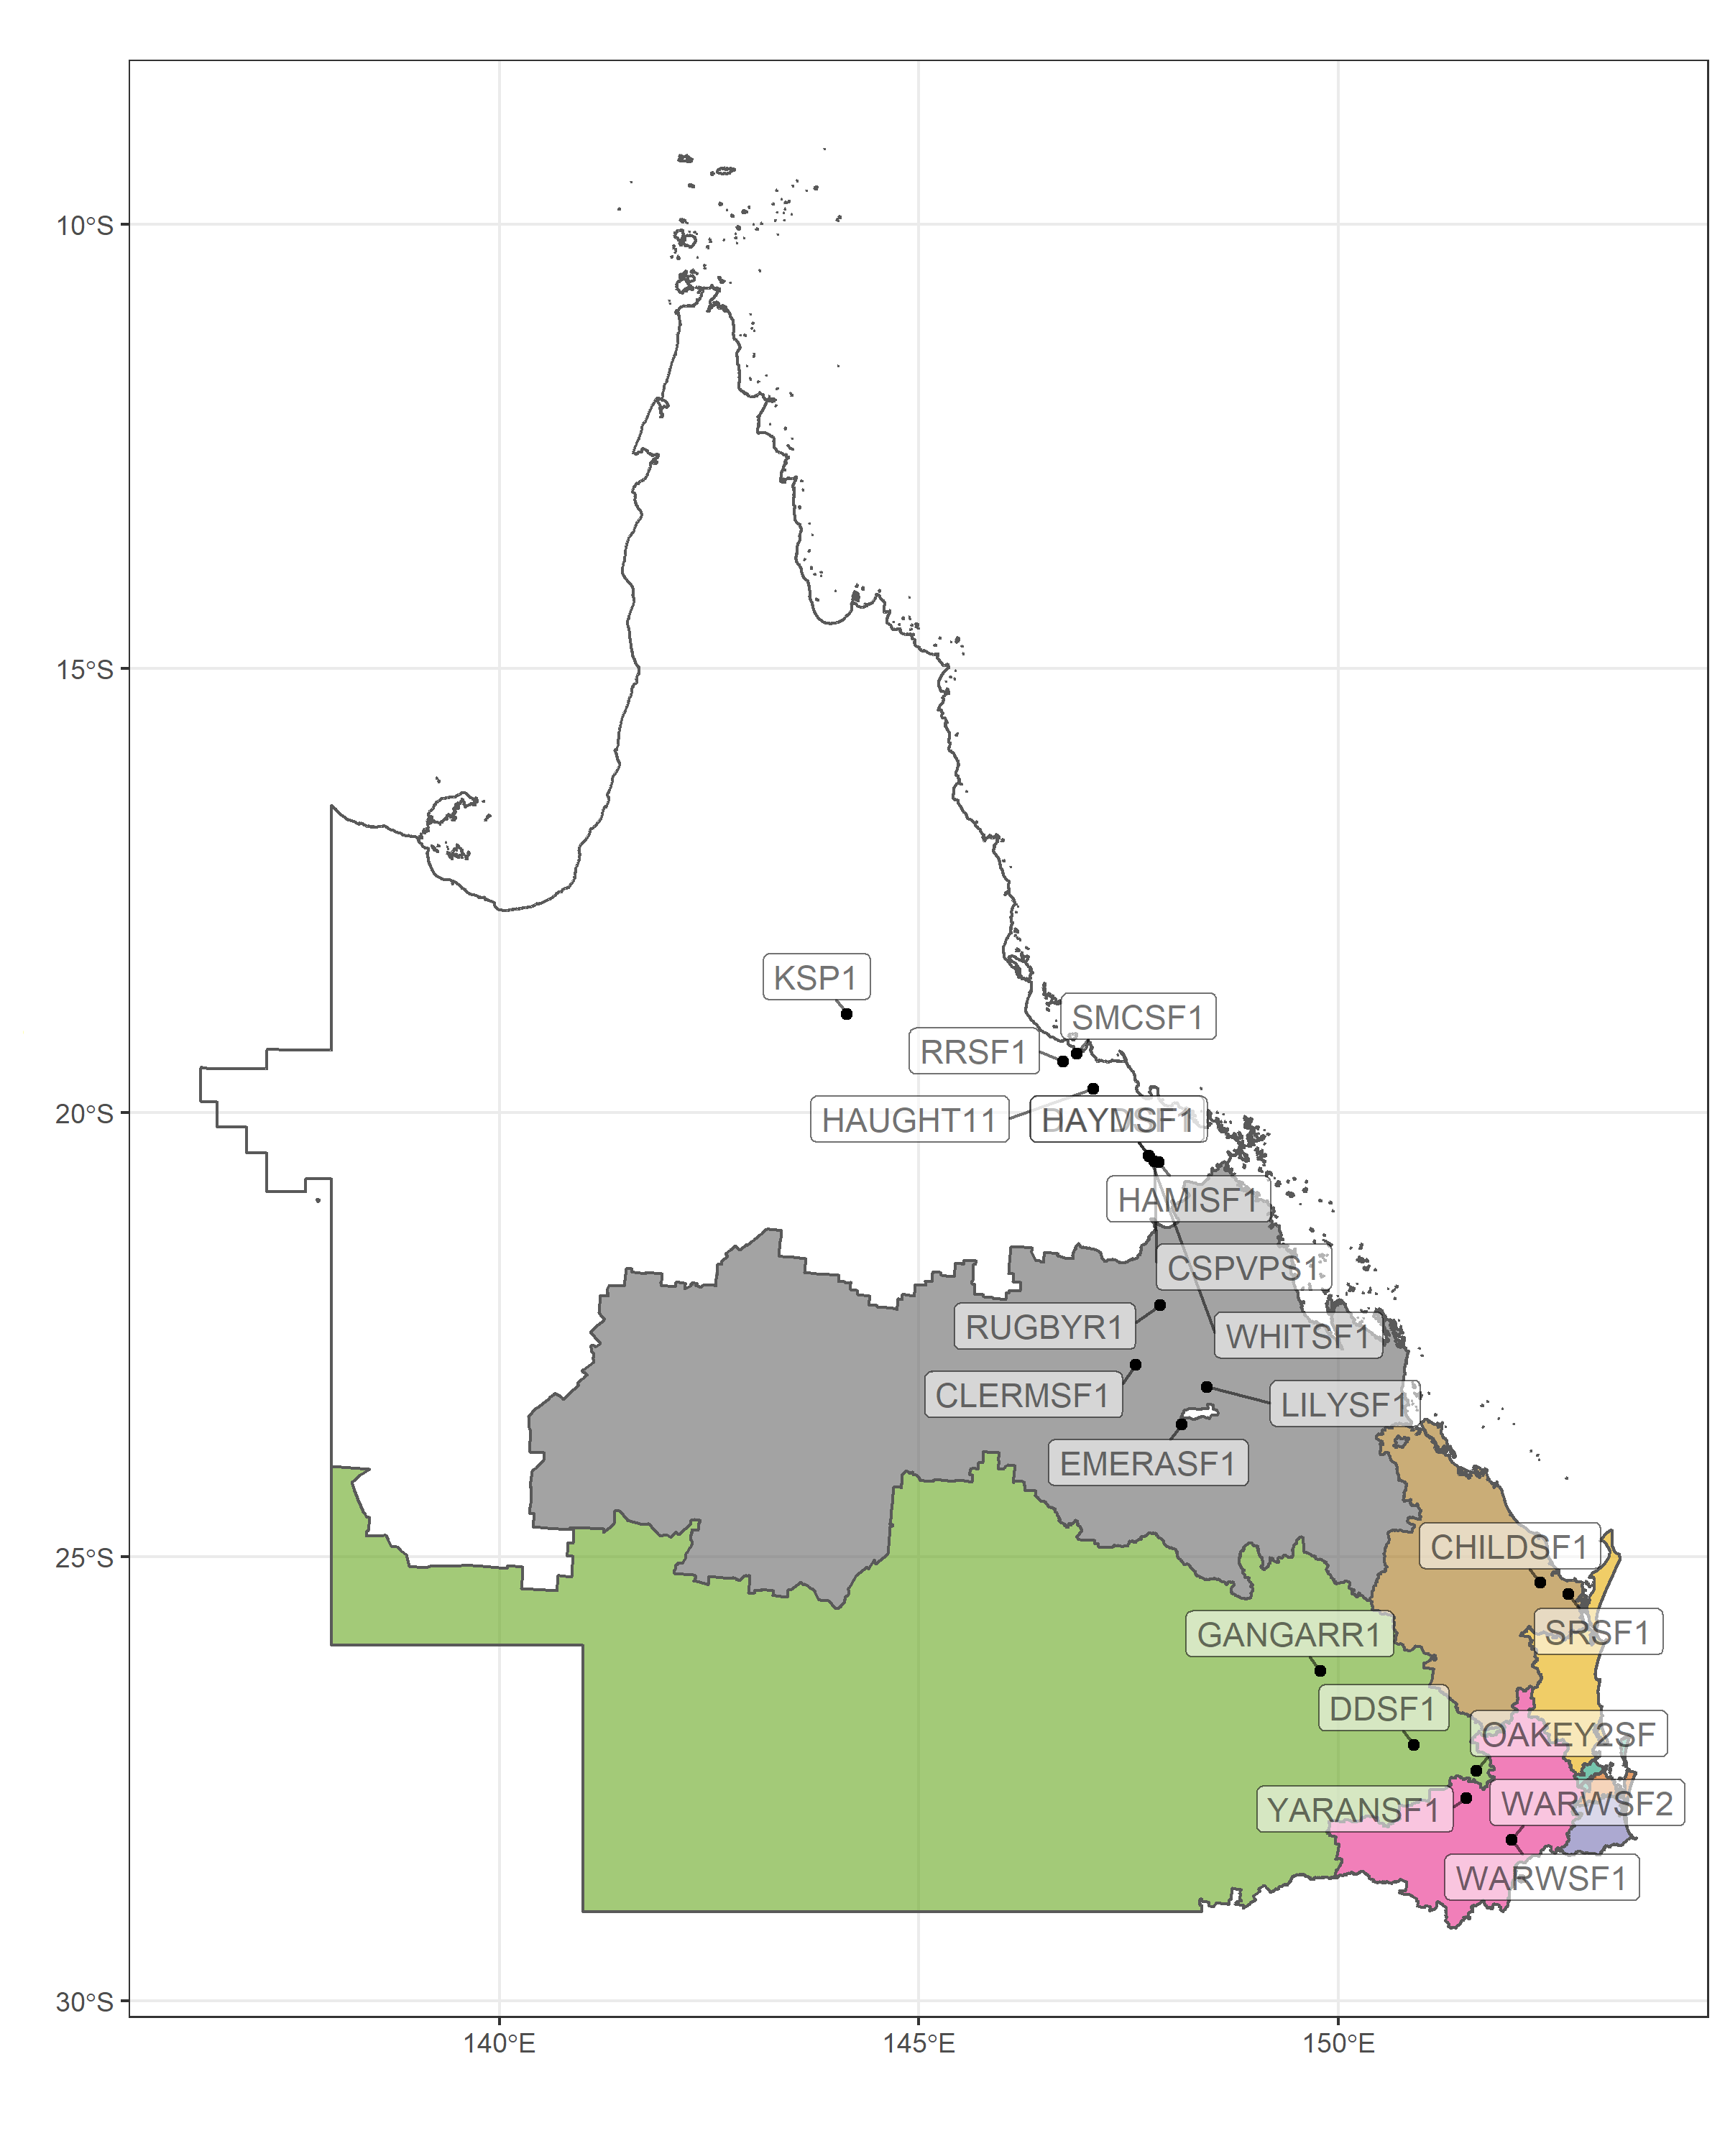
Generators, QLD
Each generator is mapped to its postcode-region so that comparison to rooftop PV output could be made. The data was normalised using maximum output from the prior 2 months.
Most large-scale solar generators are located out of the south-east Queensland. Generators closest to our area of interest include WARWSF1 and WARWSF2, OAKEY2SF, YARANSF1, SRSF1 and CHILDSF1
Before comparing generator output and rooftop PV we remind ourselves that large-scale solar output will vary for more reasons than just changing solar radiation. Dispatch instructions (such as semi-dispatch caps that put an upper limit on output) and constraints (which also constrain output) are two of these reasons.
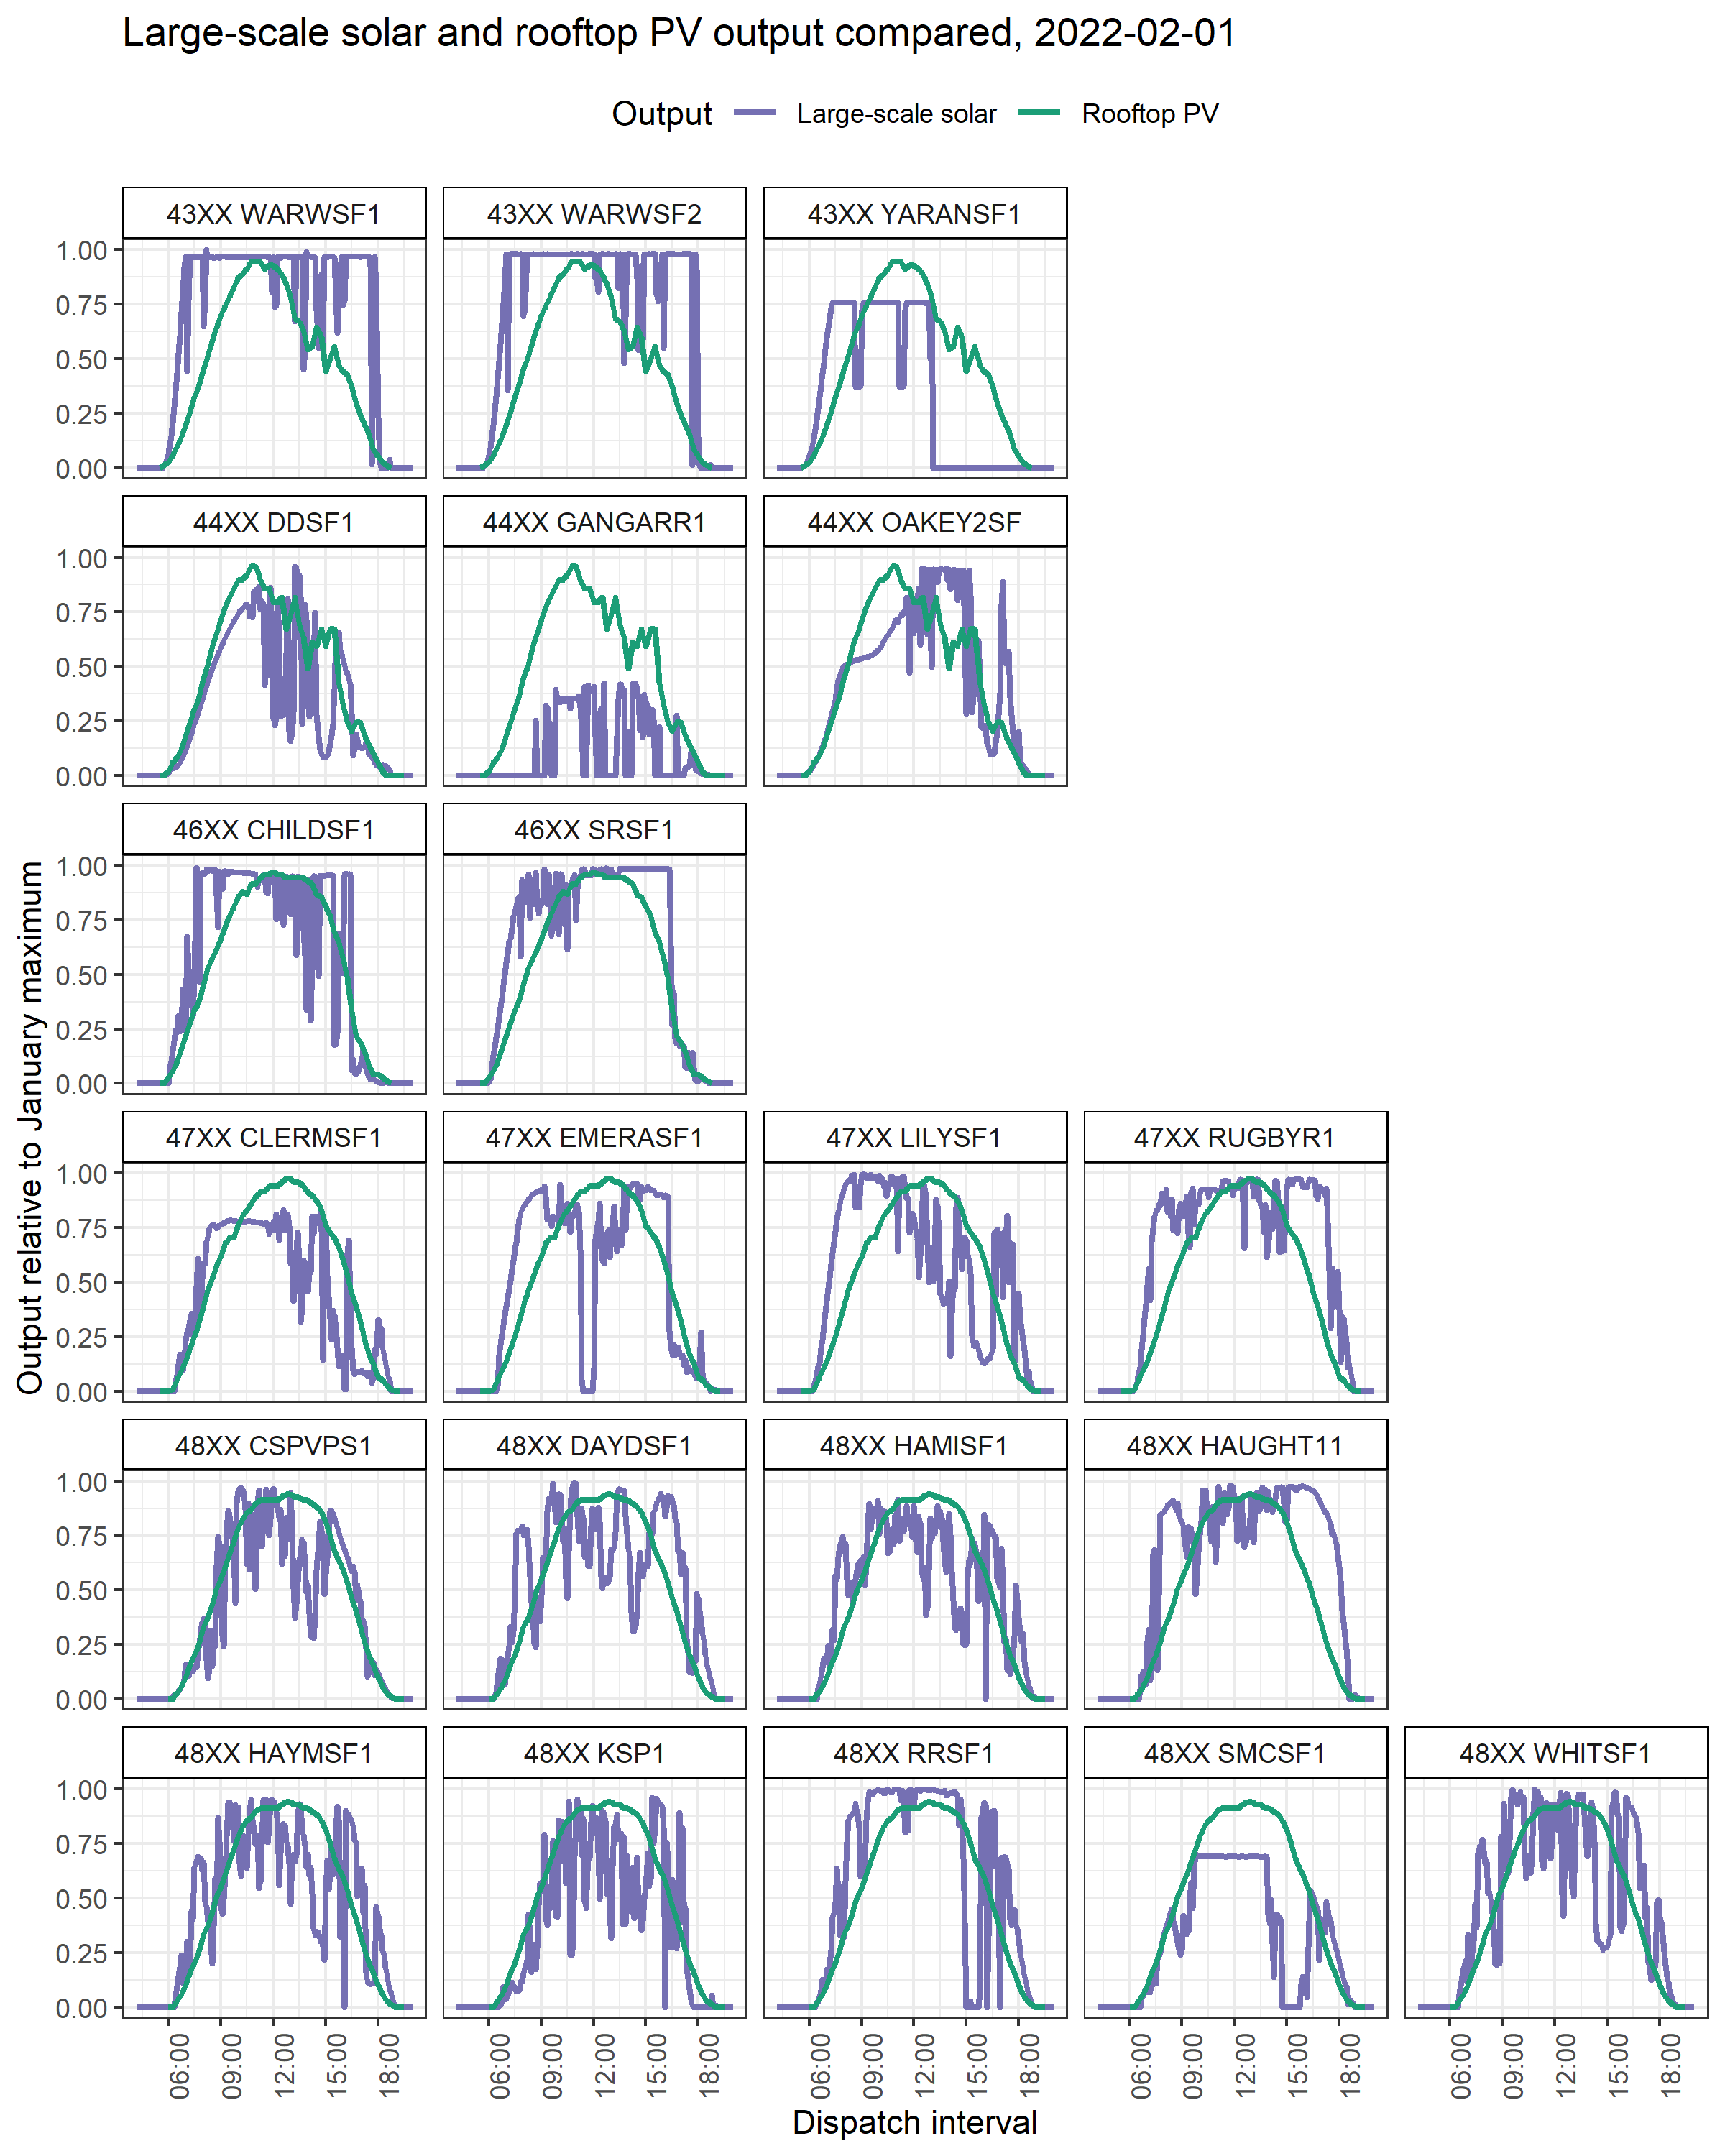
Tuesday 1st February 2022
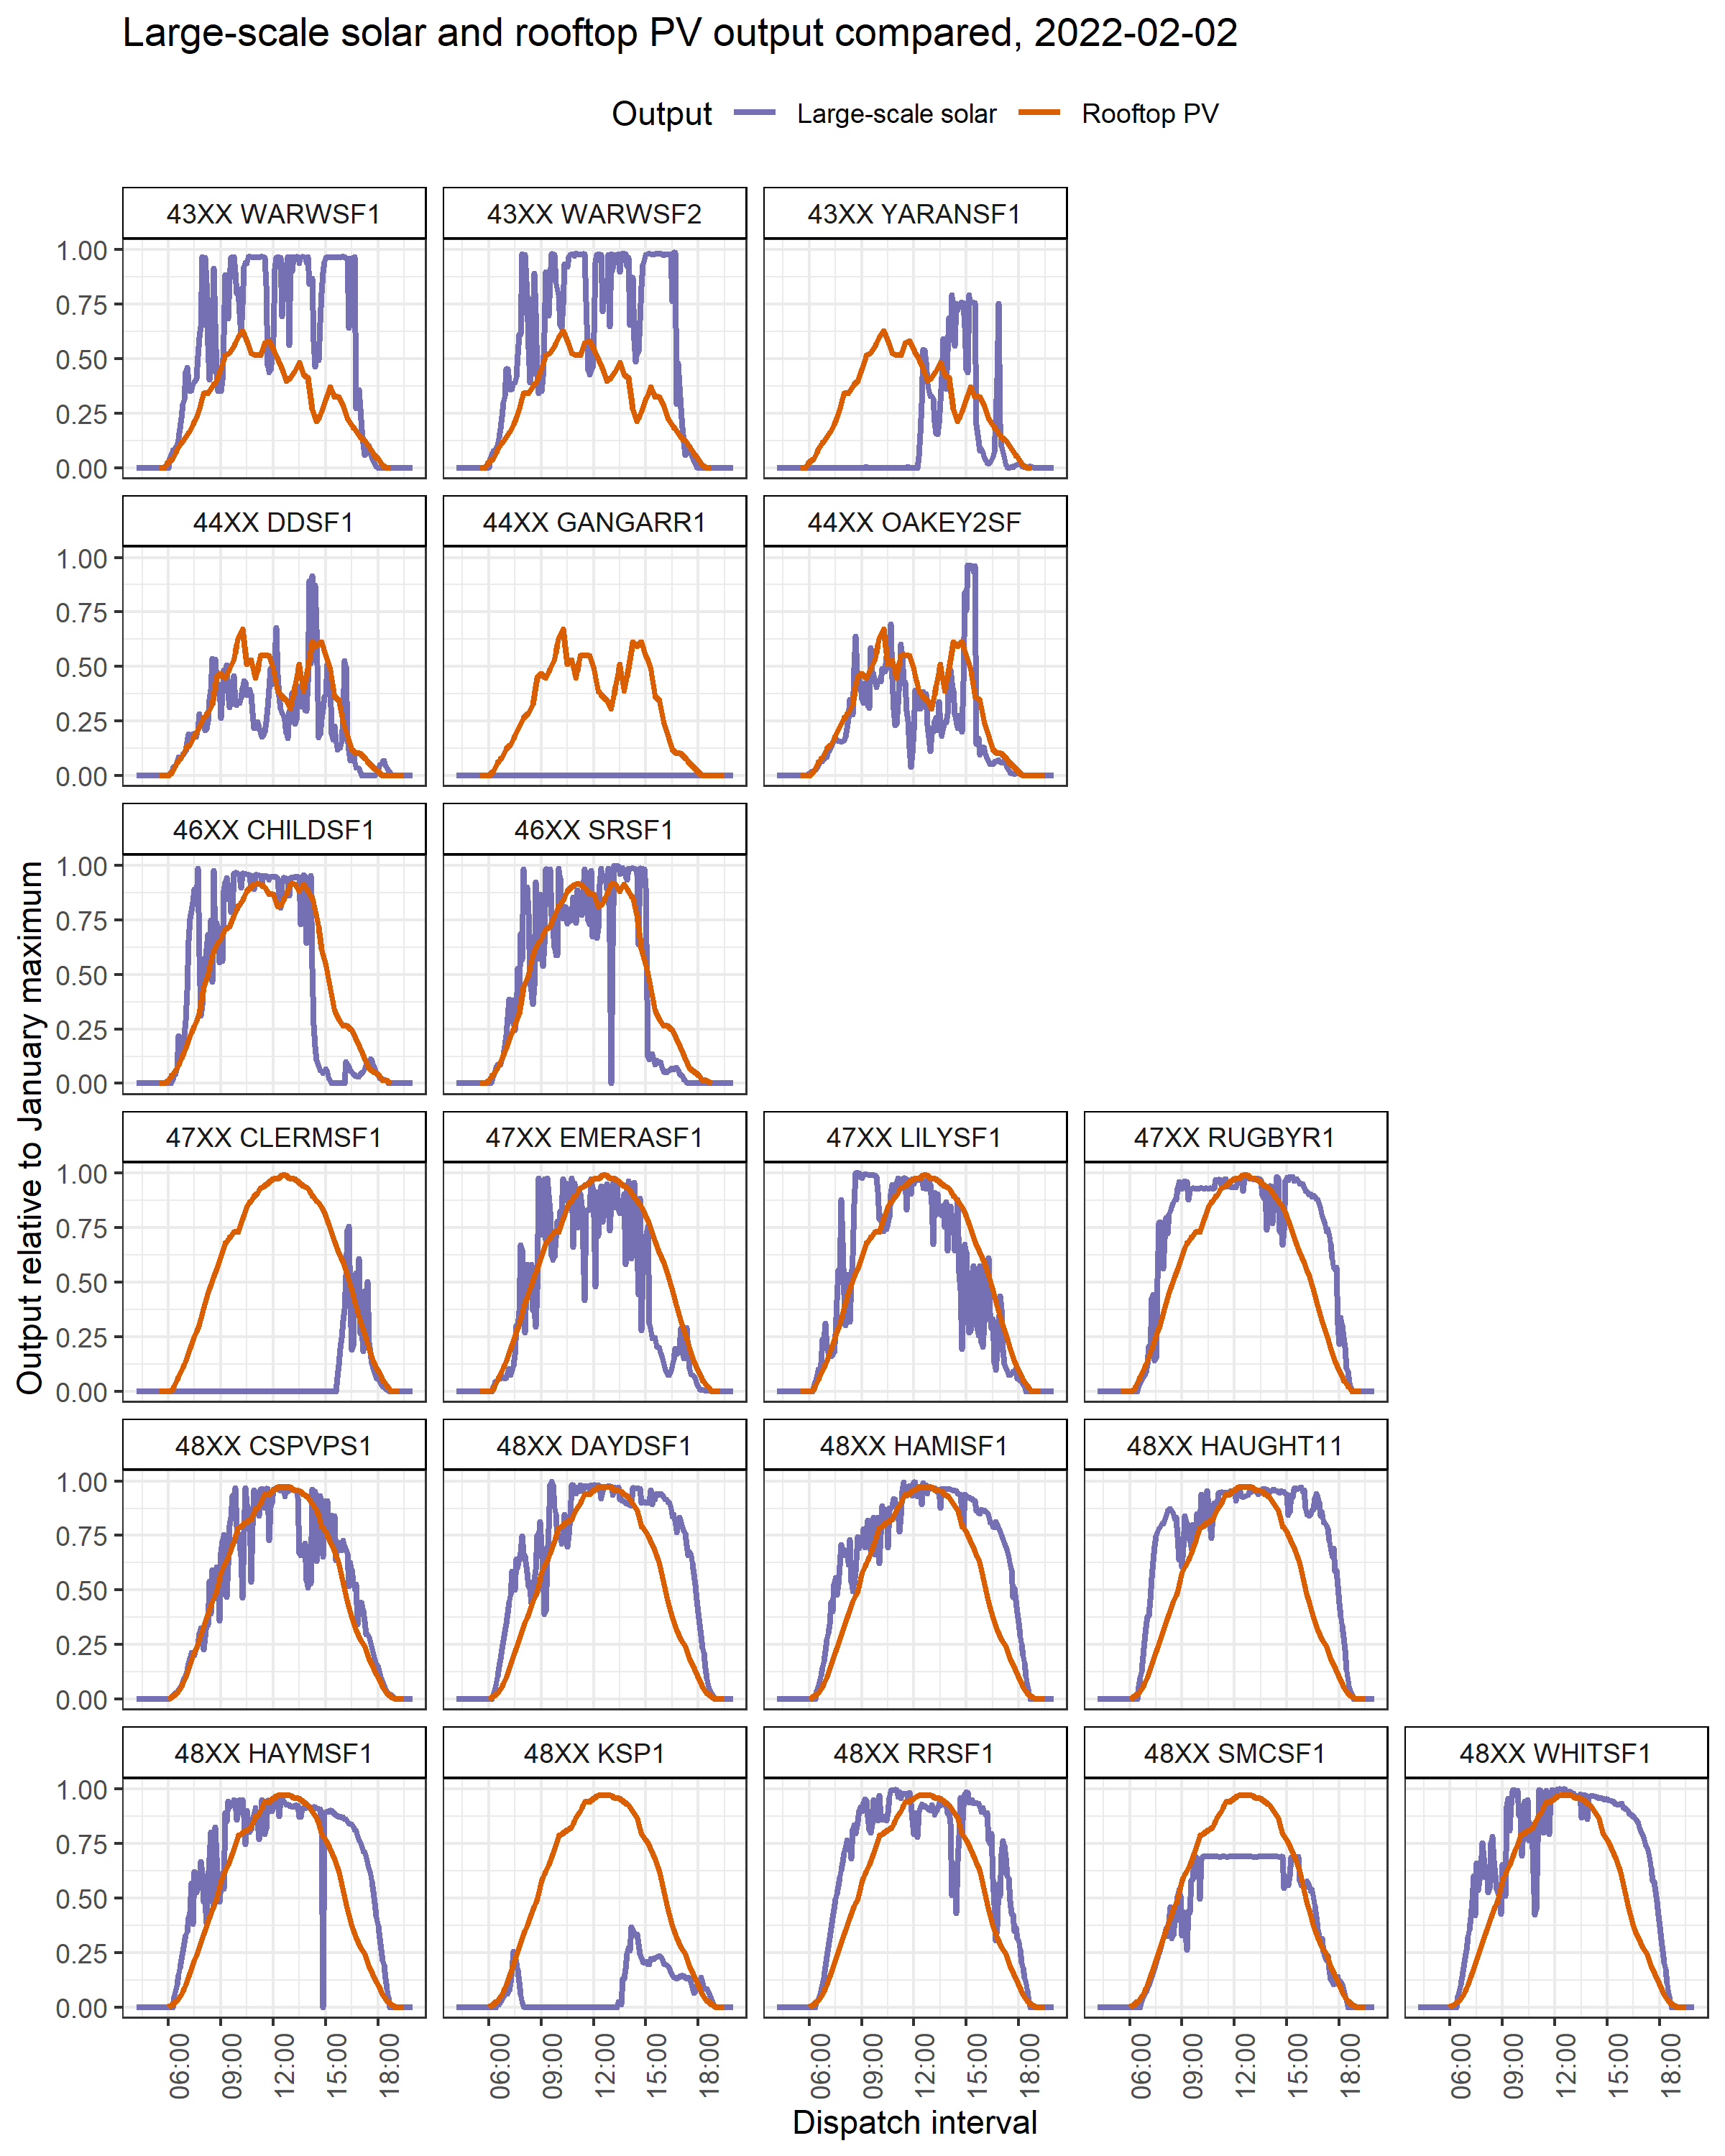
In the figure below, clear differences in the shape of the power output are visible, relative to rooftop PV. For example:
- WARWSF1 and WARWSF2 have single-axis tracking solar panels, meaning they can follow the angle of the sun by rotating east to west. Additionally the solar generator is oversized so that power output can reach maximum capacity earlier in the day and last at that level longer into the afternoon.
- DDSF1, on the other hand, has fixed panels and can be seen to more-closely resemble the profile of rooftop PV output. On this day clouds appear to have impacted DDSF1 to a greater extent that the region 44XX’s rooftop PV.
Output variability is greater than rooftop PV, which expected given how spatially distributed rooftop PV is. In the figure below variability features include:
- The impact of both dispatch instructions and constraints is seen at YARANSF1. It was limited by a semi-dispatch cap (limiting to 75% of capacity) and also experienced binding constraints that impacted output.
- Although not too far away from each other, CHILDSF1 and SRSF1 experienced different patterns of output. Afternoon variability at CHILDSF1 was not seen at SRSF1.
Wednesday 2nd February
The chart below captures the following features:
- Output at YARRANSF1 did not start until midday. Energy bids were 0 until midday.
- DDSF1 and OAKEY2SF were considerably impacted by clouds on Wednesday 2nd.
- GANGARR1 (still in commissioning phase) did not make any bids to supply energy.
- CHILDSF1 and SRSF1 experienced declines in output that were faster than the rooftop PV profile. Starting around 14:10 clouds led to near-zero output by 15:00. The cloud band impacting these sites can be seen in the Wednesday 15:00 satellite image, just to the north of region 45XX.
Assessment of discrete Rooftop PV output
We use Wednesday 2nd to take a look at individual rooftop PV site output. For this comparison the data is normalised relative to the level of installed capacity.
Rooftop PV output from 4 sites (a selection from more than 30, data courtesy Solar Analytics) is compared to the postcode region estimate in the figure below.
Conditions on Wednesday led to the strongest rooftop PV output variability of the first two days in February.
Generally, an individual site’s output reflected the magnitude and timing of the postcode region estimate closely, including the timing of the steepest declines.
The greatest variability, and differences from the postcode region estimates were seen around midday. Taking site 9 as an example, near midday the region estimate was 50% of capacity and yet the site’s output was reaching 75%. At site 14, output was relatively high compared to the postcode region estimate.
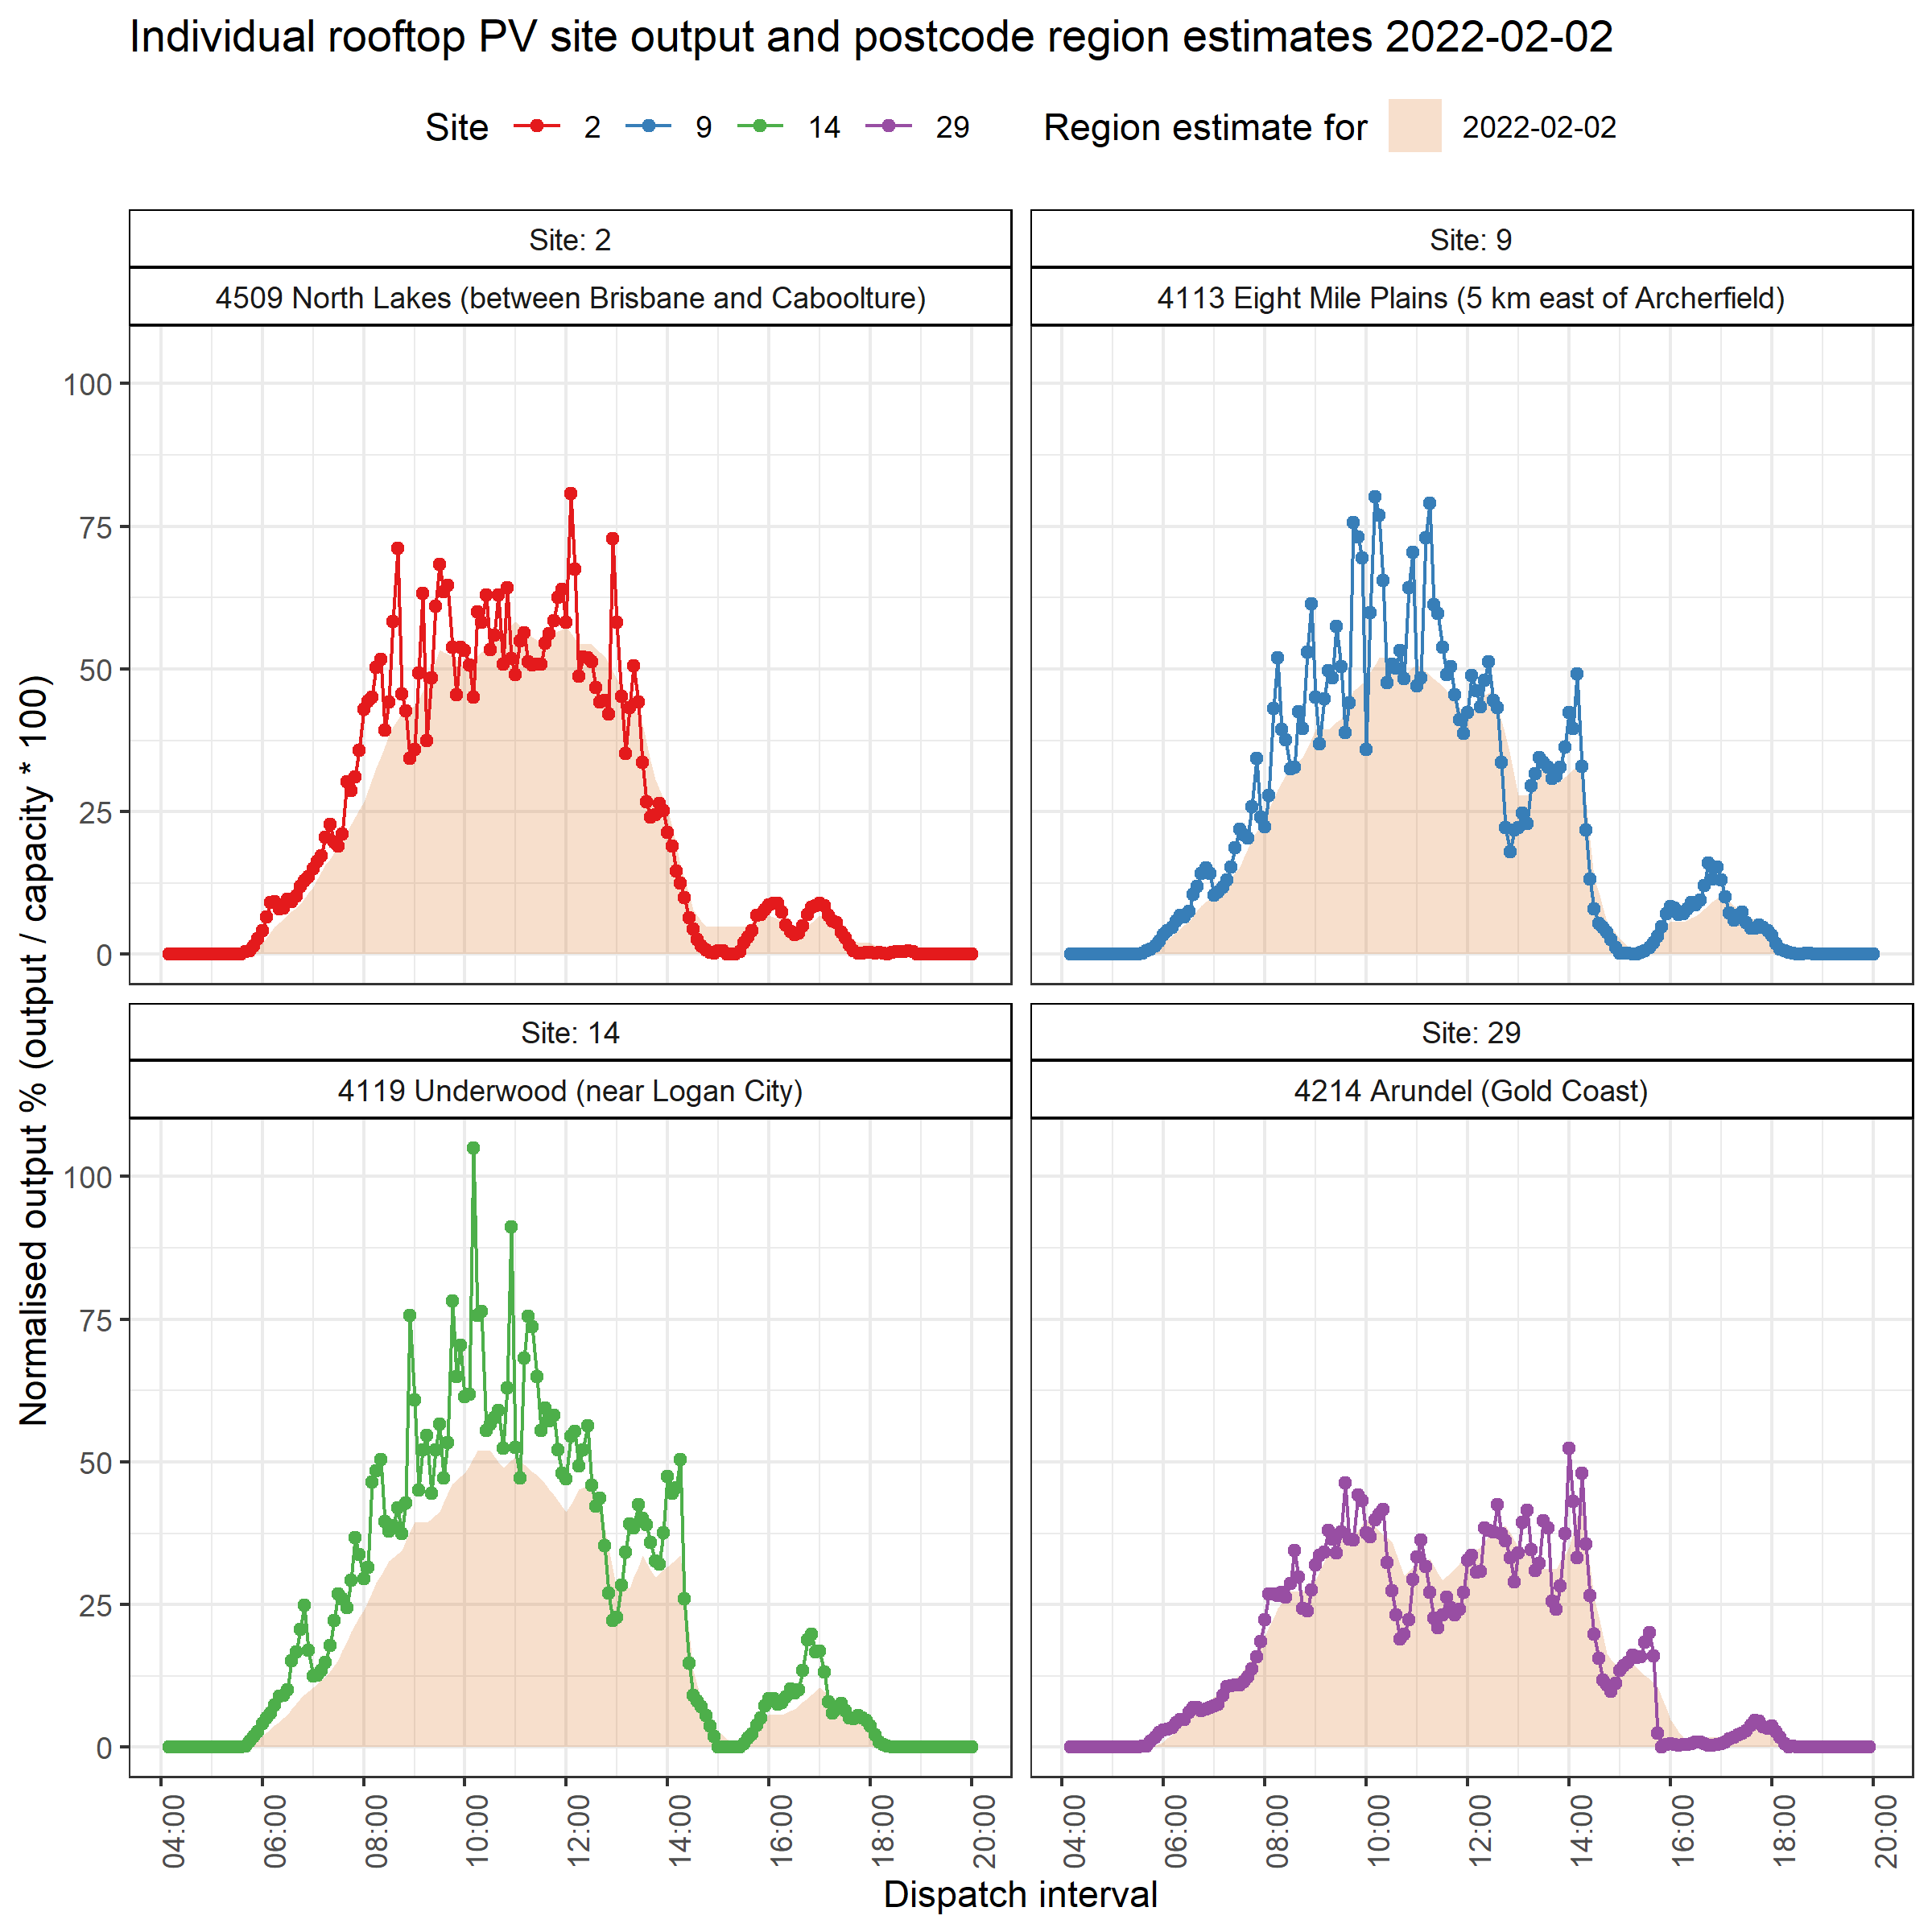
Observations from site-specific PV output (chart above):
- Site 2, 9 and 14’s output at 15:00 suggested they were effectively in the dark!
- Site 29’s output (Gold Coast) was low at 15:00 but not as heavily affected as regions to the north. Although, an hour later, around 16:00, clouds had thickened to bring its output to zero.
- Site 14’s highest datapoint is suspicious, values above 100 indicate output that is greater than the site’s maximum capacity.
- Both sites in region 41XX were impacted by the sudden increase in clouds at from 14:10 to 14:30. Output was reduced from 50% to around 10%.
- Between 14:10 and 14:30 heavy cloud impacts had extended to site 29 by the Gold Coast, although not as severe.
- Stronger clouds over the Gold Coast impacted site 29 between 15:40 and 15:45 (5 minutes). The postcode region-level output was estimated to experience a more-gradual decline, in the order of 30 minutes.
On Wednesday the 2nd individual rooftop PV site output varied from the zone estimate by 50% at times!
Findings
To recap, this assessment of sub-regional rooftop PV output on 1 and 2 February, 2022, has found:
- Individual PV sites was seen to vary by 50% in output level, relative to the 2-digit postcode region estimate. On Wednesday the 2nd, where cloud was widespread, individual site output and region estimates agreed well.
- Relative to maximum output, the output profile of rooftop PV is usually narrower than that of large-scale solar generators which are often oversized and have panels that track the sun to maximise yield.
- On Wednesday the 2nd, the Russ Christ effect appears to be a plausible reason why rooftop PV output dropped, yet temperatures (and demand) didn’t drop until 30 minutes later. Clouds appeared to move into Brisbane from Ipswich in the west on Wednesday.
- Clouds on Wednesday had reduced PV output to near-zero levels in the afternoon in the postcode regions around Brisbane, by 15:00 Under clear skies output at that time is usually more than 60% of the midday maximum.
- Cloud impacts on rooftop PV were less extensive on Tuesday 2nd due to the patchy nature of the clouds. Nevertheless there were localised impacts associated with storms, particularly around the Gold Coast and south Brisbane regions.
This is very interesting, I am wondering is there a part c where the possible solution to what is obviously a countrywide situation at certain times?
IS the speed of drop off capable of being forecasted and could it allow for an alternate power source?
Russ Christ effect, well at least cloud location compared to their shade, also depends on the height of the cloud and its thickness. I did some modelling and comparison to cloud on the Gold Coast and found it was extremely difficult to match cloud conditions based on satellite pictures to output of my PV system. Part of the problem was the low resolution and frequency of the satellite pictures. This was particularly the case when the cloud was broken into cells as distinct from a solid wall.
I did try using ground based photography of clouds, but the topography defeated me in this regard.