
This article was originally posted on EnergyByte. Reproduced here with permission.
The Price Shock experienced by the wholesale electricity market over the May to July period in QLD and NSW has been the biggest shock to the spot market in history, and the forward price movements are rivalling the record setting year of 2007. Meanwhile, the wholesale gas market has independently experienced a Price Shock in recent months with July setting a monthly record and ACCC netback forward prices fast approaching $20/GJ. We’ll look at the electricity and gas markets separately, beginning with electricity …
This article is an extract from our Monthly Report, which is available to subscribers with subscription plans found here.
Electricity Price Shock
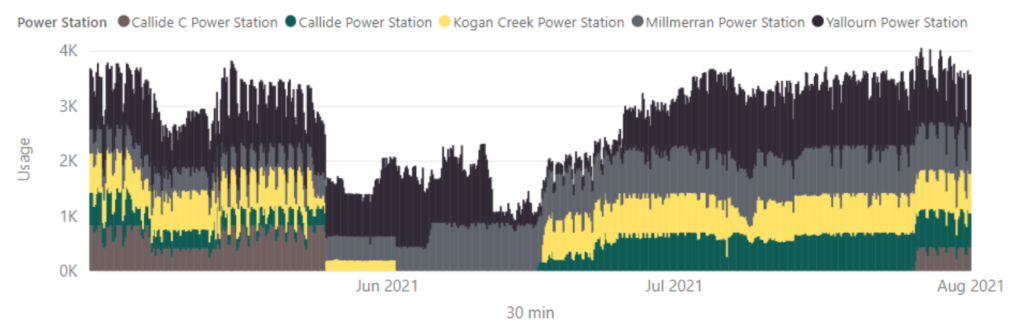
The month of May began with the threat of extreme prices helped along by cold weather driving demand, calm winds, and as the month progressed evening peak prices began to bite. On May 25, the Callide C catastrophic event occurred causing a tidal wave on the day followed by many after-shocks:
- An unrelated unit outage at Millmerran took until 5 June to return to service
- Following the Callide explosion, Kogan Creek did not return to service until 17 June
- After the explosion, Callide Power the older brother of Callide C, did not return to full service until 23 June
- Callide Unit 3 which was not directly caught in the explosion, did not return to service until 26 July
- the damaged Callide Unit 4 is not expected back until the end of 2022 creating a long-lasting after-shock
- and totally unrelated, Yallourn from VIC faced the risk of the mine flooding and was hampered from 11 June until 3 July
The graphic below shows the story of the impacted generation.
See original article for interactive charts.
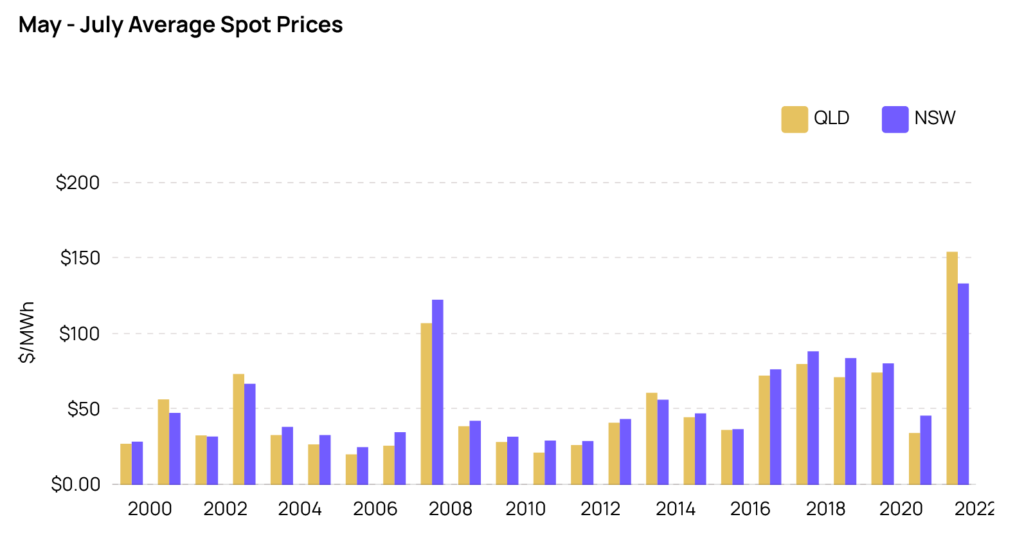
All of these factors have contributed to the biggest Price Shock to QLD and NSW spot prices over the 3-month period commencing 1 May in history.
See original article for interactive charts.
Looking at the shock to forward prices, 2007 had the largest shock in history when the coincident drought on the east coast of Australia struck leading to:
- hydro power stations water storages dropped to critical levels
- coal-fired plant across the NEM became very concerned about the availability of cooling water and changed operations to conserve water
- the Queensland government curtailed water supplies to water cooled coal-fired stations including Tarong which cut generation by 70%
- the air-cooled coal-fired Kogan Creek Power Station came online, but there was a net reduction in Queensland baseload capacity
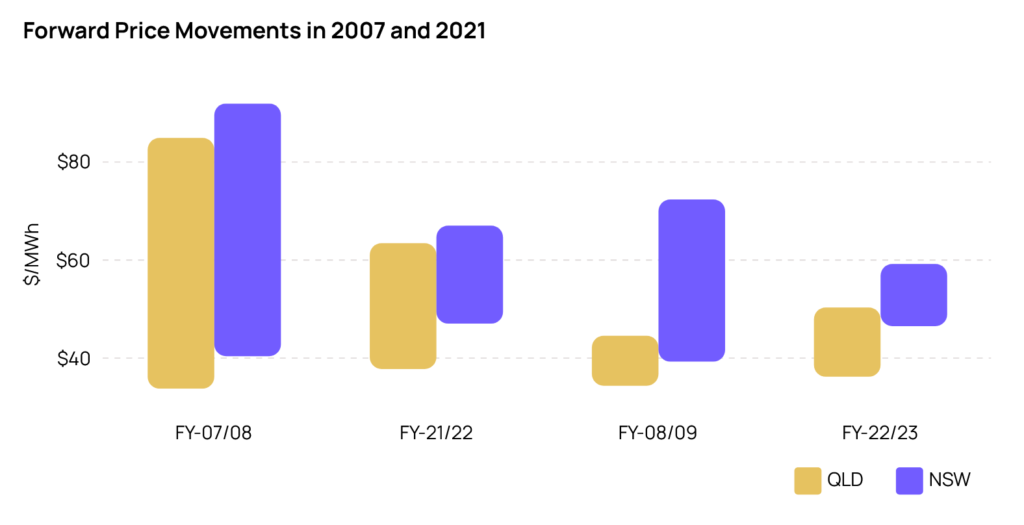
When comparing the record breaking 2007 to this year of 2021, Queensland and NSW’s next financial year had a far greater upward price movement in 2007 than 2021. In 2007, prices for 2007/08 started lower and escalated to much higher levels compared to FY-21/22 as shown in the chart below.
Looking at second financial year of FY-22/23 and FY-08/09, Queensland shock was greater in 2021 than 2007; although the shock to NSW’s second year was greater in 2007.
See original article for interactive charts.
Gas Price Shock
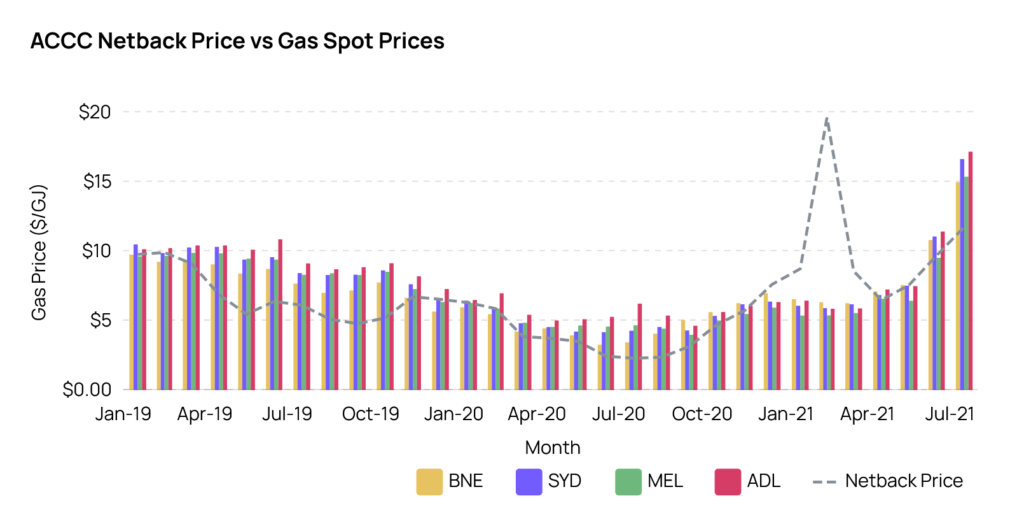
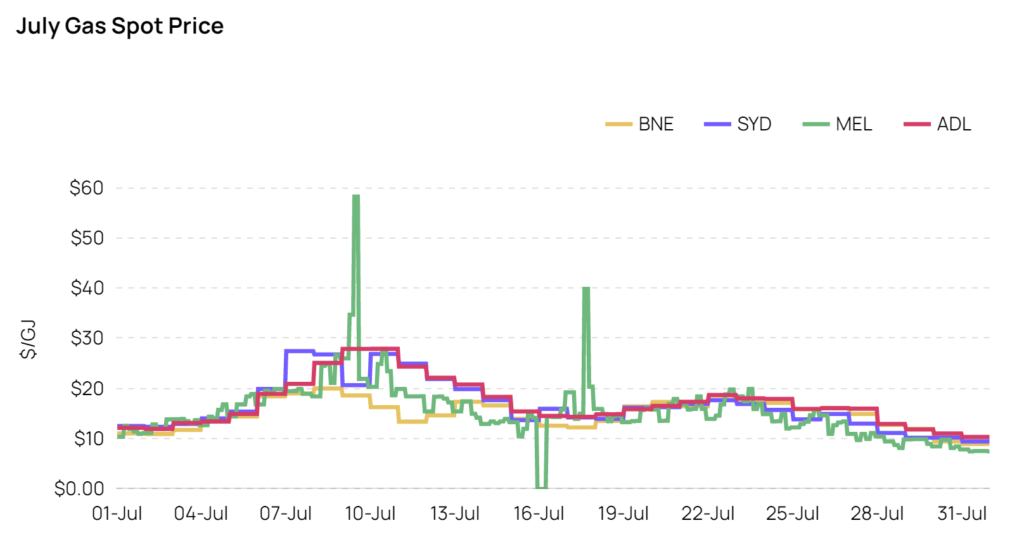
The Price Shock in the gas market has led to wholesale spot prices climbing from the beginning of the year, gathering momentum in Jun-21 when the monthly time weighted average prices passed $10/GJ, followed by about $15/GJ in July.
Domestic gas prices have been continually rising since April in the east coast of Australia, as has the ACCC Netback prices which is based on Asian gas prices and the Japan Korean Marker (JKM) as shown below.
By using the legend, you can focus on a single hub if you wish.
See original article for interactive charts.
During July, intraday gas hub prices surged to record levels with prices in the Victorian Declared Wholesale Gas Market (DWGM) almost hitting $60/GJ on Friday 9 July for 4 hours. The run-in gas prices was attributed to number of factors including: an outage at Victoria’s Longford gas plant, rapidly diminishing reserve gas and high domestic demand due to the cold weather.
See original article for interactive charts.
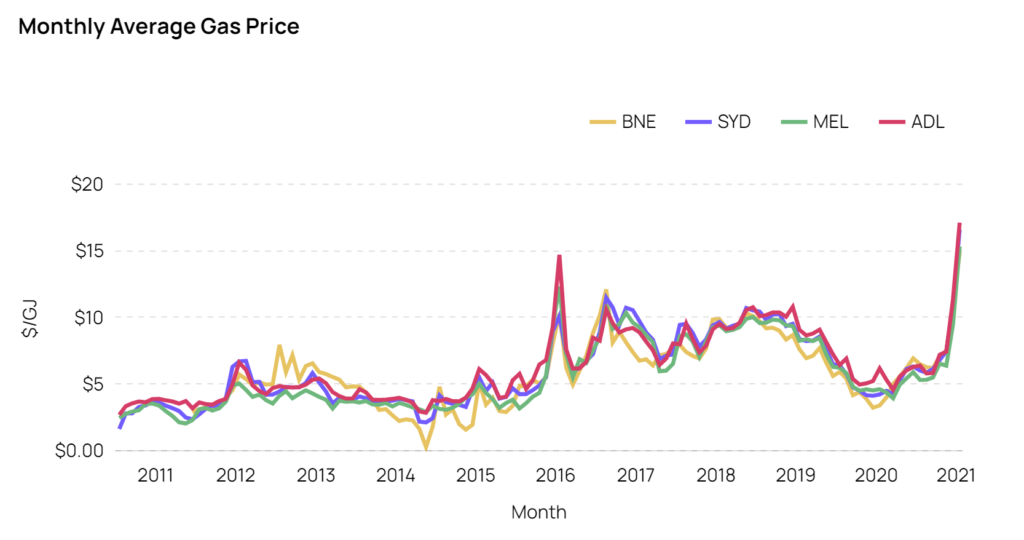
The month of July had the highest monthly time weighted average in history, with the hubs ranging between ADL at $17.16/GJ and BNE at $14.96/GJ:
See original article for interactive charts.
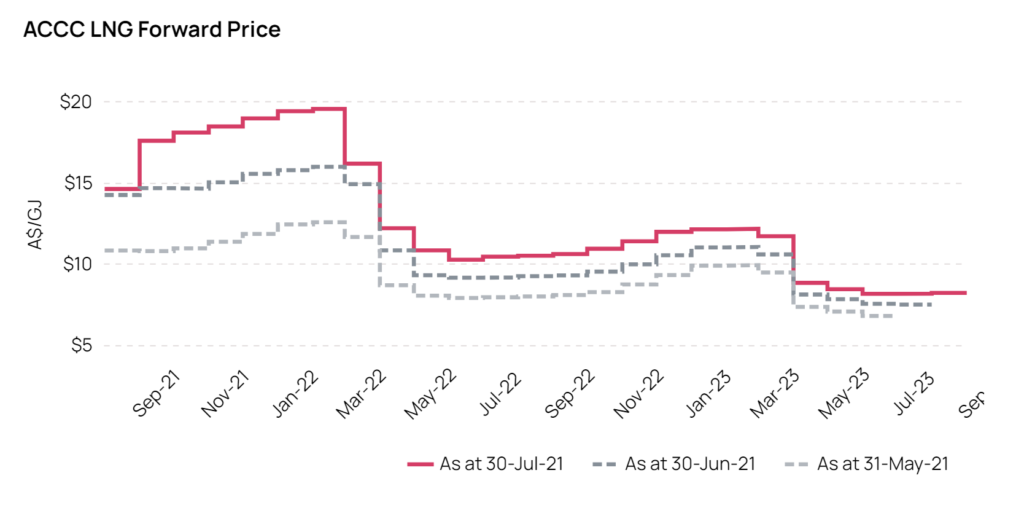
The LNG forward market is trending upwards particularly across the northern hemisphere summer, as can be seen in the recent end-of-month outlooks shown below.
Furthermore, the ACCC has announced that a supply shortfall in the Australian east coast gas market is becoming increasingly likely. The ACCC report showed that east coast supply in 2022 will be very tight, with a shortfall expected in the southern states of about 2PJs. It was noted:
- the forecast is dependent upon demand from gas powered generators decreasing to record lows, and a material volume of gas from currently undeveloped reserves being supplied
- less offers are being presented by suppliers for 2022 and prices have risen to $9 to $10/GJ, possibly partially caused by uncertainty around the Gas Code of Conduct and the ACCC’s LNG netback price series review
————————————–
About our Guest Author
 |
Carl is a co-founder of SavvyPlus and Empower Analytics with over 25 years of experience in energy market analytics, with key skills in mathematical modelling and risk management.
You can find Carl on LinkedIn here. |
Some great charts there Carl – thanks!