
This article was originally posted on EnergyByte. Reproduced here with permission.
It was a hard day at the office on Friday 12 March when SA experienced extreme spot prices, but Big Batteries were not able to fully capitalise.
Frequent readers at WattClarity will recognise that a number of other pieces of analysis have already been provided, looking into various aspects of what happened on Friday 12th March 2021 in South Australia – all tagged into this category here – including Paul’s ‘What seems to have happened’ on 13th March and Allan’s ‘Down 55$% – but not out’ on 15th March. We saw Carl’s article, and thought it would be a good addition to the insights revealed from this event.
.
However, Big Batteries stand to receive a big boost when wholesale settlement rules change and extreme days occur, causing a significant wealth transfer favouring fast start generation. We unpack what happened and what are the implications?
Key Findings
Looking into the events of Friday 12 March in SA there are key findings and lessons arising. In our previous article “SA the yellow canary …again”, we provided our first pass of the events, and now we assess the Big Batteries given they are becoming more critical, and new wholesale settlement rules which are designed to suit such technologies, becomes effective on 1 October. These are our findings:
- managing battery energy storage systems is complex and is made more difficult because of uncertain future prices for energy and frequency control ancillary services (FCAS)
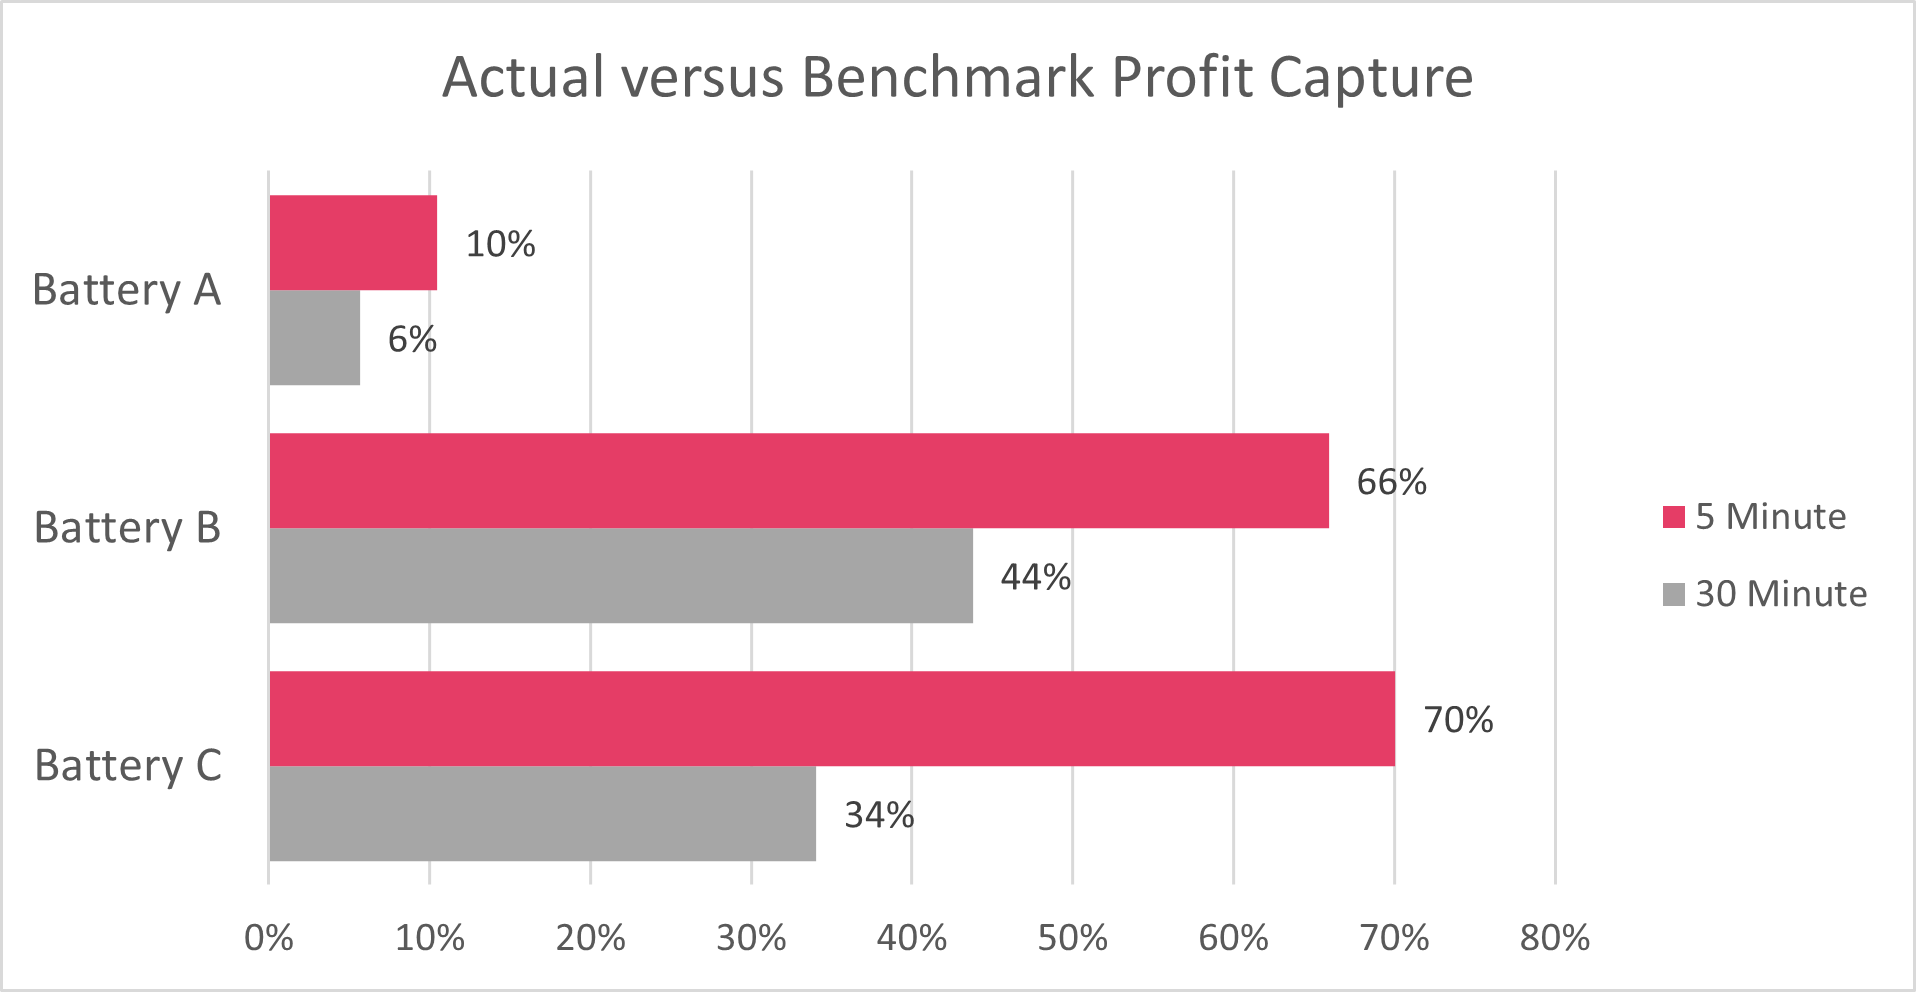
- the performance of the 3 battery assets varied considerably during this eventful day, ranging from extracting 44% to 7% of the theoretical maximum energy arbitrage profit; noting this finding is based on only using the battery energy capacity, and not the capacity offered for FCAS
- if 5-minute wholesale settlement was applicable, then the performance measured against the theoretical maximum energy arbitrage profit for each battery would have improved to 70% in the best case, through to 10% in the worst case
- based on this event, we wonder whether the current battery dispatch algorithms are designed to maximise the profit for 5-minute wholesale settlement, despite 30-minute settlement being the current procedure creating a missed opportunity. It might be subtle, but the solutions are different and lead to different profit outcomes. We also wonder whether the algorithms risk-adjust the deployment strategies?
- when 5-minute settlement becomes effective on 1 October 2021, if events like this one observed in SA are repeated, then we will experience a massive wealth transfer in favour of fast-start plant. In this example, for the same daily average price, we determined that the battery players arbitrage profits would have trebled
- the market needs fast start plant like batteries to perform well, and by doing so will enable more risk management services to be offered and performed, as well as contribute to the management of the grid particularly when under stress
- if the battery energy storage systems cannot perform well, then the cries for more dispatchable plant, deep storage systems and big interconnectors will increase in frequency and volume. If these alternatives are pursued alongside batteries, the cost to the industry will increase and be less efficient, impacting investor financial returns. Consumers will probably pay more through higher regulated costs and market prices will try to be elevated despite more competition.
- we hope this piece of analysis is helpful to improve the understanding and challenges facing the market
1.0 Introduction
Batteries have a complex role as they can be deployed for many services, such as:
- frequency control ancillary services (FCAS)
- providing services to strengthen the grid and improve reliability within the network
- enhancing the transfer capability of an interconnector
- managing causer pay ancillary costs by co-sharing a site with an intermittent wind farm or solar farm
- firming an intermittent generator so that a financial hedging product can be offered with more effective risk management
Despite these multi-prong roles, it is fair to say that these assets are relied upon in system planning to contribute towards ameliorating predicted energy shortfalls (evident by higher prices), as well as ensuring system resilience. For these reasons, it was considered worthwhile to check the utilisation of these assets to help us understand the practical aspects of deploying a battery energy storage system.
Our analysis focuses on the lessons that can be learnt, rather than critiquing each market participant’s commercial performance. Consequently, we have masked each asset so we can focus on the learnings.
2.0 Our Analysis
On Friday 12 March in South Australia, 3 different utility scale batteries operated when 3 runs of extreme prices occurred between 5:30pm and 1:00am the next day. We begin by discussing the deployment of each of the 3 batteries; labelled as A, B and C.
For each case we discuss the battery discharging and charging behaviours alongside the 5-minute spot prices, and in our analysis we have:
- recognised that each battery has different capacity limits (MW) and energy limits (MWh)
- noted during the day all batteries were offering energy arbitrage capacity and FCAS capacity, and given our analysis is focussed on the energy arbitrage market, we therefore reset the battery capacity equal to the maximum capacity offered for energy arbitrage only
- estimated the actual energy arbitrage profit using the current 30-minute wholesale settlement rules, and then we re-calculated the profit using the 5-minute wholesale settlement rules which will become effective on 1 October
- compared the battery arbitrage profit against our Benchmark using both 30-minute and 5-minute settlement rules
- defined the Benchmark as the maximum possible energy arbitrage profit given the reset battery capacity and energy limit assuming an unlimited number of cycles is allowed, no minimum arbitrage value and 20% round-trip losses. Our Benchmark is aspirational because we have the benefit of perfect knowledge when optimising the battery activity. However, the question is, “How close?”
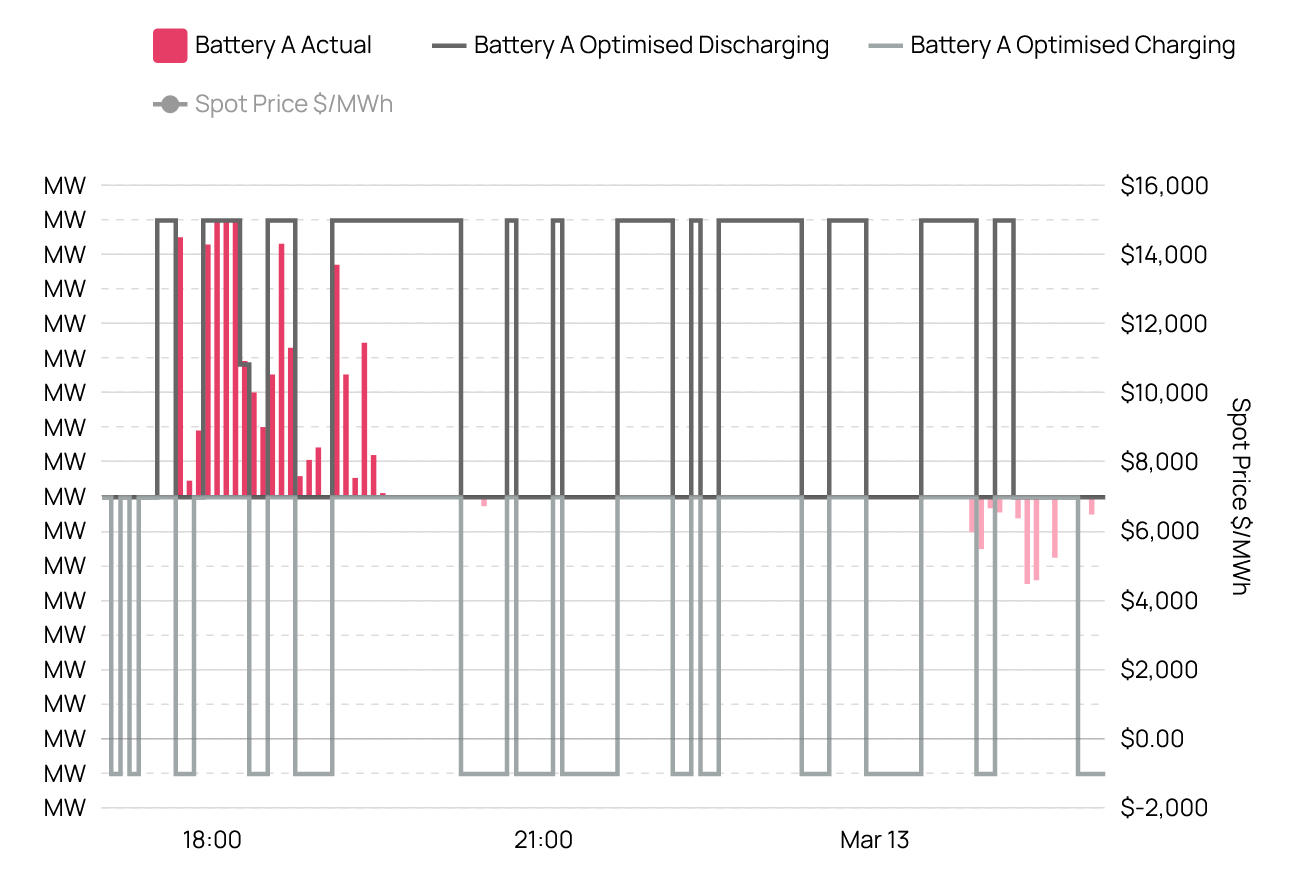
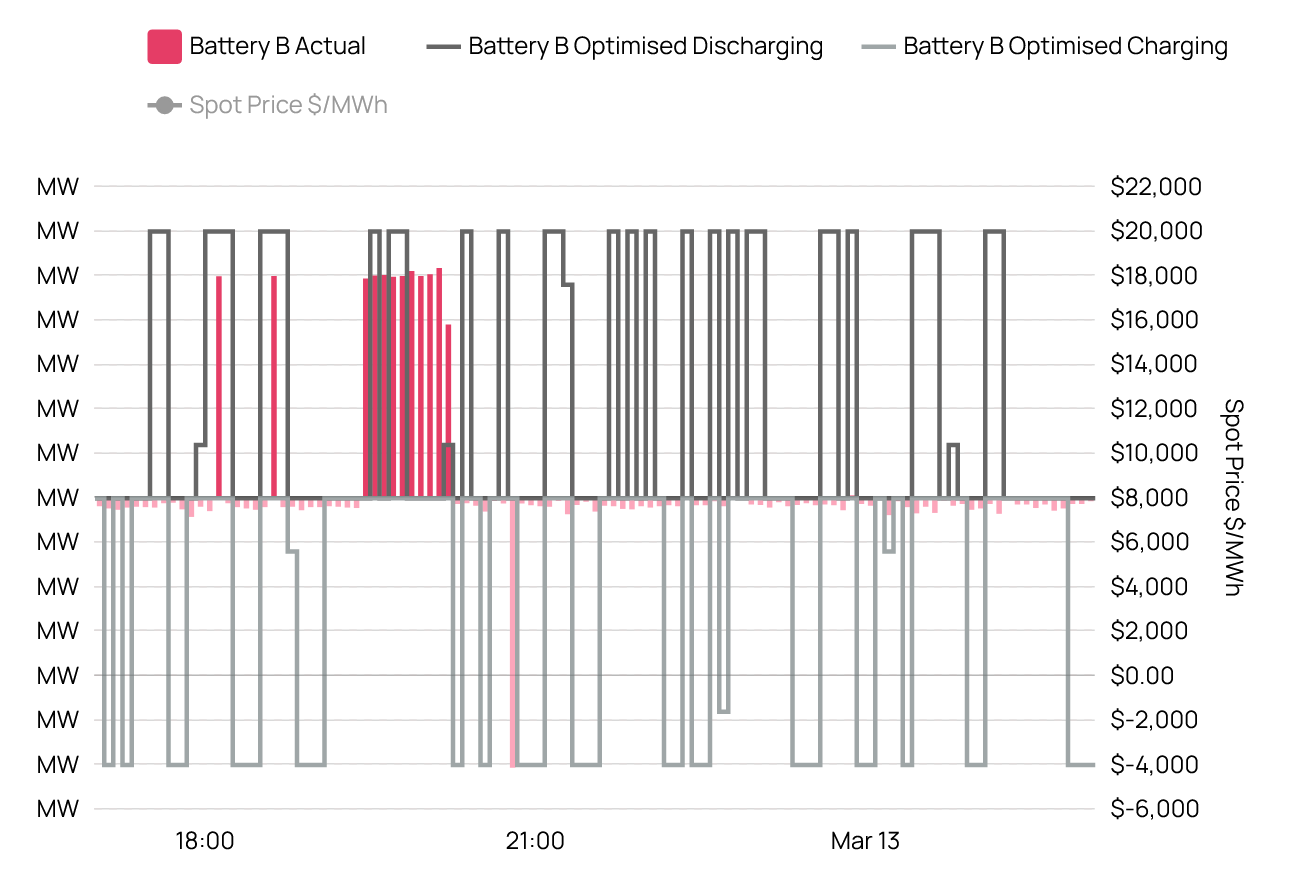
We discuss each battery separately and there is an accompanying graphic for each battery illustrating the charging and discharging activity where a positive MW value reflects discharging, and negative MW reflects charging. The spot price is shown on the right hand side axis as a line. For ease of reading, the dot points listed below are also noted on the graphic.
Our observations are …
2.1 Battery A
The highlights for Battery A are:
- Battery A took off at the first sign of higher than normal spot prices, and hung-on even though spot prices relaxed.
- By the time the first run of extreme prices occurred, the battery arbitrage capacity was exhausted – a big missed opportunity.
- Following the first run of extreme spot prices (i.e. prices near $15,000/MWh for 50-minutes), the battery never recharged to prepare for any further possible opportunity. As it transpired, two other extreme spot price runs were to eventuate. A missed opportunity.
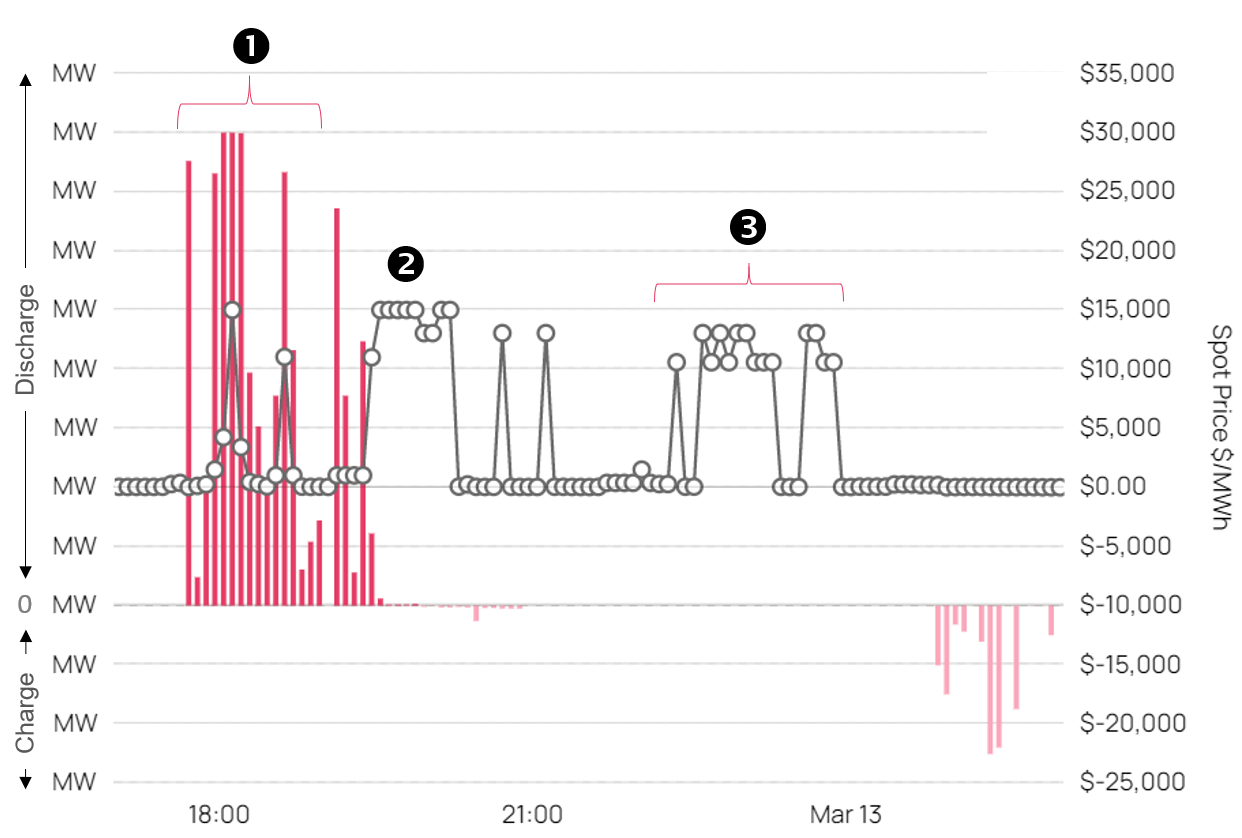
The following chart is a bit busy, but compares the optimal dispatch and charging using perfect knowledge for Battery A with the actual activity. If you wish, you can select spot prices from the legend to add the prices to the chart. You can also swipe these charts to zoom in, and then click the minus sign to return.
It can also be noted that there is a small charge during all hours, which is the parasitic load for cooling of the batteries and site lighting etc. Also, the optimised solution was found for the whole day, and therefore the battery had an initial charge at 5:00pm when the chart begins.
2.2 Battery B
Battery B performed much better.
- The day started to plan when unlike Battery A, they waited until the two islanded spikes occurred ($15,000 and and then $11,000/MWh), which was a perfect strategy.
- When the first run of extreme prices occurred, the battery discharged to perfection throughout the balance of the first spot price extreme run until both the battery and the prices ran out of steam. The battery switched capacity from FCAS during this run to maintain the energy discharge level. It was a good start to the day.
- After this point, the battery did not re-charge sufficiently to tackle the following two extreme price runs. Clearly, a missed opportunity. Perhaps there was a hard warranty limit on the number of cycles per day?
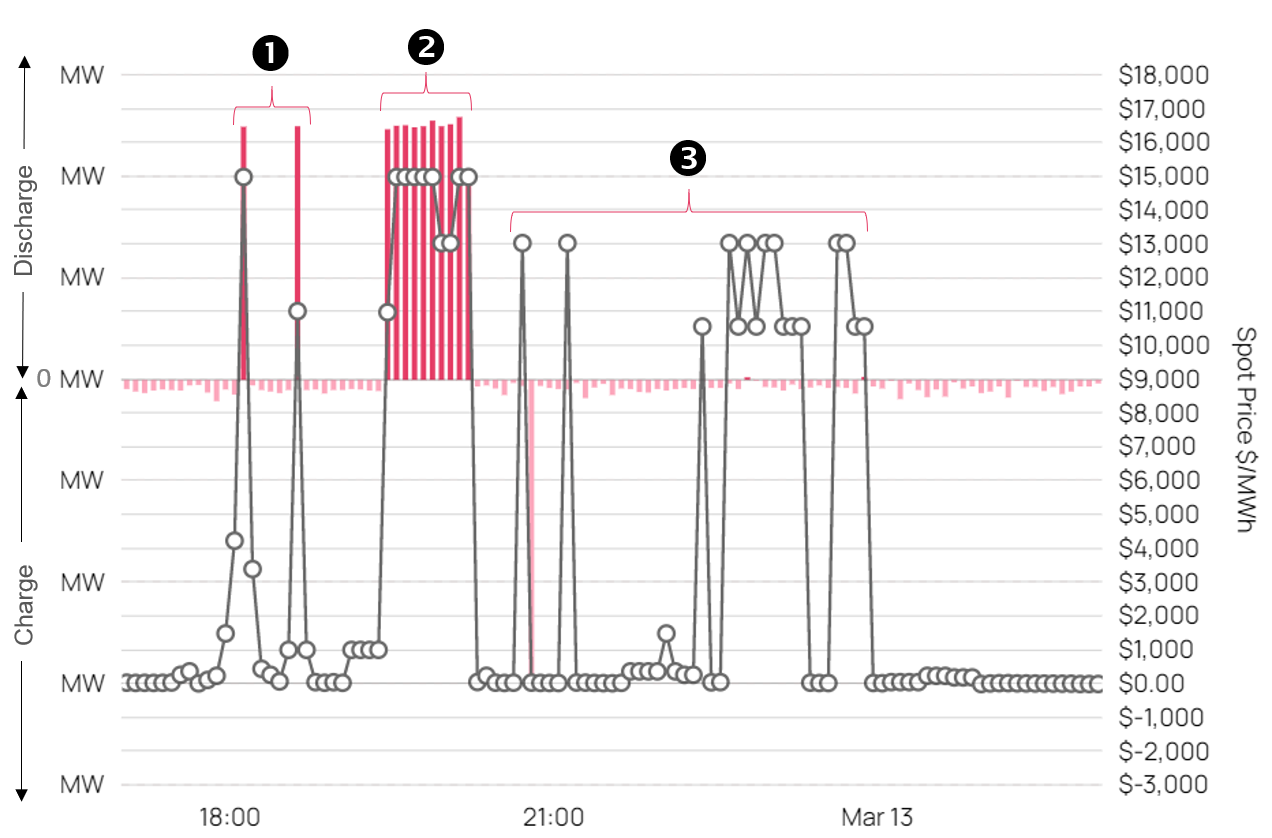
The following chart shows the optimal dispatch and once again if you wish you can select Spot Price from the legend to add to the chart. Once again, the optimised solution was developed for the whole day, and therefore the battery had an initial charge at 5:00pm when the chart begins.
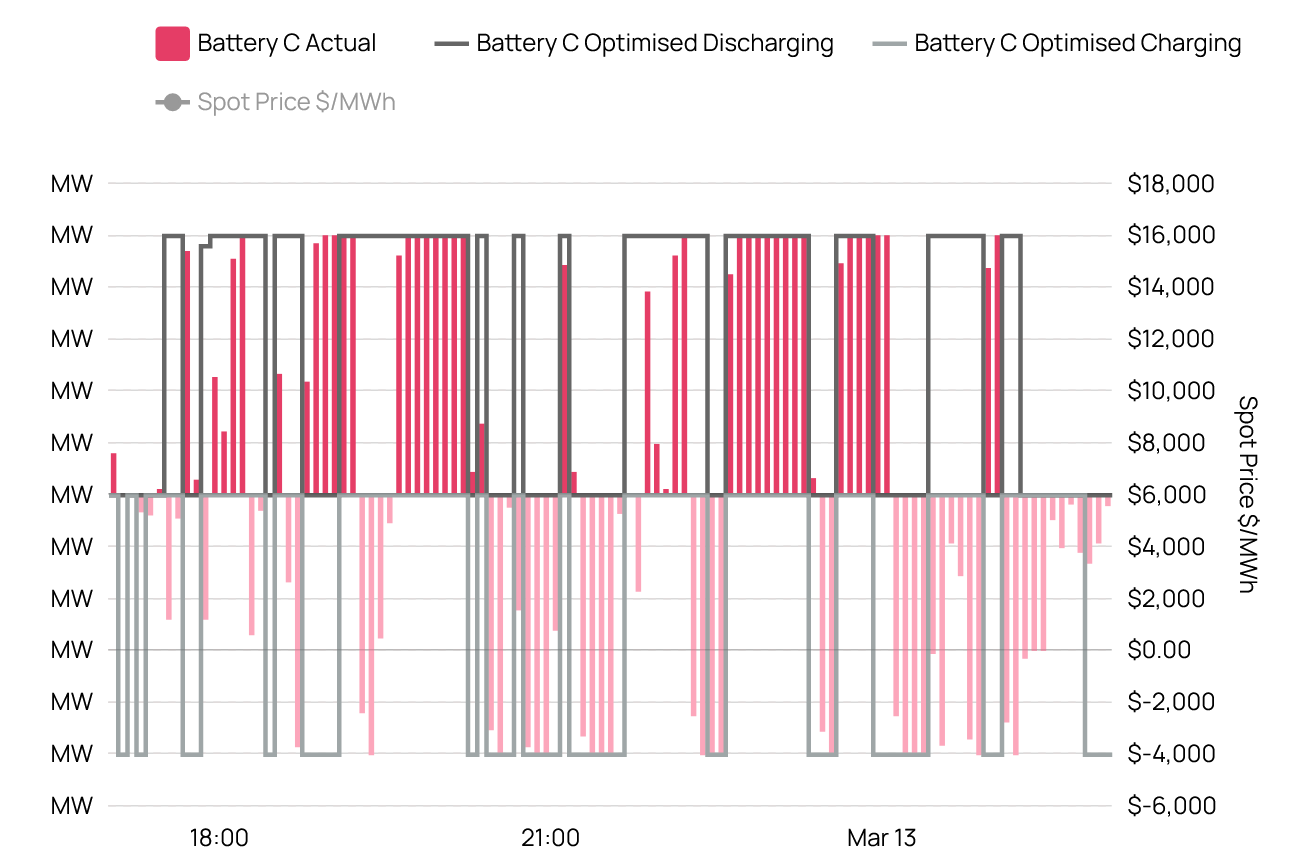
2.3 Battery C
Battery C was the most active of the 3 assets, aggressively cycling the battery.
- Prior to the first extreme price run when the first two islanded spikes occurred, the battery was discharged on the first spike, but was caught charging on the second spike. A discharge run was then activated for modest returns.
- Following the early round of activity, the battery began re-charging for the next 20-minutes and by doing so was caught charging when prices moved from $1,000/MWh to $15,000/MWh. Although they did ramp down the charging through this period as prices increased. However, in the energy arbitrage game, charging at a weighted average of $3,800/MWh is fine, if you can sell at $15,000/MWh which is what occurred.
- It then switched to discharge during the balance of the first extreme price run, smiling all the way. They hung-on for another 10 minutes at reduced capacity and then began re-charging in the same 30-minute period which was not optimal. At this point, they let FCAS go, in order to offer greater energy arbitrage capacity. A smart commercial move.
- After the main and first run passed, the battery worked hard to re-charge the battery at the best times, to be ready just in chase.
- It did however get caught half charging during a $13,000/MWh island spike, but then managed to fully discharge on the next island spike at the same price level. It then discharged at modest prices (circa $300/MWh), and once again got caught charging at $10,500/MWh, but was able to sell later at $15,000/MWh, thereby completing a successful arbitrage.
- Having re-charged, they were able to discharge during the second and third extreme price runs, bringing joy to the profit line. Between the two extreme price events, they did charge at low 5-minute prices, which would have adversely affected the 30-minute settlement of the second extreme price run. On the third extreme price run, they did continue to fully discharge at the end of the run for the last two 5-minute periods in the same half hour even though spot prices fell to around $30/MWh, which would have maximised the 30-minute settlement payment.
- To wrap-up the successful day, they pushed to recharge in preparation for any other possible future events finishing a good day in the office
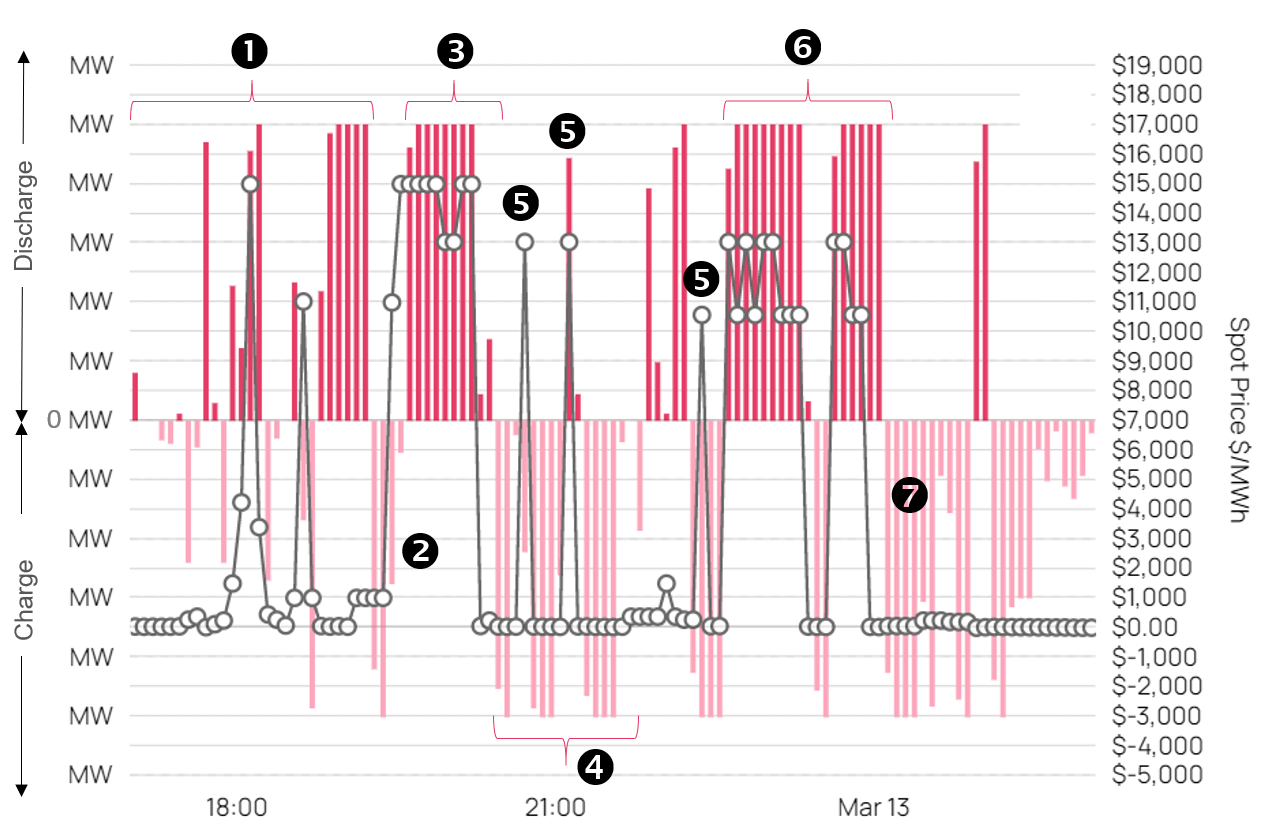
Finally, the optimal dispatch for Battery C is shown below. Once again, the optimised solution was developed for the whole day, and therefore the battery had an initial charge at 5:00pm when the chart begins. You can also swipe these charts to zoom in.
3.0 Benchmark Performance
The performance of the batteries against the aspirational Benchmark using 30-minute settlement was measured. The best performer was Battery B at 44% of the maximum theoretical energy arbitrage profit, although they diverted more energy from FCAS during the first extreme spot price run, which artificially increased their performance measurement. Battery C followed with 34% and Battery A at 7% of the maximum theoretical energy arbitrage profit.
If 5-minute settlement was operational then all batteries would have performed better, with an impressive 70% for Battery C and 66% for Battery B while 10% for Battery A. This finding supports the observation that the batteries optimisation algorithm appear to be based on 5-minute settlement, and not 30-minute.
The consequences of Battery A exhausting the available energy arbitrage market capacity prior to the 3 extreme spot runs for a modest gain and then not re-charge, had a costly impact on the performance. Battery B performed better, but did not recharge the battery to participate in the second and third extreme spot price runs. Meanwhile Battery C worked the battery hard by actively charging and discharging and diverted FCAS capacity to the more rewarding energy arbitrage market.
This findings are:
- it is a difficult job maximising the commercial value of deploying shallow storage devices when future prices are uncertain for a multitude of services and constraints apply
- if this event is a reliable indicator, there is scope for some players to improve the optimisation algorithms and strategic management of these assets
- this event does raises the question whether the current optimisation algorithms are solving for 5-minute settlement, rather than 30-minute settlement which is sub-optimal under current settlement procedures
- the algorithms may not be risk-adjusting, which is the common technique we deploy when developing hedging strategies in an uncertain environment
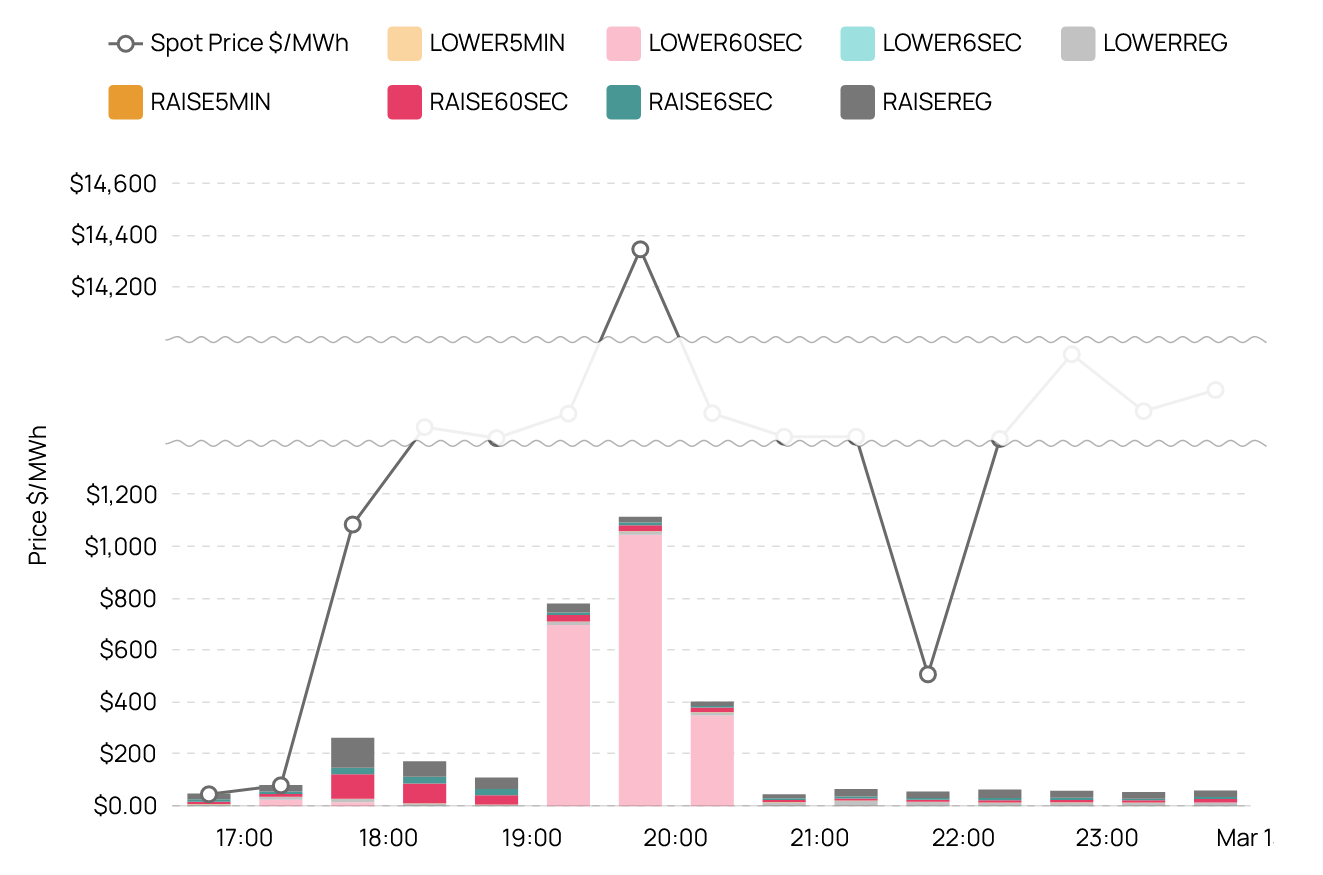
4.0 FCAS Co-optimisation
In case you are wondering whether the batteries were co-optimising between the energy arbitrage market and the FCAS market, you can see from the chart below that FCAS prices where much lower than energy prices. The Lower 60 second FCAS had the highest value and this service is for stabilising the frequency following a major rise in frequency.
In terms of commercial value, the energy market dominated this event, and therefore was the dominant value proposition.
5.0 Wholesale Settlement
The current wholesale 30-minute settlement averages the six 5-minute periods for each half hour with the averaging applied to the spot price and the generation. Consequently, if a single 5-minute period is missed, then the generator has a chance to begin operations during the same 30-minute window and therefore capture some value of a price spike that may have passed.
The chart below compares the change in profit that each battery would have earnt under the new 5-minute wholesale settlement due to become effective on 1 October later this year. It is good news for batteries, as in this example Battery A and C would have earnt more than 2.7 times their profit, while Battery C would have increased their profit by more than 3.2 times.
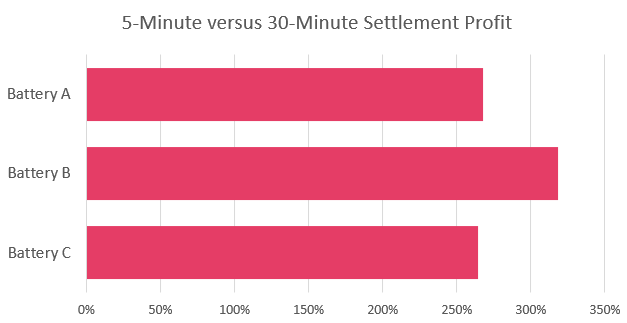
The cause of the material change in profit is that the 5-minutes price events were scattered amongst many half hours, and therefore were dampened by the averaging process associated with 30-minute settlement.
In this event, there were 45 occurrences of 5-minute prices exceeding $300/MWh but only 3 half hours had price spikes for six consecutive 5-minute periods. A further 10 half hours were impacted by between 1 and 4 occurrences of 5-minute prices exceeding $300/MWh. Consequently, in future events like this case in SA, the market will experience a dramatic change in the allocation of spot market revenues.
If this event is typical of future extreme days, on these occasions the market is facing a significant wealth transfer between the generation sector when 5-minute settlement is introduced.
On extreme price days, fast start plant like batteries will substantially increase their revenues and profits; while slower technology generation that may have ramped-up during the same half-hour but not been generating at the critical 5-minute period, will stand to lose substantial revenue.
The introduction of 5-minute settlement was approved by the AEMC in the belief that prices would soften, and so if this right, then customers will also be a beneficiary.
6.0 Conclusion
Our conclusions are:
- deciding whether to dispatch, charge or wait to deploy a shallow storage asset is not easy, as predispatch prices are not certain. It therefore converts the challenge to a risk-adjusted optimisation with a view to the future as well as real-time price events. We apply a similar concept for developing optimised risk-adjusted hedging strategies
- if this example is typical for Big Batteries, there appears room for improvement in some of the battery charging and discharging algorithms or perhaps more flexible manufacturer warranties with regard to the number of cyles; and better predispatch signals would be helpful
- Big Batteries face the challenge of being a significant contributor during the most stressful periods of the grid; otherwise the cry for deeper storage, more dispatchable plant and bigger (or new) interconnectors will be heard louder across the land. Such an outcome will create more competition for the Big Battery sector, squeeze wholesale profits and create more cost to the industry. These costs will then be attempted to be forced onto consumers either through higher regulated costs or higher market prices
- the introduction of 5-minute settlement will reward those assets that are dispatched at the appointed time which should lead to smarter management of the assets. Fast start plant like Big Batteries, stand to benefit; but there may be a massive wealth transfer which will cause ripples in the industry
- The current 30-minute settlement is more forgiving and can mask poor performance
Our objective in highlighting this working example is to encourage learning and to draw-out market issues; and not for the purpose of critiquing any participant’s commercial asset management. After all, there may have been other commercial drivers at play, which are not publicly known. We hope we have achieved our goal.
————————————–
About our Guest Author
 |
Carl is a co-founder of SavvyPlus and Empower Analytics with over 25 years of experience in energy market analytics, with key skills in mathematical modelling and risk management.
You can find Carl on LinkedIn here. |
Is this just a case of having 20/20 hindsight now, but not having it at the time? i.e. actual charge/discharge will never be perfect to maximise price arbitrage and you will always get caught out simply through not being able to predict future events perfectly (i.e. who’s the marginal generator, who’s next, who’s holding back capacity, credible contingency events which appear out of nowhere, non-credible events more so, demand forecasting errors due to e.g. cloud cover etc., etc.)……. of course post event you can go back and dissect what happened and perhaps build up a library of better responses, but it will never be perfect simply because the future, even the near future, is to always some extent, unknown……
Also, are these battery responses somewhat influenced by what contracts they have in place and what is being played at any given time by the owners/retailers to meet e.g. some contracted obligation? Or are all batteries, as the article suggests, simply working in the spot market maximising arbitrage opportunities (i.e. in the visible part of the NEM)?
Also, how many batteries (in MW and Mwh) can connect before they eat their own lunch? i.e. before they remove the spot price highs and lows so effectively, they remove their main source of income. And how much influence will shifting domestic loads (e.g. pool pumps, air-conditioning, EV charging etc.) have in this space (reducing the requirement for storage) noting this is also happening at the same time as batteries are being rolled out.
Superb article Carl; some non-trivial optimisation problems in there!
“Prediction is difficult particularly of the future” Neils Bohr
It’s interesting to think about lower FCAS as an “opportunity cost” to a generator i.e. getting paid for FCAS means not getting paid for energy. For batteries, things look a little better, given the energy constraint. Another big question is how different bid stacks of larger generators, and thus dispatch price outcomes will be under 5 minute settlement.