
This article by David Leitch & Ben Willacy was originally posted on the ITK Services website. Reproduced here with permission.
Key takeaways
- There are a lot of motivated sellers in the Australian NEM renewables market: we count almost 5 GW of capacity that is publicly up for sale
- As always, there are more opportunities out there under the surface, and there could be as much as 8.5 GW of additional capacity available
- Motivations to sell extend from an active develop-and-sell business model in some cases, to discomfort with the degree of market risk in the NEM
- We expect this to drive a period of ownership consolidation across wind and solar in Australia. Long-term owners will start to come to the fore, driven by low cost of capital, long investment horizons, and greater institutional capacity to manage risk
- In general, and especially for merchant exposure, we prefer wind over solar. Dispatch weighted prices will strongly favour wind, providing greater pool revenue. And with a flatter production profile than solar, it requires less firming, and we expect offtake demand from wind projects to grow
- Developed wind is rare: Tilt Renewables is a standout opportunity for operational wind. Lacour/Goldwind’s Clarke Creek wind farm also looks attractive based on our criteria
- For solar assets we focus on a high degree of contracting to mitigate softening merchant prices. Looking at publicly available assets, we like New Energy Solar, and FRV
- With contracted wind as our favourite asset type in this sector, investors will need to get involved in the development process earlier. Wind development timeframes are long, and the vast majority of wind capacity that we consider to be available for investors is at an early stage
Overview
The highly fragmented ownership of Australia’s renewables sector has long been due for a shakeup, and the number of assets currently up for sale suggests that the process of consolidation may now be underway.
Every asset has its price, and we subscribe to the view that all generators are effectively up for sale all the time, for the right offer. But it’s clear that the VRE market in Australia currently has a number of motivated sellers, providing an unprecedented opportunity for long term owners to build a portfolio.
We also track a large volume of projects not yet committed to construction which we expect to be available to investors even though they are not in the public eye.
To frame our recommendations, we note up front that at ITK we prefer wind over solar. Our NEM price forecasts show a clear discrepancy in the revenue fortunes for stand-alone renewables, as wind secures a significantly higher dispatch weighted average price than utility solar. This is a trend that has already started to emerge, as a result of high rooftop and utility solar penetration and the starkly different intraday output profiles compared to wind. But we expect the divergence to get larger as time goes on.
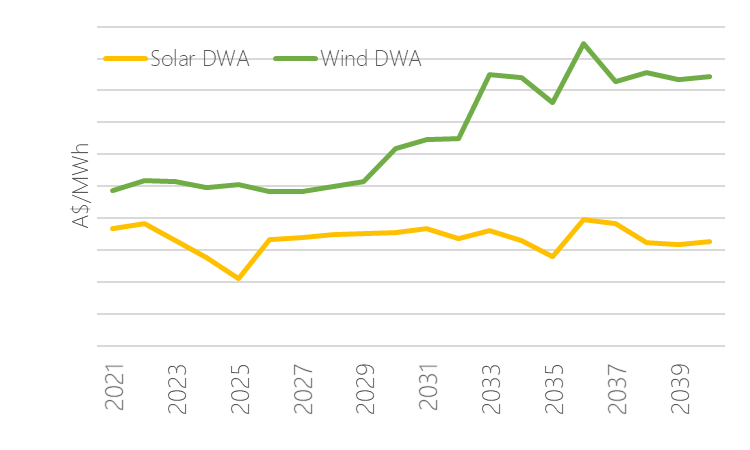
Figure 1: Solar and wind dispatch weighted price forecast (NEM average)
Source: ITK Services
Not only do we expect realized wind prices to be higher, but there is a risk that solar pricing is pushed right down to, or even below, the breakeven price required for solar development.
The assets for sale
We split assets into two broad groups: those publicly up for sale as a result of company announcements or media reports; and other projects which we anticipate are available for investors as a result of the business models of the current owners.
Until recently solar dominated the volume of capacity that is publicly up for sale. But Infratil’s announcement that they will perform a strategic review of their stake in Tilt Renewables brings 2.7 GW of wind capacity to the market, making wind the largest category available in one fell swoop.
What is new here – for Australia – is the volume of capacity for sale that is either fully operational, undergoing commissioning, or under construction. So while a plethora of risks remain in the NEM, there are a range of assets now available that sidestep construction risk.
The sellers are motivated by a variety of factors. Some are expert project developers but are perhaps larger and with more institutional capacity than the pure specialists. They may take on construction risk and short-term market risk in order to build value, but are now looking to recycle capital or avoid the merchant tail risk on semi-contracted assets.
There are also owners who have purchased assets late in the development stage and have been caught out by the degree of market risk. Construction and connection delays, EPC contractor insolvencies, unfavorable marginal loss factors, serious FCAS causer-pays costs, heavily suppressed daytime prices, system strength related curtailment…all have contributed to an environment that looks quite different to when original investment decisions may have been made a couple of years ago. These factors also demonstrate why Australian wholesale electricity investments are hard to structure like a traditional low risk infrastructure asset, potentially taking some by surprise.
| Asset | Majority
owner |
Type | Capacity MW AC | State | Status | Revenue | Remaining lifetime contract %* |
| Moree | FRV | Solar | 56 | NSW | Operational | PPA | 54% |
| Goonumbla | FRV | Solar | 67.8 | NSW | Operational | PPA | 61% |
| Metz | FRV | Solar | 115 | NSW | DA Approved | PPA | 60% |
| Sebastopol | FRV | Solar | 90 | NSW | Financial Close | PPA | 60% |
| Walla Walla | FRV | Solar | 300 | NSW | DA Approved | Merchant | 0% |
| Lilyvale | FRV | Solar | 100 | QLD | Operational | PPA | 43% |
| Chaff Mill | FRV | Solar | 100 | SA | Concept | Merchant | 0% |
| Winton | FRV | Solar | 85 | VIC | Construction | PPA | 60% |
| Daydream | Blackrock | Solar | 150 | QLD | Operational | PPA | 43% |
| Hayman | Blackrock | Solar | 50 | QLD | Operational | Merchant | 0% |
| Manildra | New Energy Solar | Solar | 48.5 | NSW | Operational | PPA | 38% |
| Beryl | New Energy Solar | Solar | 87 | NSW | Operational | PPA | 45% |
| Finley | John Laing | Solar | 133 | NSW | Operational | PPA | 19% |
| Sunraysia | John Laing | Solar | 200 | NSW | Commissioning | PPA | 30% |
| Clarke Creek | Lacour Energy/Goldwind | Wind | 450 | QLD | DA Approved | PPA | 31% |
| Childers | Elliott Green Power | Solar | 58 | QLD | Operational | Merchant | 0% |
| Susan River | Elliott Green Power | Solar | 75 | QLD | Operational | Merchant | 0% |
| Nevertire | Elliott Green Power | Solar | 105 | NSW | Operational | Merchant | 0% |
| Illabo | Tilt Renewables | Solar | 80 | NSW | DA Application | Merchant | 0% |
| Dysart | Tilt Renewables | Solar | 100 | QLD | DA Approved | Merchant | 0% |
| Chewko | Tilt Renewables | Solar | 60 | QLD | DA Approved | Merchant | 0% |
| Snowtown North | Tilt Renewables | Solar | 44 | SA | DA Approved | Merchant | 0% |
| Blaney | Tilt Renewables | Wind | 9.9 | NSW | Operating | Merchant | 25% |
| Crookwell | Tilt Renewables | Wind | 4.8 | NSW | Operating | Merchant | 0% |
| Liverpool Range | Tilt Renewables | Wind | 1000 | NSW | DA Approved | Merchant | 0% |
| Rye Park | Tilt Renewables | Wind | 327 | NSW | DA Approved | Merchant | 0% |
| Snowtown Stage 1 | Tilt Renewables | Wind | 101 | SA | Operating | Merchant | 0% |
| Palmer | Tilt Renewables | Wind | 375 | SA | DA Approved | Merchant | 0% |
| Salt Creek | Tilt Renewables | Wind | 54 | VIC | Operating | PPA | 44% |
| Dundonnell | Tilt Renewables | Wind | 336 | VIC | Commissioning | PPA | 54% |
| Bushy Creek | Tilt Renewables | Wind | 150 | VIC | Concept | Merchant | 0% |
| Total solar | 2,104 | ||||||
| Total wind | 2,807 |
Figure 2: Projects for sale (from public announcements or media reports)
*Based on notional 25 year life; estimated in some cases. Source: Company announcements, media reports, ITK Services estimates
To determine how attractive these assets are, we consider the main factors to be:
- Contracts. We prefer contracted assets, with offtake agreements that cover a decent proportion of the assets’ remaining output. This mitigates the relatively low price environment we expect to unfold over the next decade. But the details will be important here. Established operating assets with contracted output will have considerably more attractive PPA prices than recent developments.
- For our favoured wind segment, our price forecasts mean we like a merchant tail, but a proportion of contracted output remains a significant advantage.
- For solar, we consider a PPA to be essential. If an investor chooses to pursue a merchant solar asset, they need a very bullish view on the impact of coal closures on daytime prices. In our view Liddell’s exit will give only a very limited and short-term bump to solar realized prices, as 3.6 GW of new utility solar comes online across the NEM over the next couple of years. So any merchant solar strategy will hinge on the market impact of early retirements for coal stations such as Yallourn, Vales Point and Gladstone. We consider such early closures to be entirely possible, but represent a significant investment risk.
- Our preference for contracted assets narrows the public list to 14 (although we note that some of the asset sales may be on a all-of-portfolio-or-nothing basis). Not all PPAs are created equal, with significant differences between assets in terms of contract duration, production coverage and counterparty. We suggest leaning towards longer term contracts with high coverage of output for obvious reasons. Theoretically we would back a state government counterparty first (and there are several on this list), although in reality we don’t expect any of the offtakers associated with these assets to represent a credit risk.
- Additionally, assets which have been operating longer typically have higher PPA prices, as they were struck in a higher cost environment. This means more contracted revenue, and will therefore command a higher price.
- Track record. We all know about the problems getting projects up and running over the past couple of years. Getting connected in some regions has been a struggle, and commissioning timeframes have blown out in some instances. Some of the revenue benefits of wind may outweigh construction and commissioning risks for wind projects. But given our price outlook for solar, commissioning seems to be a risk not worth taking at this stage. So when thinking about solar investments, we prefer not only operating assets, but those that have a proven history of producing at or close to nameplate metrics.
- Portfolio. This one depends on the ambitions of specific investors, but there is an opportunity here to buy multi-asset portfolios off the shelf. For buyers looking for scale, the size of the portfolios might be a factor, along with the geographic diversity of the assets. Only two portfolios provides assets across four NEM states (Tilt Renewables, FRV), and only three have 300+ MW of operational or committed capacity (Tilt Renewables, FRV, John Laing). Clearly Tilt offers the largest opportunity from this list.
It is no easy task to reconcile all the issues, and each investor will have their own requirements and preferences. Having said that, our outlook for wind makes our top picks fairly straight forward.
Infratil’s strategic review of its Tilt Renewables stake provides an opportunity to buy a range of assets from concept to fully operational, and with a range of contractual positions. The portfolio as a whole has only 8% contract coverage, given that most of the capacity is held in undeveloped and as yet uncommitted projects. But of the five assets producing electricity, two have contractual cover over 40% (we note that one PPA has recently expired, and Blaney wind farm is approaching the end of our notional 25-year life used for the calculations).
Given that Infratil does not own Tilt outright, we assume the majority stakes will be sold as an entire package. In this case, investors will need to be comfortable with the development risk on the uncommitted projects, totaling over 2 GW. But 1.7 GW of this is development approved wind, which we consider to be the jewel in the crown of Australian renewables. The timelines for DA approval can be long, and the scale of the renewable build out across the NEM will be massive over the next decade. We therefore view these DA approved projects as highly valuable.
Clarke Creek also stands out: not only is it a wind farm, it has also secured a PPA for a high proportion of output with a top shelf counterparty (77% of name plate capacity with Stanwell Corporation, although we do not know the contract duration).
The project has achieved development approval, so much of the early work has been done. And the development partners are highly experienced. The only potential downside that jumps out from the numbers is the scale. At 450 MW we see this as a positive, but acknowledge that it may be a lot to bite off for some investors.
When thinking about the solar assets on the market, we like New Energy Solar given the operational track record of the two assets, and the relatively high degree of contracted output. There are individual assets out there with higher contracted volumes, but on a portfolio basis we consider 42% to be a strong result. We also note that Manildra likely carries one of the highest PPA prices in this list. While the concentration in NSW may be a negative from a diversification perspective, we expect NSW solar dispatch weighted prices to be among the highest in the NEM over our forecast period, so this is probably a net benefit.
We also flag FRV as an obvious choice. We do not know if FRV’s portfolio is being offered in its entirety or if interested parties can cherry-pick their favourite assets. Operations with a track record of performing, and probably with relatively high PPA prices (Moree, Lilyvale) are available, along with newly commissioned and under construction projects. The operational and committed assets have high contract coverage, although the early-stage projects bring down the portfolio average. While the whole portfolio contains some construction and connection risk, it also offers greater scale than New Energy Solar.
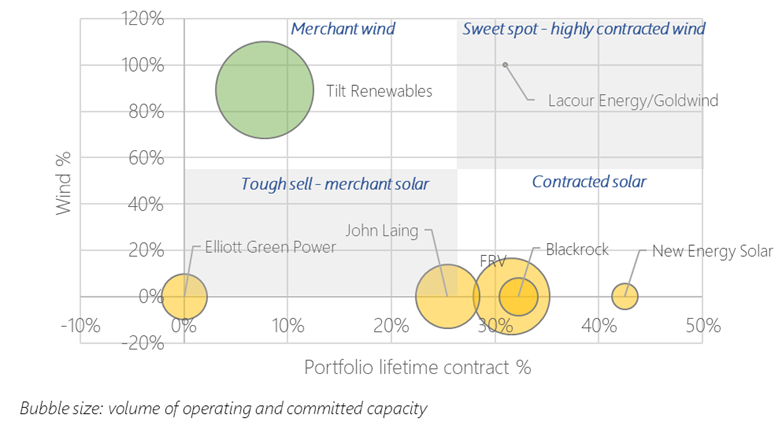
Figure 3: Portfolio positioning: wind vs offtake
What else is there?
Below the surface, we expect a large volume of capacity is available for investment. This is always the case: the majority of undeveloped wind and solar capacity is owned by specialist developers that pursue a develop-and-sell business model, even though their assets may not make the papers.
| Type | Status | Capacity MW AC |
| Solar | Operating or under construction | 670 |
| Solar | Pre-construction | 2,637 |
| Wind | Operating or committed | 586 |
| Wind | Pre-construction | 4,656 |
Figure 4: Likely additional capacity for sale (ITK analysis)
Source: ITK Services
While we do not detail the specific assets in this note, our investment preferences lead to some key conclusions.
Investors looking for de-risked wind projects will be fighting over a small slice of capacity. This will drive high prices. It’s clear that getting into the wind sector affordably will therefore require investors to get involved earlier in the development cycle. This can speed up the notoriously slow development timelines for wind, and reduce the premium paid to secure capacity.
This is of course riskier. But it will allow investors to take advantage of falling construction costs, and our positive outlook on merchant exposure for wind projects provides more room in our view to take on development risk. We think there are a couple of key elements in mitigating this early-stage risk:
- Pick the right development partner. We track projects from concept stage to operation, and can see which developers have built a track record of bringing assets into construction and operation. Teaming up with a developer that knows how to navigate this process is a big plus.
- Engage early with offtakers. While we like forward wind prices, we don’t suggest going fully merchant. Engaging early with PPA counterparties will help de-risk the project, and it is clear some companies are willing to sign up very early on. We have seen Stanwell Corporation (Clarke Creek), CleanCo (MacIntyre), CS Energy (Columboola) and Amazon (Gunnedah) to name a few that have inked PPAs well before construction.
Long term owners
That covers off the assets for sale, but what about buyers? Who would be a long-term renewable asset owner? We consider the NEM to be a fairly risky place at the moment, for all the reasons already listed plus looming market redesign; uncertain coal closure schedules; uncoordinated policy development among other issues. Combined with our outlook for fairly low wholesale prices over the next decade, long term owners will need some NEM-specific skills to make the investments work. We think today’s buyers are likely to have a range of the following characteristics:
- Low cost of capital
- Long investment horizon
- Large portfolio to diversify idiosyncratic risk
- Ability to actively trade/hedge in the wholesale market
- Driven by a need to hedge retail positions
These features suggest a growing role for global utilities with access to cheap debt and large generation portfolios. Super funds will surely be looking at their options, and specialist investment funds with a track record in electricity also look like front runners. And while their appetite currently appears lackluster, we expect that over the longer term Australian gentailers will also need to increase their VRE ownership positions to internally hedge their retail books.
To see which market participants meet some or all of these criteria, we’ve taken a look at the current market structure to identify the leaders and fast growers.
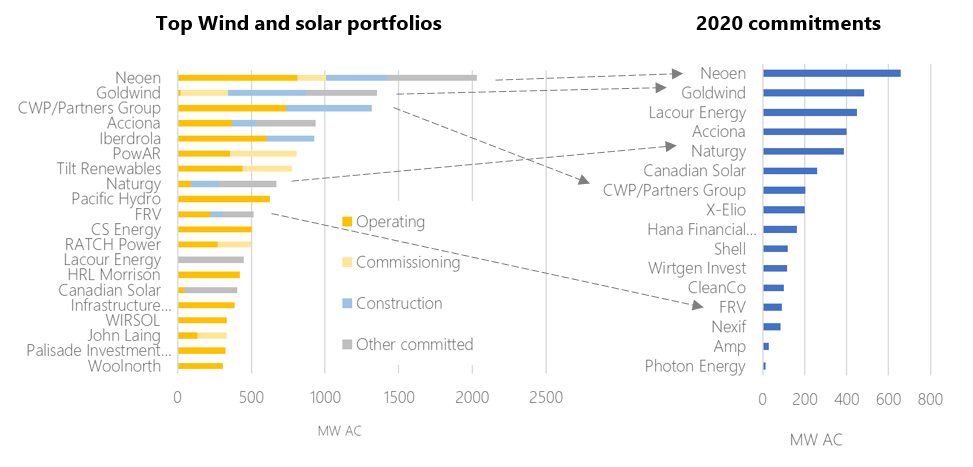
Figure 5: Top wind and solar portfolios vs 2020 Commitments
Some of the major players have clearly used 2020 to cement their positions at the top of the market. Neoen looks streets ahead in terms of operating and committed wind and solar capacity, with ~700 MW AC more in the serious end of the portfolio than the next largest owner, Goldwind. And Neoen has committed to over 600 MW of capacity this year alone, showing an ambition to dominate over the long-term.
Goldwind has also been active this year, and we note that the development tie-up (the details of which we are not party to) with Lacour Energy probably boosts their portfolio even further.
And Partners Group, now with a more formal relationship with CWP Renewables, has shot into the top 3 by operating and committed capacity, of which 200 MW was committed in August.
Of these industry leaders, who do we expect to be buyers? Based on business model, investment horizon and cost of capital, we think there are some obvious candidates. While Iberdrola will have its hands full building Port Augusta and integrating Infigen, we expect the management team will still be looking for opportunities to cement and grow its position in this relatively new regional market. CWP/Partners Group have an in-house portfolio of development options, but this doesn’t preclude it from acquiring outside targets if the price is right. PowAR (formerly PARF), HRL Morrison and Infrastructure Capital Group, which may have higher equity return hurdles than some others on this list, are also likely to be waiting patiently for the right opportunities to come along.
Companies with an active retail position, or the intention to build one, will also surely need to climb the market share ladder if they want to keep pace with the sector transition. PPAs can of course be used but come with their own risks; internal hedges continue to make sense. So given its stated retail ambitions Shell is a potential asset buyer, and while AGL, Origin and EnergyAustralia have been very quiet on the renewables front, this surely must become a stronger part of their future strategy.
————————————–
About our Guest Author
 |
Ben Willacy is a consultant and analyst at ITK Services.
Ben has 18 years experience in global energy sector analysis, with experience across renewables, oil and gas, and coal. He co-founded Sustainable Energy Research Analytics (SERA), creating and maintaining the SERA Tracker product providing data and analysis on Australian wind and solar developments. Prior to this, Ben led Wood Mackenzie’s global coal supply team. You can find Ben on LinkedIn here. |
Unless you want to vacuum up LRCs to get your Green Stamp, I really cant see any value in Renewable PPAs
which for buyers have anti-hedging characteristics.