Yesterday I received a Clean Energy Council reminder about this Thursday’s (virtual) Large-Scale Solar Forum:
The Large-Scale Solar Forum runs this Thursday 10:00-17:30 AEDT (i.e. 09:00-16:00 NEM Time) 11th March 2021 and further information about what’s on, and how to register, is available here (until Thursday, I presume).
It’s only $190 for a CEC member (or $290 for non-members like us) – which certainly seems value for money for me – given I aim to have it running in the background through the day whilst working on other things (like ez2view version 9, and other projects for Five Minute Settlement). I will be fully focused on the ‘Operating in the NEM session’ (15:00 to 16:15 AEDT) for a couple reasons, including:
1) In terms of what we do as a company, we strive to ‘make complexity understandable, so clients can make better decisions’.
2) The NEM offers more than 20 years of real operational history (and a very rich data set to go with that), and we believe firmly that clients should be able to make the best advantage of this rich history in order to help them understand the range of plausible scenarios that might unfold, looking forwards.
… that’s the reason why, for instance, we again invested a non-trivial amount of time into the development and recent release of the Generator Statistical Digest 2020 (an updated 10-year review of the individual performance of all units operating in the NEM, with a particularly detailed focus on calendar 2020).
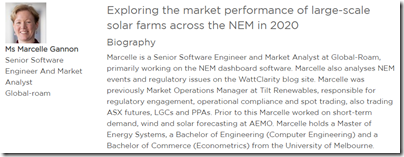
3) Following from the release of the GSD2020, our valued team member Marcelle Gannon is speaking about ‘exploring the market performance of large-scale solar farms across the NEM in 2020’ in this session:
Very much aligned with our company’s DNA, there is much that can be learned from understanding what’s actually happening. Sadly, too many stakeholders are belatedly finding that the real world complexity can be quite different from what their spreadsheet models predicted ‘should’ happen in business cases prior to their projects being built.
Coincidentally, Marcelle was featured in the Melbourne Energy Institute ‘energy@melbourne’ newsletter at the end of February, where they noted:
“Marcelle’s articles provide wonderful insights into the Australian electricity market, particularly her discussions of renewables. Important concepts are explained clearly and evidence is even provided!”
… so we would recommend you also tune in to hear the insights that Marcelle can share from the GSD2020. In particular, I’d suggest the audience listen up for three key insights:
| . |
Listen out for … |
| Insight Number 1 |
A number of others present ‘League Tables’ ranking the performance of Solar Farms in the NEM by Capacity Factor over some time range (e.g. a month or a year) … but these only show a small part of the overall picture. In our view, for a better picture it is very important to look at metrics like ‘VWA Prices’ in order to understand how Solar Farms are really performing against one another … what is their relative performance in harvesting spot revenues when compared to their competitors. Thankfully with easy access to the numbers published in the GSD2020, Marcelle is able to do this. Marcelle then goes a further step forward, to show what the ranking table looks like when viewing $ revenue per MaxCap (i.e. deliverable MW installed) at each of the projects. The high and low performers, and the general ranking, may well surprise you! —————– On Wednesday 17th March 2021, Marcelle posted this ‘Comparison of Large-Scale Solar Farm Revenue in 2020’ highlighting this particular insight from the presentation.
|
| Insight Number 2 |
To what extent does this ranking order change if we also add in calculated LGC Revenues for the 2020 calendar year? —————– On Wednesday 17th March 2021, Marcelle posted this ‘Large-scale solar farm revenue in 2020 part 2 – considering LGCs’ highlighting Insight Number 2. |
| Insight Number 3 |
It used to be that FCAS costs were seen as negligible: Which were the solar farms that paid out more than 10% of their annual ENERGY revenues on FCAS costs through calendar 2020? Where were they located, and why did that make a difference? Which were the solar farms that paid out more than 20%? Which were the ones that paid out more than 40% of total revenue for the year (on a cost component that really did not even feature in many investment business cases not too long ago)? Yikes! —————– On Thursday 1st April 2021, Marcelle posted this ‘Ranking solar farm FCAS costs in the NEM in 2020’ highlighting Insight Number 3 (FCAS costs are far from negligible). |
If time permits afterwards, Marcelle might expand on these ideas in subsequent articles here on WattClarity®.


Leave a comment