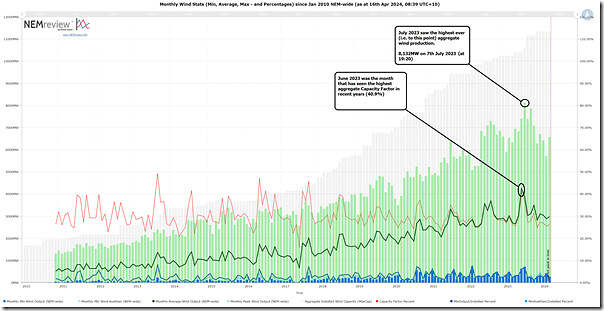
Given the articles (on Monday 15th April and also this morning) about the recent wind lull, I thought it was worth updating this long-range trend of monthly statistics:
Clients with their own licence to the NEMreview software can open their own copy of this trend here.
This chart contains many stories – with some headlines being that:
1) In terms of high points:
(a) The all-time maximum production is still currently base on what happened on Friday evening 7th July 2023, when the aggregate wind production peaked at 8,132MW at 19:20.
(b) But it was the month of June 2023 that saw a higher capacity factor (40.9% for the month), notwithstanding …
i. some challenges with choosing which installed capacity to use as the denominator; and also
ii. that Capacity Factor is an increasingly simplistic method for reporting performance.
2) In terms of low points:
(a) These continue to bump around the bottom of the chart, with instantaneous capacity factor in the range of 1% to 4%, or slightly higher on a good month
(b) But remember that the low points might be increasingly affected by curtailment (which is on the rise, and was a particular focus for Semi-Scheduled units in the GSD2023)
(c) In terms of standouts:
i. The wind drought of June 2017 remains a standout low point in NEM history.
ii. though perhaps when we come to fully review 2024 Q2, what’s currently happening might be also be a standout?
3) In terms of averages (or aggregate levels of production across the month):
(a) We see the aggregate capacity factor has stabilized (with greater diversity of installed wind farms) to be typically oscillating between 25% and 35% in a month, with a few months breaking through either side of that typical range.
(b) The dark green line shows the trend for increased aggregate production over time:
i. As new wind farms continue to come onto the grid;
ii. Though obviously seasonally affected.
We’ll continue to keep an eye … particularly towards the end of 2024 Q2, which is when we’d expect (based on seasonal patterns) to see the next step upwards in the NEM-wide wind production patterns.


Great article Paul:
Based on modelling (Boston 2022* – Figure 1) the wind drought of June 2017 was small compared to 2006,2008 and particularly 2010.
There is now good hindcast ERA5 wind data for 40 to 50 years, so updating this paper would make sense. ERA6 will be available next year.
Climate change may also decrease wind speed so the future requirements could be tested against the various RCP models.
* Geoff Bongers mentioned this paper in: https://wattclarity.com.au/articles/2022/06/seasons-of-low-wind-and-solar-output-will-influence-the-shape-of-the-nem/ . It dies leave out figure 1