
In the latest edition of our Generator Statistical Digest, we introduced a new section that specifically focuses on Semi-Scheduled Wind and Solar units.
There are some notable exceptions (with a few units still being Non-Scheduled), but by and large, the Semi-Scheduled category represents almost all solar and wind farms in the NEM with a capacity greater or equal to 30MW.
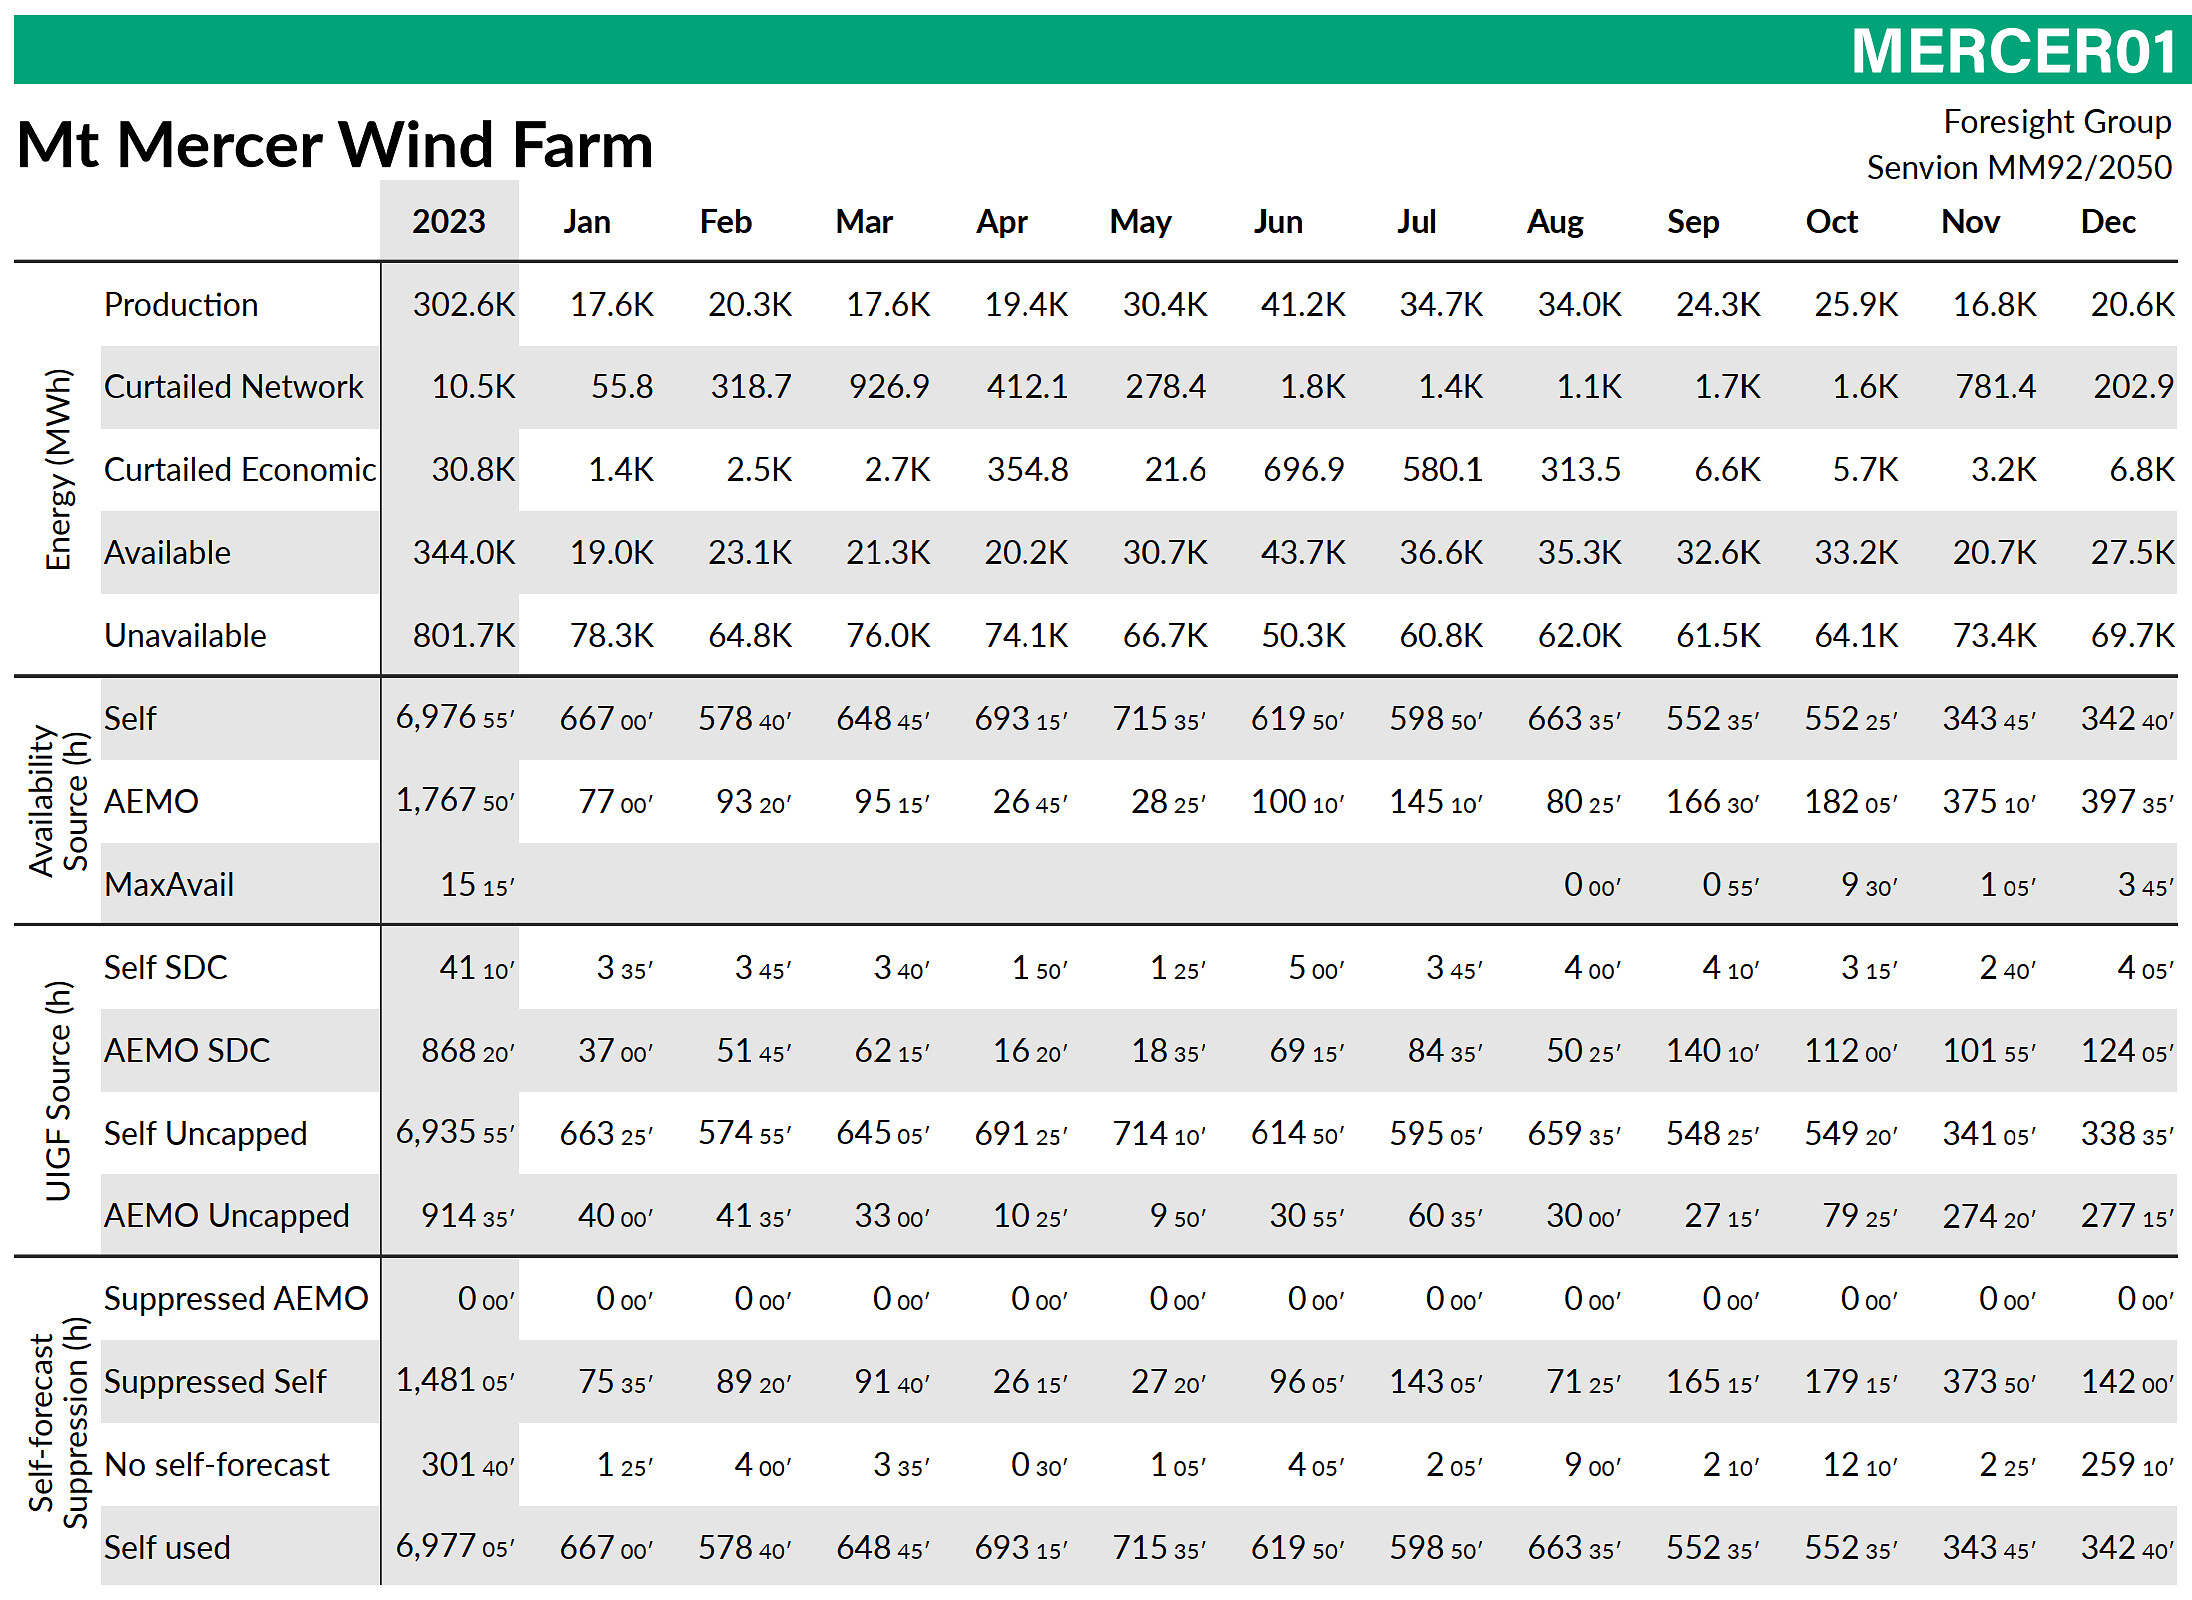
A sample from the new semi-scheduled section of our GSD2023 which shows monthly summary stats related to production, curtailment, availability, and self-forecasting for each of these units.
Source: GSD2023
Two new metrics we’ve begun publishing in this section are ‘Curtailed Network’ and ‘Curtailed Economic’ volumes (in MWh) for each of these units month-by-month. The calculations for estimating and attributing curtailment are not straightforward, as Marcelle Gannon previously noted on WattClarity back in 2020. However, the methodology we settled on for the GSD2023 uses a logic resembling what Allan O’Neil outlined in this WattClarity article last year – which we believe is the most practically accurate method of estimation, and especially so when aggregating over time. To avoid doubling up on information, I would suggest reading Allan’s very informative article to understand the difference between network and economic ‘curtailment’ – and to make more sense of the broader terminology.
The GSD2023 data extract makes easy work of summing together all these unit-level numbers to see a bigger picture of NEM-wide semi-scheduled curtailment. My simple calculations reveal the following grand totals:
- 39.7TWh of Energy Production
- 1.2TWh of Network Curtailment
- 2.5TWh of Economic Curtailment
- 108.2TWh of Unavailability
In the chart below I’ve plotted each of those underlying numbers on a month-by-month basis and translated each into factors.
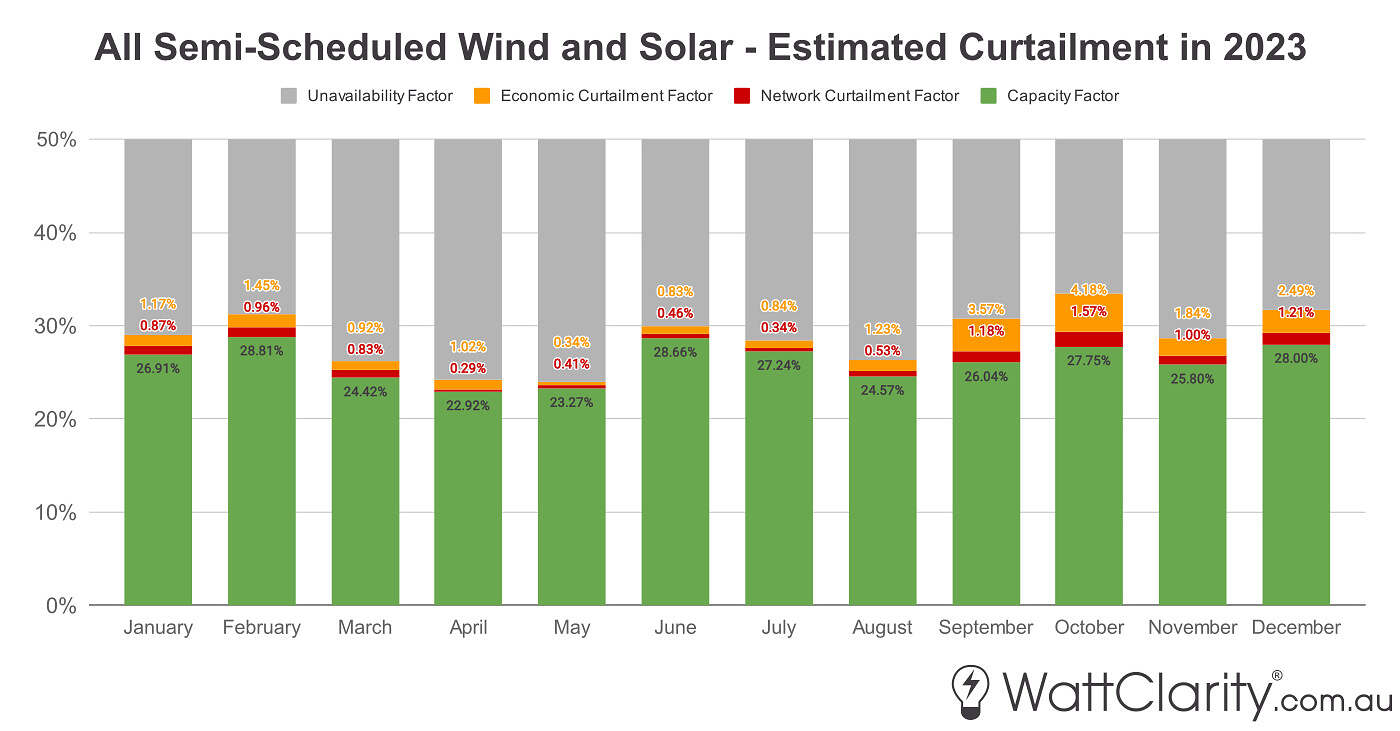 Month-by-month production (green), network curtailment (red), economic curtailment (orange), and unavailability (grey) for all semi-scheduled units – expressed as factors in relation to total capacity.
Note: Y-axis is capped at 50%, this has been done to zoom in on curtailment figures.
Source: GSD2023 Data Extract
It’s dangerous to draw concrete conclusions to the underlying reasons when only looking at numbers aggregated NEM-wide, but the chart reveals some seasonal variations in those factors.
Worst Hit
Zooming back in to the unit-level data – as we originally published it – reveals the more extreme individual outcomes beneath those aggregated numbers.
There were 164 semi-scheduled units by the end of 2023, and with some quick spreadsheet work I created a simple ranking of the 3 worst hit, in terms of a ‘network curtailment factor’. As mentioned above, I’m using this term to refer to a metric that is just a simple expression of MWh network curtailed normalised against the size of solar/wind farm unit.
Coming in at the top of the rankings were Molong SF (10.4% network curtailment factor), Manildra SF (8.9%), and Bannerton Solar Park (8.8%). The full figures are shown in the screenshot below.
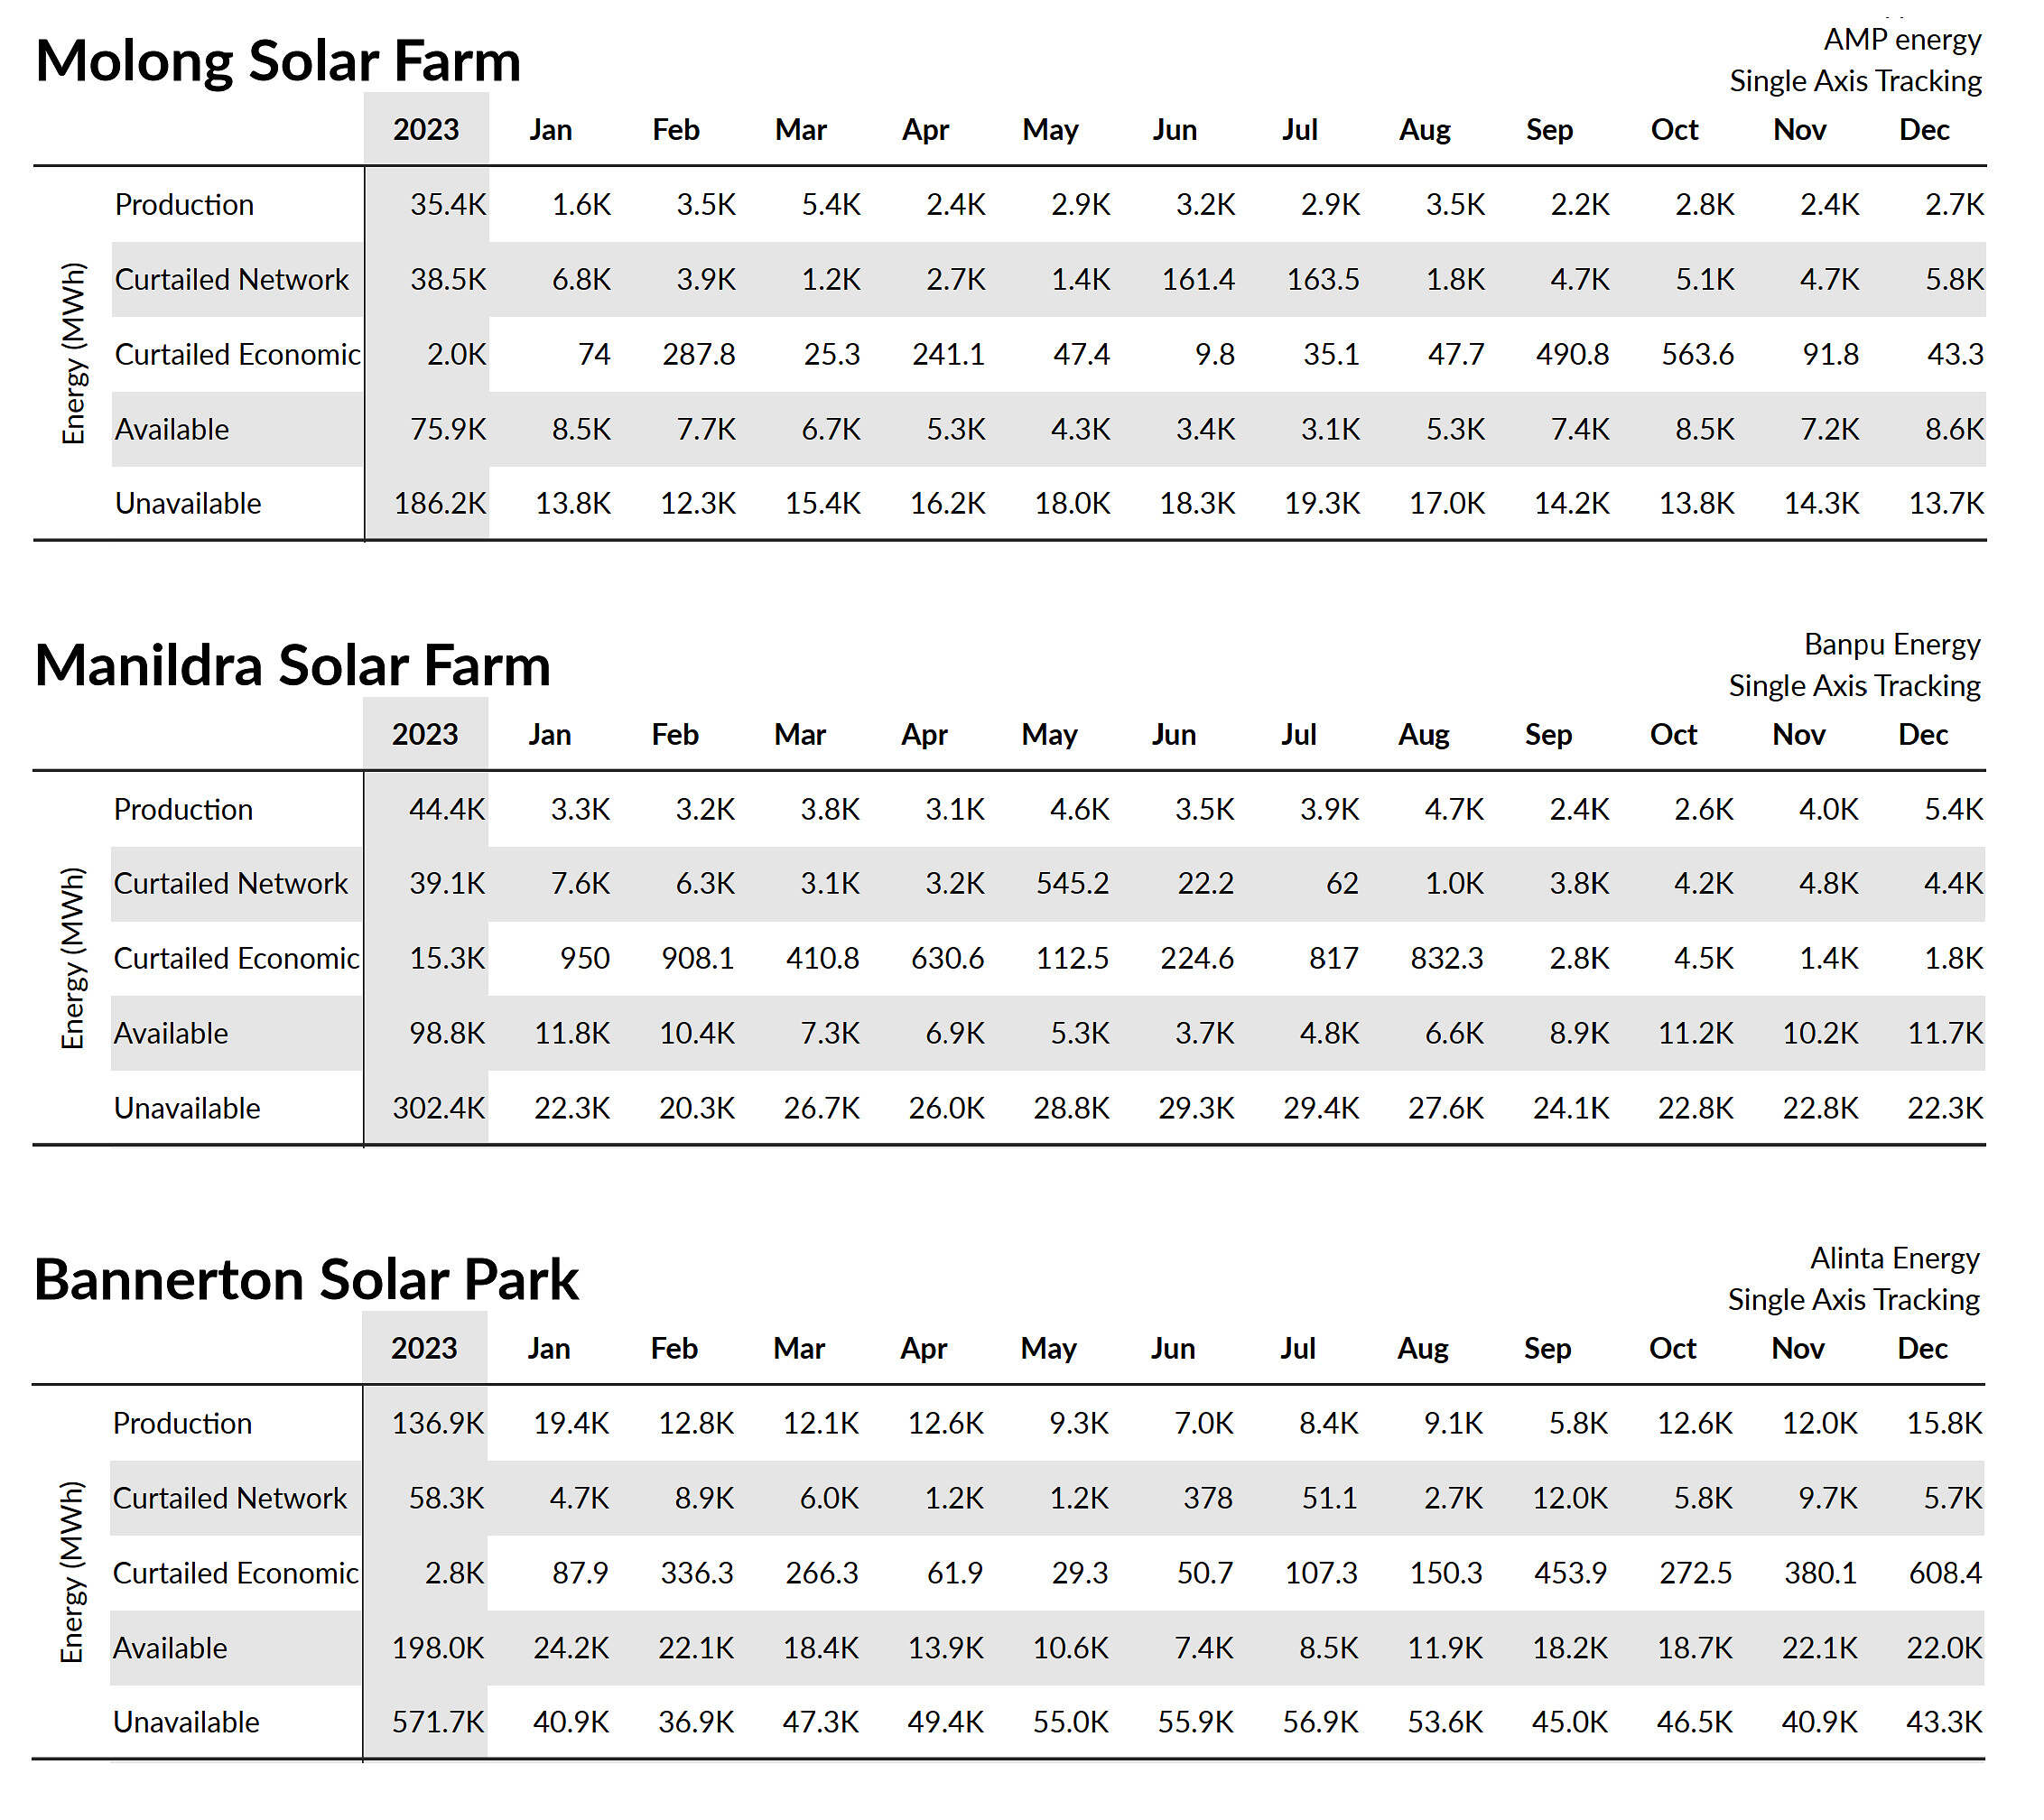
The ‘top 3’ semi-scheduled units with the highest network curtailment factor.
Source: GSD2023
Interestingly, it jumps out to me that Molong Solar Farm was network-curtailed for more MWh than it produced in 2023.. But perhaps this is less surprising for those who read Paul’s review of curtailment early last year where 2022 outcomes were just as similarly dire for Molong and Manildra.
Using a similar ‘economic curtailment factor’, the ‘top 3’ comprised of Numurkah SF (10.4%), Whitsundays SF (9%), and Clare SF (8.8%). The screenshot below reveals the underlying data.
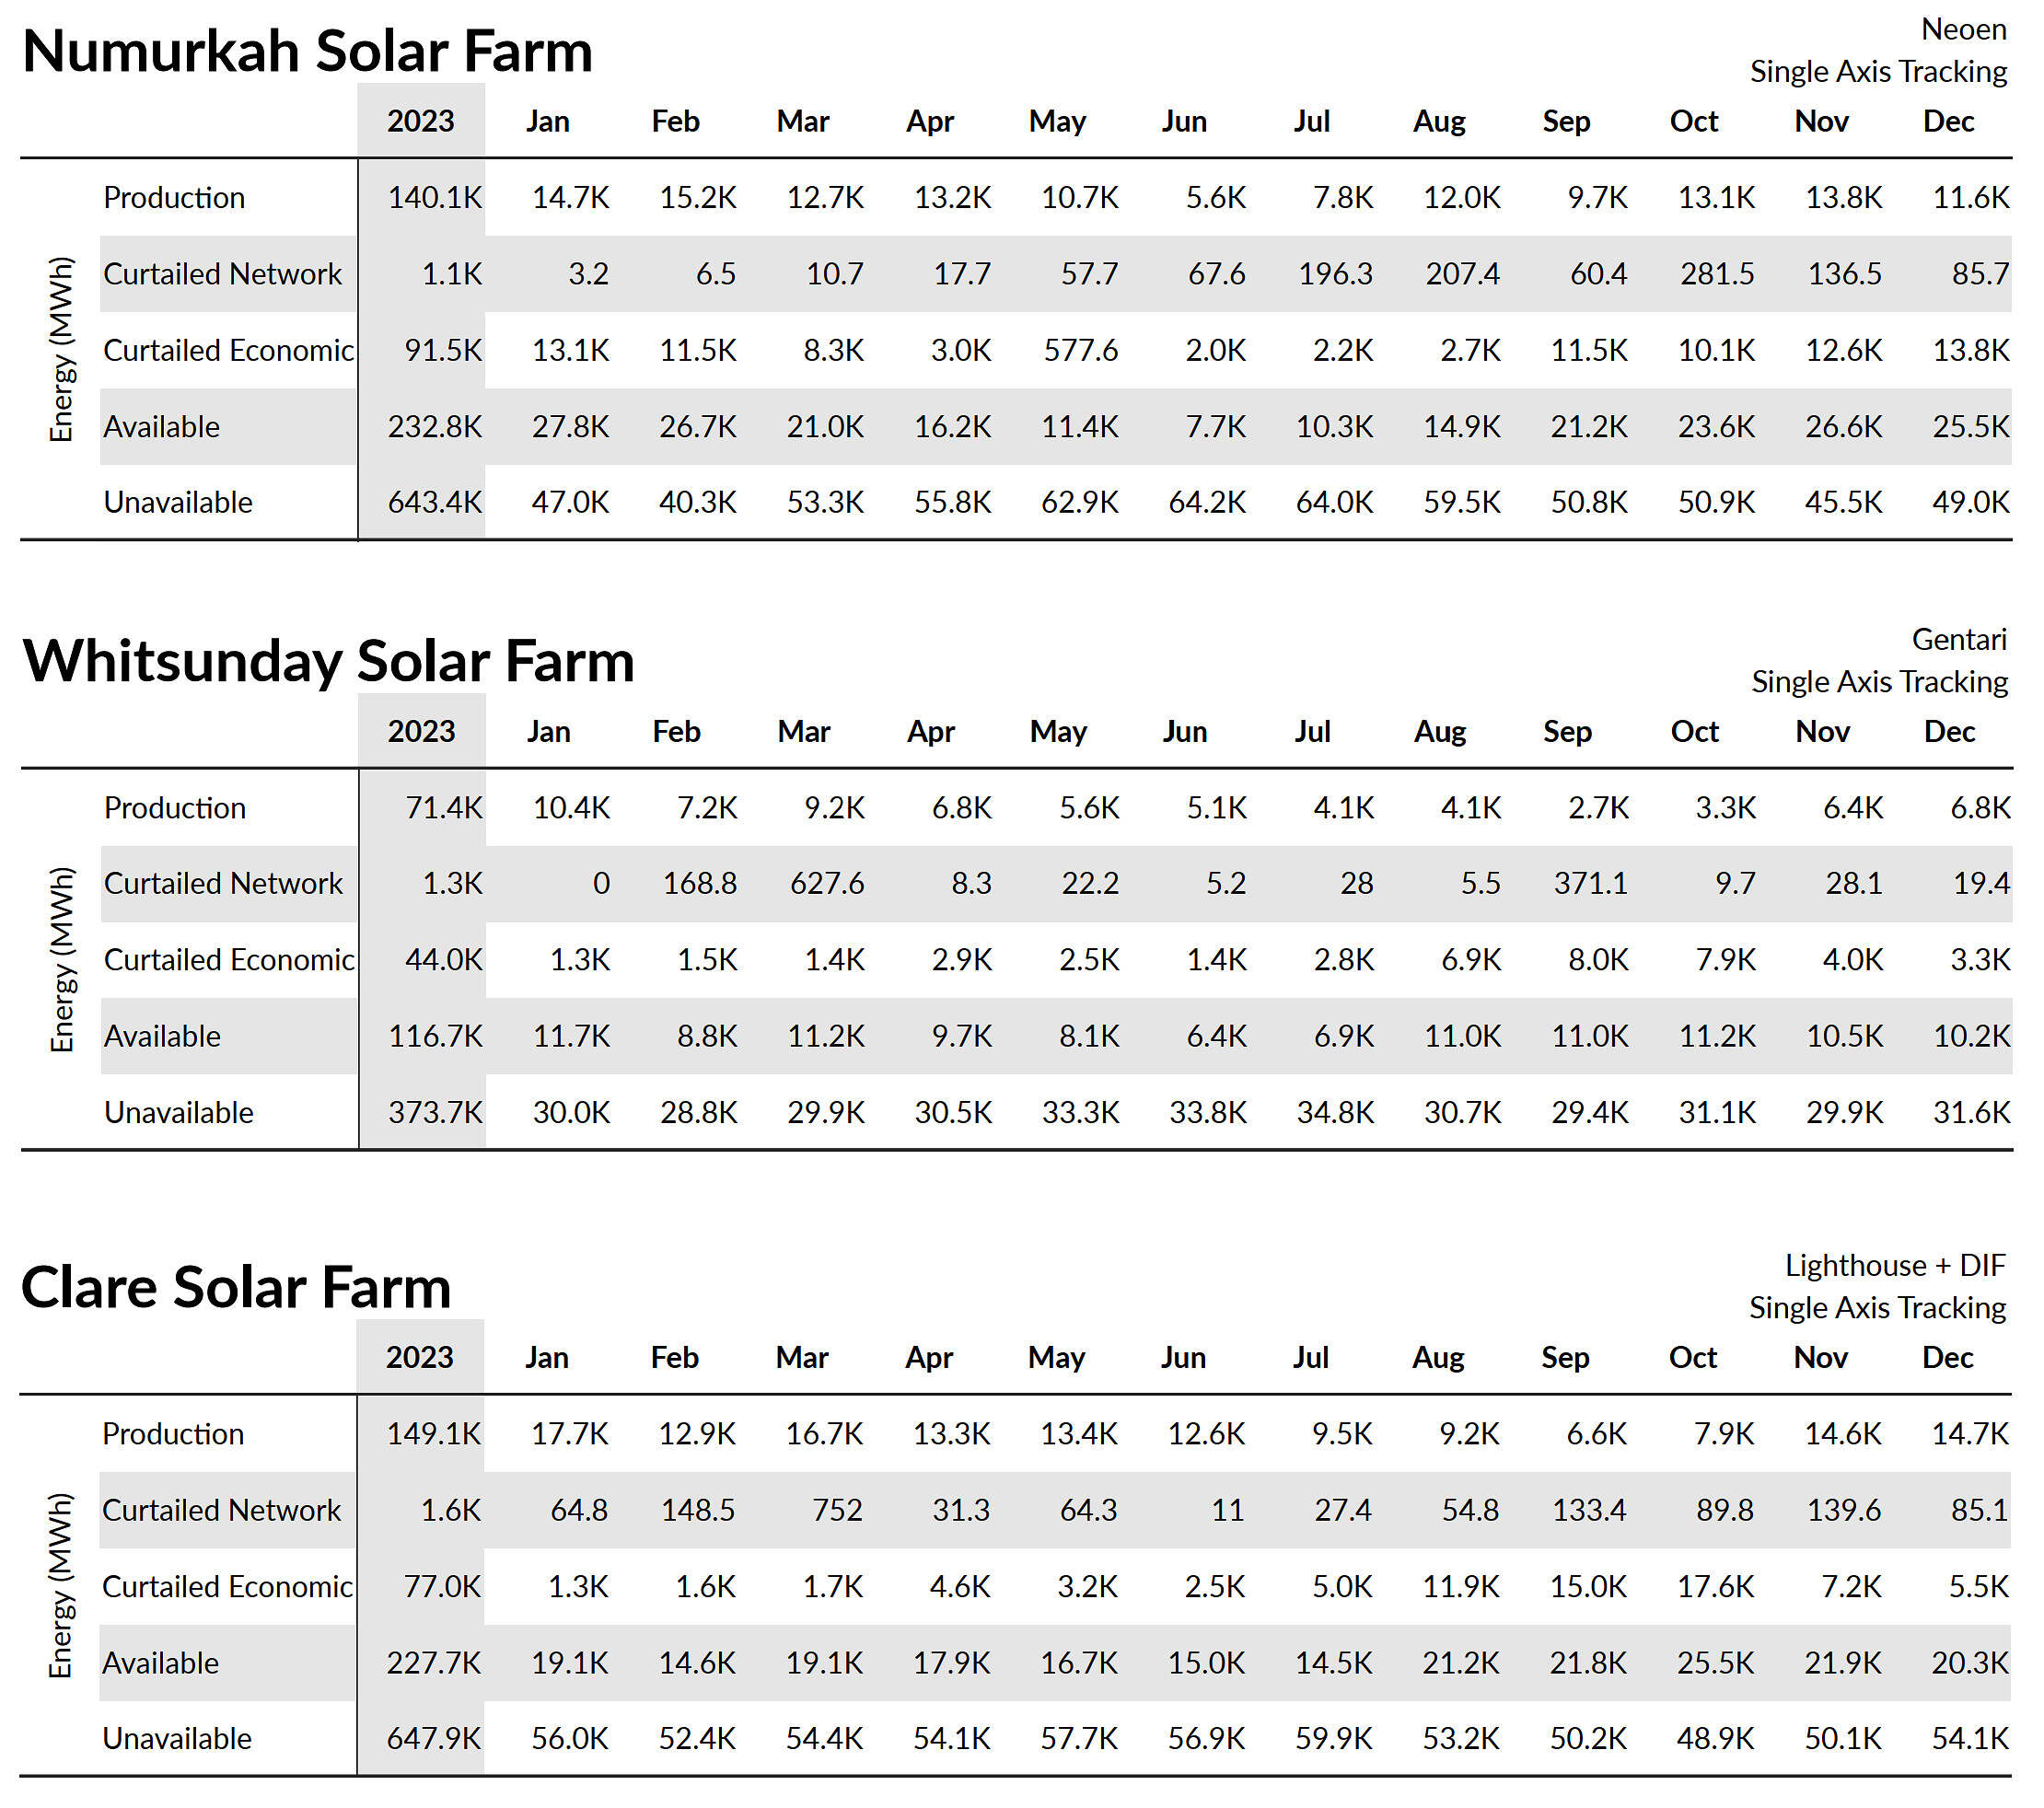
The ‘top 3’ semi-scheduled units with the highest economic curtailment factor.
Source: GSD2023
Interestingly when I look further down my rankings list, I note that the ‘top 10’ for both of these metrics comprised solely of solar farms.
That’s all for now.. As time allows I hope to dig a bit deeper into these numbers to examine locational trends and the underlying factors at play.
Dan – Great graph.
So we need to double solar/wind in Apr and May, BUT the network curtailment will be an issue all months AND the economic curtailment will more than double in September to December. Or it’s not that simple?
Not that simple Dave, but I wish it was.. We talked a bit about the long-term future of solar and wind in our GenInsights21 report which Marcelle referenced on WattClarity:
https://wattclarity.com.au/articles/2022/02/what-does-the-future-hold-for-wind-and-solar-in-the-nem-seen-via-geninsights21/
Assuming we get annual cycling equivalent to two full depth cycles, 120 half depth cycles and 200 at quarter depth mostly in the mornings, that means that simplisticly twenty-two GWh of storage would eliminate the problem.
Now let’s say 10 GW/18 GWh of batteries were available as well as 4.5 GW/400 GWh of new pumped hydro, we should be able to eliminate at least 75% of the curtailment. That would incidentally increase renewable share from 38.7% to 40.7% plus whatever rooftop solar curtailment is avoided.
Very interesting to see how the calcs would fall out if solar capacity was tripled and wind doubled