I’ve noted before recently (e.g on 2nd November) that we’re* busy at work in crunching a wide range of numbers in order to produce our GenInsights Quarterly Updates (for 2023 Q3)
* as with prior iterations of this report, these are a collaborative effort between us at Global-Roam Pty Ltd and the team at Greenview Strategic Consulting. That’s what we mean here by ‘we’.
… are we are looking forward to providing this (with the Executive Briefing) to our subscribing clients when it’s released later in November. This is intended to augment some of the more traditional metrics included in the other two Quarterly Reports we see part of a triptych of Quarterly Reports that can sum up a quarter:
1) The AER’s Wholesale Market Quarterly publication for 2023 Q3 … published 19th Oct 2023.
2) The AEMO’s Quarterly Energy Dynamics for 2023 Q3 was published, as published 23rd Oct 2023.
Now for 2023 Q3 (for the first time in these reports), we’ve added in the analysis of an additional metric – Percentage supply from VRE across the NEM.
(A) Background
A couple quick pointers, for a start:
(A1) Which is a more useful measure – ‘% Renewables’ or ‘% VRE’?
In recent years, there’s been an increasing number of people and organisations reporting on instantaneous penetrations of supply from renewable energy, which can be thought of in two different categories:
Category 1) Forms of renewable energy that are both:
(a) synchronously connected to the grid; and also
(b) containing some buffer against instantaneous variability in the underlying resource; and
Category 2) Forms of Variable Renewable Energy (VRE) that are both:
(a) not synchronously connected to the grid (rather connected via inverter);
(b) containing minimal buffer against instantaneous variability in the underlying resource.
Combining both categories allows one to calculate % Renewables … whereas just focusing on Category 2 allows one to calculate % VRE:
1) Whilst a growing number of people are increasingly referring to % Renewables as a key performance indicator…
2) We see ‘% VRE’ as a much more useful measure to assist NEM stakeholders understand the core challenges in, and hence navigate, the energy transition
Back in November 2022 we expanded our RenewEconomy-sponsored ‘NEMwatch widget’ in November 2022 to incorporate both metrics for both assist users of the widget. However, we noted at the time that our sense was that:
1) Whilst % Renewables might even tend to be used as a ‘vanity metric’ in some cases;
2) % VRE is more useful.
Hence that has been our focus in our GenInsights Quarterly Updates (for 2023 Q3).
(A2) NEM-wide, or regional?
Furthermore, we have chosen to focus on a NEMwide measure to avoid the confusion inherent in subdividing the NEM into somewhat arbitrary (and politically driven) regional groupings that can tend to abstract away from underlying physical realities.
(A3) Data derivation
Those not so familiar with electricity terminology are reminded that a MW is a measure of rate, whilst a MWh is a measure of volume.
1) In calculating % VRE we’re looking at an instantaneous rate of production for each and every 5 minute dispatch interval in the quarter (i.e. all ~26,000 of them).
2) To do this requires calculating:
(a) As a Numerator, the aggregate rate of supply from Wind + Large Solar + Small Solar
… notwithstanding the ongoing opacity of rooftop PV, and the fact that an increasing number seem to forget that the AEMO’s estimates are just estimates (and not actually measured amounts).
(b) As a Denominator, the aggregate rate of supply from all Fuel Types (Coal, Gas, Liquid, Hydro, Other + the VRE)
2) It should be obvious that there’s some variability in both the Numerator and Denominator … and hence in the Percentage itself.
Calculating this metric has required interpolation between AEMO’s estimates for rooftop PV production (which are supplied only on a 30-minute cadence) to match with ‘FinalMW’ (on a 5-minute cadence) for all other (i.e. metered) data sets.
(B) A quick look at Monday 3rd and Tuesday 4th July 2023
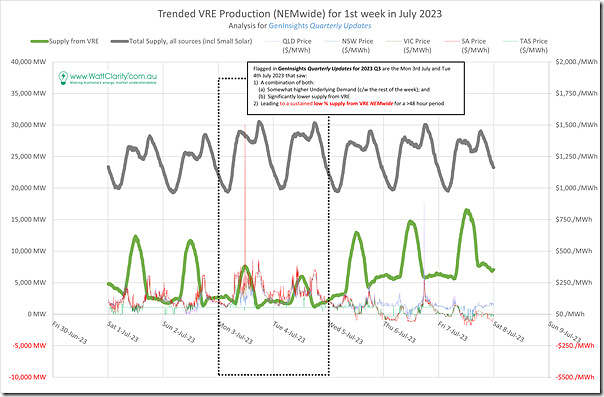
Here’s a quick look at the first calendar week in July 2023 – showing both Numerator and Denominator in the calculation (but not the percentage).
This week contained two days (Mon 3rd July and Tue 4th July) that saw some sustained low levels of percentage supply from VRE NEM-wide, as you can see below:
A few quick stats:
1) Over those 2 days, the daily min points (in terms of % VRE NEMwide) reached 3.4% (Mon 3rd) and 3.8% (Tue 4th) … but these were not the lowest points in Q3;
2) What was more noteworthy was that:
(a) The daily max points on those days were only 27.1% (on Mon 3rd) and a lowly 20% (on Tue 4th) … much lower than most days;
(b) In total, 308 dispatch intervals (of 576 in total – so 53% of the time) over those 2 days saw instantaneous production levels under 10% of total supply.
You’ll need to refer to the GenInsights 2023 Q3 report for more discussion…
PS1 a note from David Osmond
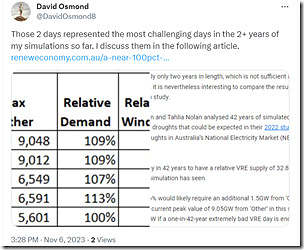
After tweeting about this article, David Osmond quickly replied with this tweet:
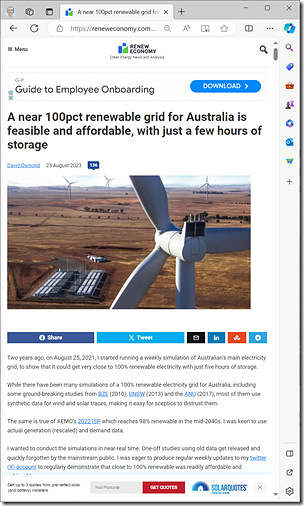
… which references his article ‘A near 100pct renewable grid for Australia is feasible and affordable, with just a few hours of storage’ of 23rd August 2023:
As a service to readers here (and notwithstanding some cautions – to come in a later article – about the limitation on conclusions that might be drawn from David’s method) we’ve linked them here for ease of reference.


Leave a comment