Last week (Sat 16th September and Sun 17th September 2023) was a noteworthy period in the NEM, because of low Operational Demand, but also for other (related) reasons as well:
1) On Saturday I wrote about ‘New ‘lowest ever*’ points for Market Demand–in Victoria and NEM-wide on Saturday 16th September 2023 (and record high IRPM)’
2) On Sunday I wrote about ‘QLD’s turn at new lowest point for minimum demand (in ordinary times)’
Snatching a bit of time today, I’ve pieced these points together…
(A) AEMO reports of the low points for demand
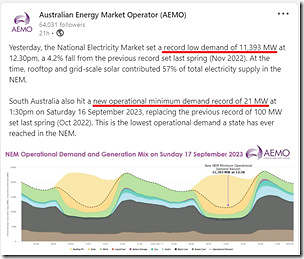
On Monday 19th September, the AEMO posted this update on LinkedIn:
I’ve highlighted the two key stats, from our perspective:
1) With respect to NEM-wide Operational Demand … ‘a record low demand of 11,393 MW at 12.30pm, a 4.2% fall from the previous record set last spring (Nov 2022)’
2) With respect to SA Operational Demand … ‘a new operational minimum demand record of 21 MW at 1:30pm on Saturday 16 September 2023’.
They also noted this here on Twitter.
—
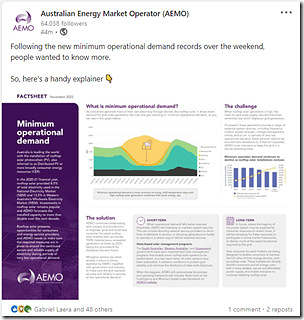
Today (Tue 19th Sept) the AEMO used LinkedIn again to communicate more:
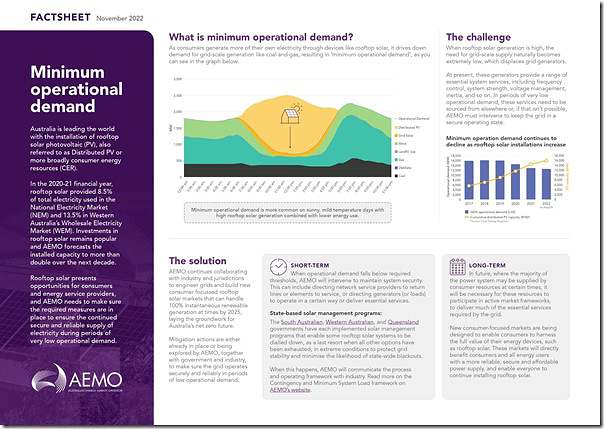
… and we’ve saved the Factsheet here for ease of future reference:
(B) Commentary elsewhere
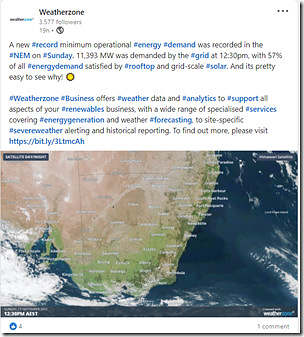
For what it’s worth, I saw that Weatherzone posted this note on LinkedIn:
… however it did not link to anything on their website specifically relating to that weekend. In a quick scan of their website I did see that (on 31st August) Ashleigh Lange had written ‘Will solar power boom or bust this spring and summer?’ that is obviously related to the broader outlook for spring 2023.
—
On RenewEconomy I did see:
1) On Sunday 17th September, Giles Parkinson started with ‘Rooftop solar smashes records, sends coal and demand to new lows as it reshapes the grid’; and then
2) On Monday 18th September, Giles also added ‘Rooftop solar eats up all demand in South Australia, world’s most renewable grid’.
—
I’ve not seen anything elsewhere … but only gave it a very cursory scan.
(C) High levels of IRPM
In the articles over the weekend I’d highlighted that the levels of NEM-wide IRPM (Instantaneous Reserve Plant Margin) was coincidentally at stunningly high percentage levels.
1) In our article on Sat 16th Sept, I noted that the highest point turns out to be 264.02% at 12:25 (i.e. coincident with lowest point for NEM-wide demand).
2) For Sunday 17th Sept, the levels were high (~240%) but not as high as on Saturday.
This is something we’ll explore in some detail for Appendix 1 within the upcoming release of GenInsights Quarterly Updates for Q3 2023.
(D) Low levels of inertia
ON 20th July 2023, Jonathon Dyson wrote ‘Let’s talk about inertia’ , and included in that article some insights about the low points seen for inertia across the grid in Q1 2023 from our collaboratively developed GenInsights Quarterly Update for Q1 2023.
D1) South Australia on Saturday 16th September 2023
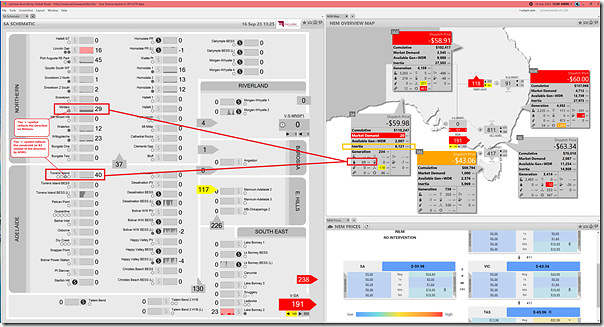
So it was with interest that we time-travel a window of ez2view back to the 12:30 dispatch interval on Saturday 16th September 2023:
Quick notes:
1) Only 2 x thermal units running (Mintaro and Torrens B2), both appearing to be formally ‘Directed’ to run;
2) The level of ‘Market Demand’ (which is somewhat different than ‘Operational Demand’) is shown as 20MW in the 5-minute dispatch interval ending 12:30;
3) The aggregate level of inertia in the SA region is 6,121MW.s* (as reported by AEMO) … which is right down around the AEMO’s Secure Operating Limit for the SA region.
… remember that inertia is measured in ‘megawatt seconds’ (or MW.s).
D2) NEM-wide on Sunday 17th September 2023
I’ve not taken the time to look at the time of aggregate intertia across all regions (and particularly in the mainland) for the time of minimum Operational Demand NEM-wide on Sunday 17th September 2023.
No doubt these points above will be reviewed further in GenInsights Quarterly Update for Q3 2023, when we start preparing this soon.
(E) Curtailment of VRE
Part of the reason for the high levels of IRPM were the high levels of spillage of wind and solar across the grid … because of:
1) moderate levels of Underlying Demand (because of spring)
2) mixing with high levels of capability for VRE (production from wind and solar) …
3) hence driving prices for energy below $0/MWh (and below ‘negative LGC’) and triggering massive curtailment of renewable energy on the grid.
We can see in the ez2view snapshot above that much of the wind and solar in South Australia was not running, or running at very low levels.
E1) Curtailment of Large Solar
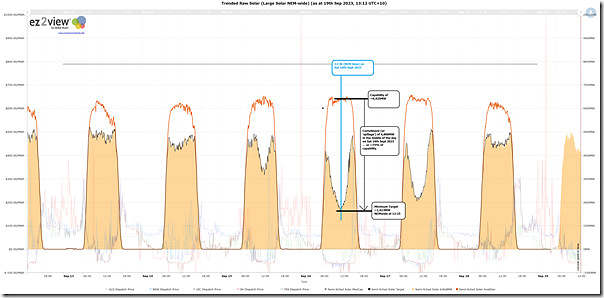
Quickly accessing this pre-prepared dashboard for Large Solar plant across the NEM that’s Semi-Scheduled (i.e. ignoring a small amount that is Non-Scheduled) we can quickly get the sense that the curtailment of Large Solar during the peak sunny times on Saturday and Sunday was massive …
We see:
1) as much as 75% of aggregate capability in the middle of the day on Saturday 16th September 2023 (i.e. ~ 4,800MW at time of peak spillage); and
2) slightly lower on Sunday 17th September, though still quite large.
That’s a pretty remarkable level of spillage!
E2) Curtailment of Wind
I’ve not had time to look specifically at wind.
E3) Curtailment of Rooftop Solar? … or activation of DER
In this thread here on LinkedIn, Dave Smith asked:
‘Was any rooftop PV switched off by AEMO at this time? I would expect that it was, since this seems like a lower operational demand than AEMO would be comfortable with.’
I’ve not seen any reports of curtailment of rooftop solar (e.g. nothing on Twitter by SAPN) … but then I have not been focused too much on that.
—
A related question would be about orchestration of distributed battery storage in VPPs or other … but I have not had any time to check.
Back on 24th June 2023 we wrote about ‘Increasing curtailment of Wind and Solar across the NEM’ with a particular focus on Q1 2023, with reference to the GenInsights Quarterly Updates for Q1 2023.
What’s happened in the weekend just past will surely figure in the analysis (soon to be commenced) for the upcoming release of the GenInsights Quarterly Updates for Q3 2023 instalment in the expanding series.
(F) FCAS prices
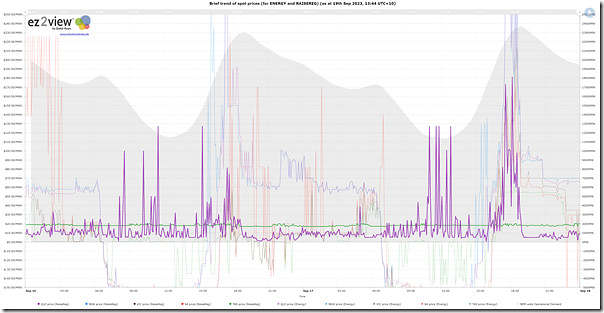
Worth a quick note to also highlight the sometimes elevated FCAS prices seen over the same period … probably in part because of lower numbers of units operational through the low demand periods (hence fewer options to supply some of these services).
In the chart above (which can be configured in ez2view and NEMreview v7 ) I’ve trended spot prices for ENERGY and also Raise Regulation (one of the 8 x FCAS services currently procured by AEMO … soon to expand to 10 x services with the addition of FFR from Monday 9th October 2023).
Note that the RaiseREG price for TAS is separated from the mainland (all 4 x traces overlaid and shown in the QLD series colour).
That’s all I have time for, at present – clearly there is more that could be analysed and reported on, but this will do for now…


Good illustration of the flexibility of large-scale solar (and no doubt wind) responding – via the price mechanism – to the inflexibility of its small-scale rooftop PV cousin.
It’s worth pointing out that *which* large scale generators reduce output in these events isn’t directed by AEMO for security or similar reasons – which is a common implication of the term “curtailment”.
What’s happening is normal market-based dispatch, driven by the prices at which generators have offered their output. We don’t say that there has been “curtailment” of coal-fired or other conventional generators in these events when they bid their output down to mingen, so I’m not sure why we should label large scale solar or wind bidding and responding to market prices as “curtailment” either.
If AEMO had needed to step in and have distribution companies reduce rooftop PV exports or trip inverters offline for stability reasons, that would certainly constitute “curtailment”.
Thanks once again, Allan
Reminds me that on 9th May you wrote ‘Renewable curtailment – forced and not quite so forced’ that explains more…
Might help some readers here, as well.
Allan, at Squadron we use ‘economic curtailment’ and ‘grid curtailment’ to distinguish between a market response and a binding constraint equation. We VRE are used to semi-dispatch caps ‘curtailing’ our generation and that does not discriminate between a market response or a bidding constraint. We also don’t get to withhold our fuel until prices rise, so I guess it ‘feels’ more like a curtailment.
Just offering some context… Nothing wrong with your comments 😉