
I have been mulling over this article on Inertia for some time, in between various GVSC client projects we have on the go at the moment.
Whilst lots of people talk about inertia and throw it around as a knowledge statement, it’s likely that a reduced number really understand both its importance and relevance:
- To me there are some similarities to what was the case back in 2017 which prompted me to write the article ‘Let’s talk about FCAS’, which:
- Preceded an increased level of awareness, and understanding, of FCAS across the NEM; and
- I understand still garners new readers even 6 years later on WattClarity
- So, in a similar vein, I’m hoping that this article does the same.
Background
Hence, with the very first Generator Report Card in 2018, and for various iterations and updates since, we (GVSC and GR) developed and refined methods to calculate inertia at the 5-min level.
- Part of what was included in the GRC2018 was later published in August 2019 in this article about ‘Calculated level of inertia in the South Australian grid, supplied by synchronous generation plant’.
- Our recent sections from the GenInsights Quarterly Update for Q1 2023 are shown below.
Since September last year, it has also been great to see regional inertia levels at the 5min level in AEMO-supplied constraint data, with Global Roam also putting it into their ez2view product as shown below.
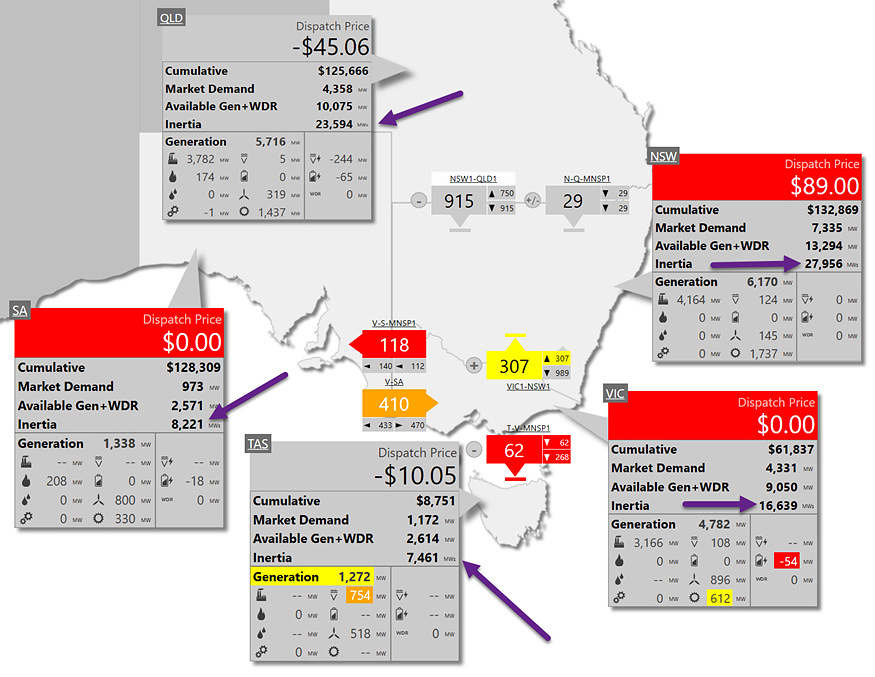
These are good developments for adding understanding to the dynamics of the power system.
As well as understanding the live inertia, we also trace the longer-term trends and quarterly highs and low, and more importantly, why they occurred. This is what we have been doing regularly in our Quarterly Insights for clients of that product since Q3 2022.
- Therefore below, we have extracted Section 5.1 from GenInsights Quarterly Update for Q1 2023, which details are few days that were observed using the high-level quarterly view, shown below both for the NEM as a whole and regionally by fuel type contribution.
- We’re currently compiling the next update to this Quarterly series.
Section 5 from GenInsights Q1 2023
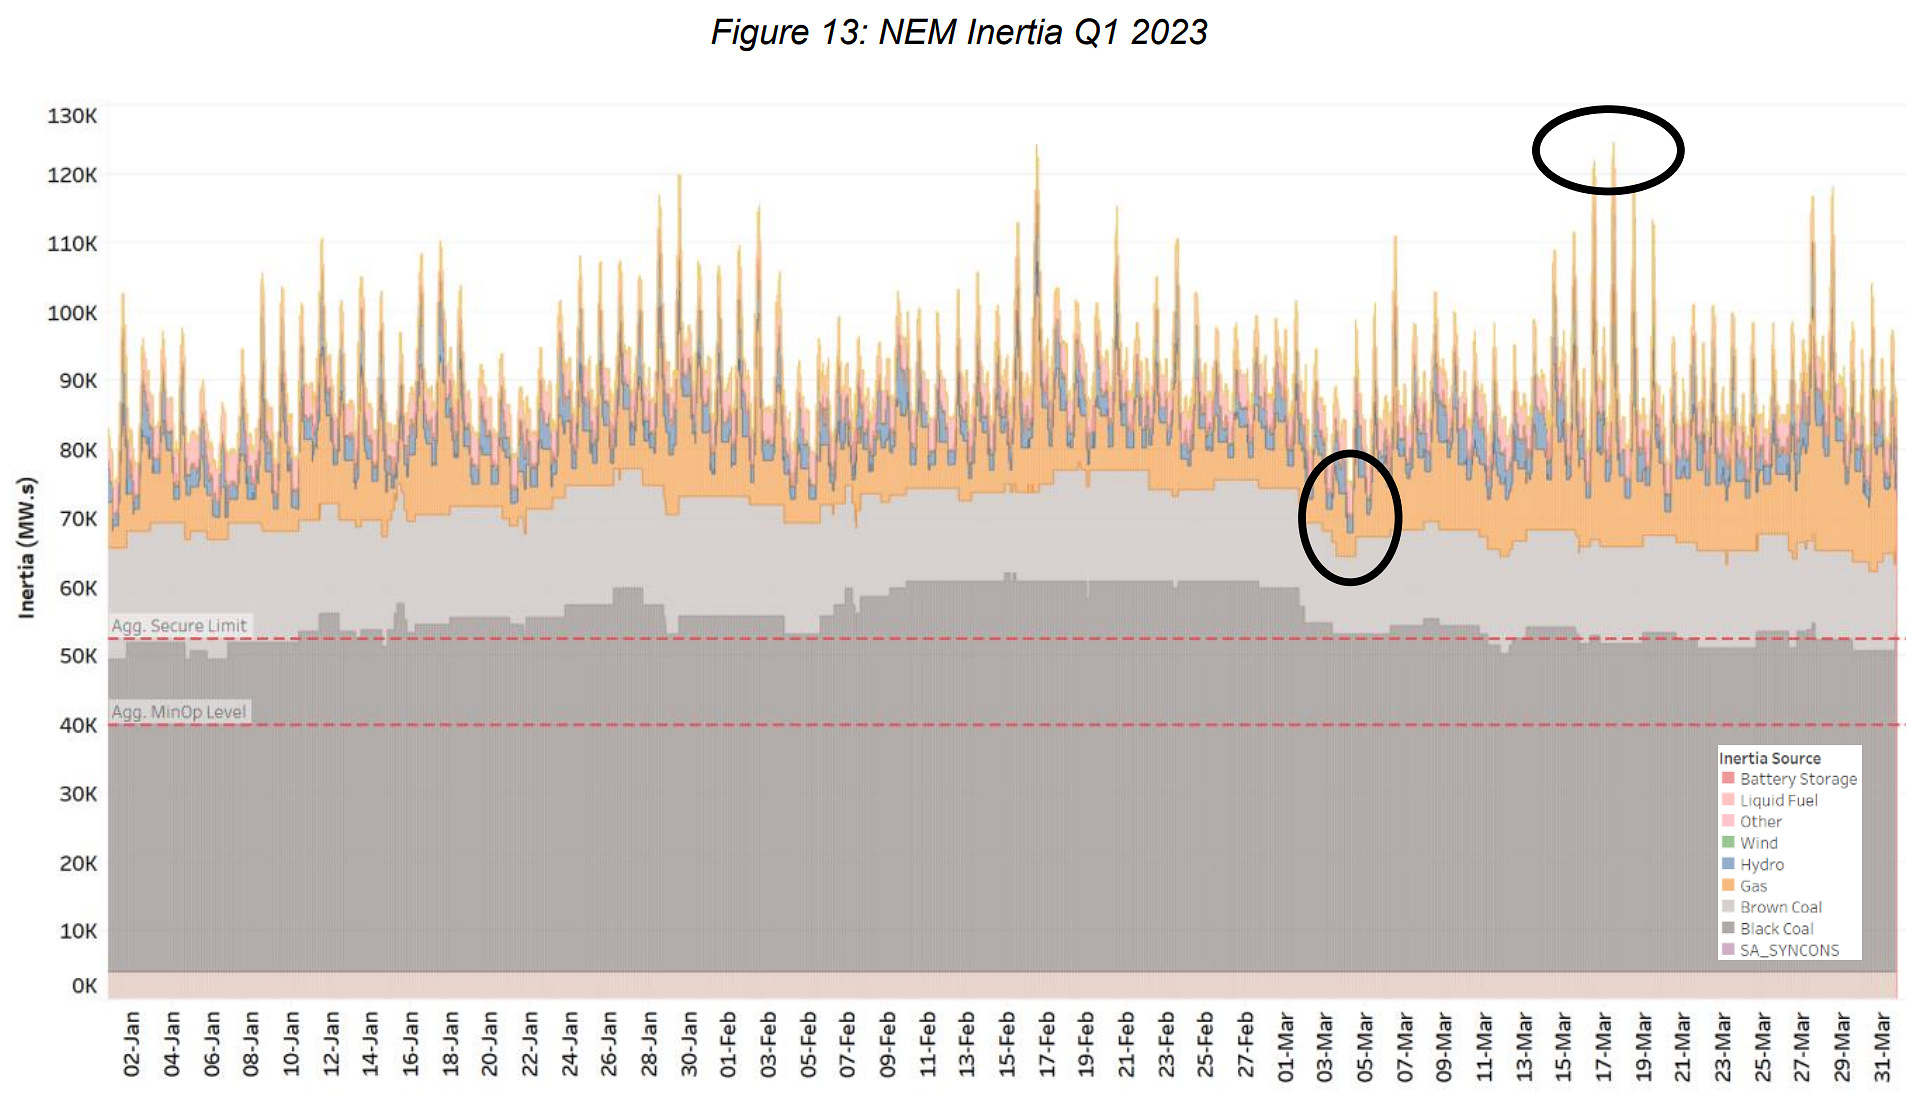
In section 5 within Appendix 1 of GenInsights Quarterly Update for Q1 2023, we began by including the following two high-level trends for calculated inertia, using our proprietary bottom-up methodology highlighting the contributions of different types of technology.
——————— START OF EXTRACT ————————
In the first image, we show aggregate inertia right across the NEM on a trended instantaneous (i.e. 5-minute) basis through Q1 2023. Technology types have different colours.
In the second image, we show the same data but at an individual region level.
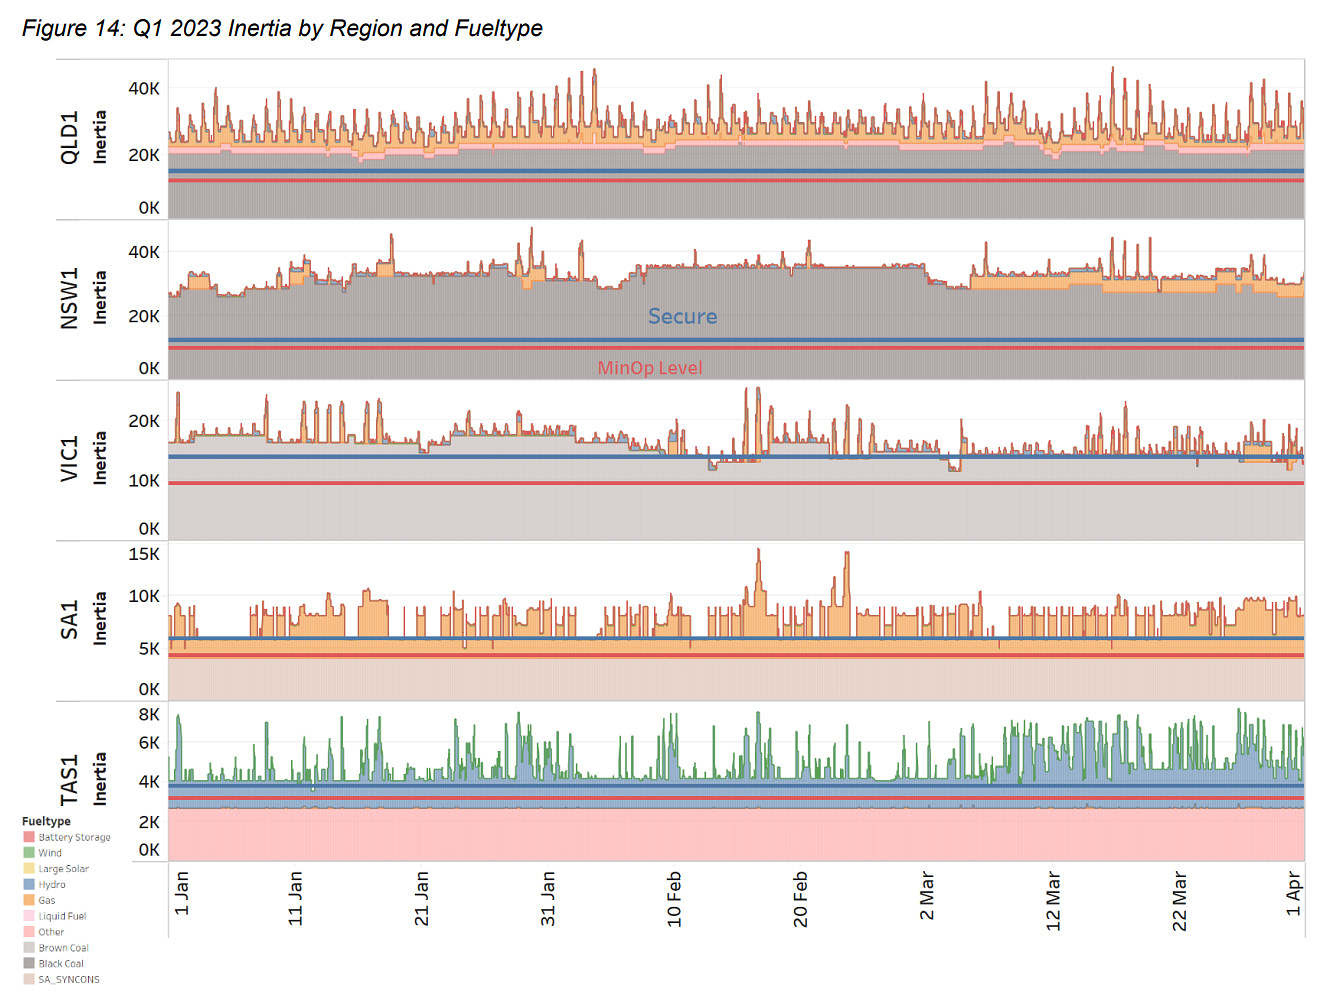
At a regional level, a couple of things stand out when combined with AEMO limit levels:
- SA is extremely dependent on the 4 x syncons with flywheels
- VIC/TAS/SA all have periods where it is touching on AEMO’s Secure operating limits
- NSW and QLD are well above the AEMO limit levels
In each Quarterly Update, we’re including one or more Case Studies of specific incidents. In this article on WattClarity we have copied in one of the two case studies of events in Q1 2023.
5.1 Specific Incidents
Included below are several case studies during periods of interest in the NEM.
5.1.1 Lowest Inertia on 4th March 2023 (NEM-wide and SA)
On a NEM-wide basis, the two different sources of inertia data (i.e. from AEMO and derived internally) are trended around Saturday 4th March 2023 – the day with lowest NEM-wide calculated inertia for the quarter. The day before and day after are also included to show the progressive decreasing coal generation decommitments and subsequent drops in inertia.
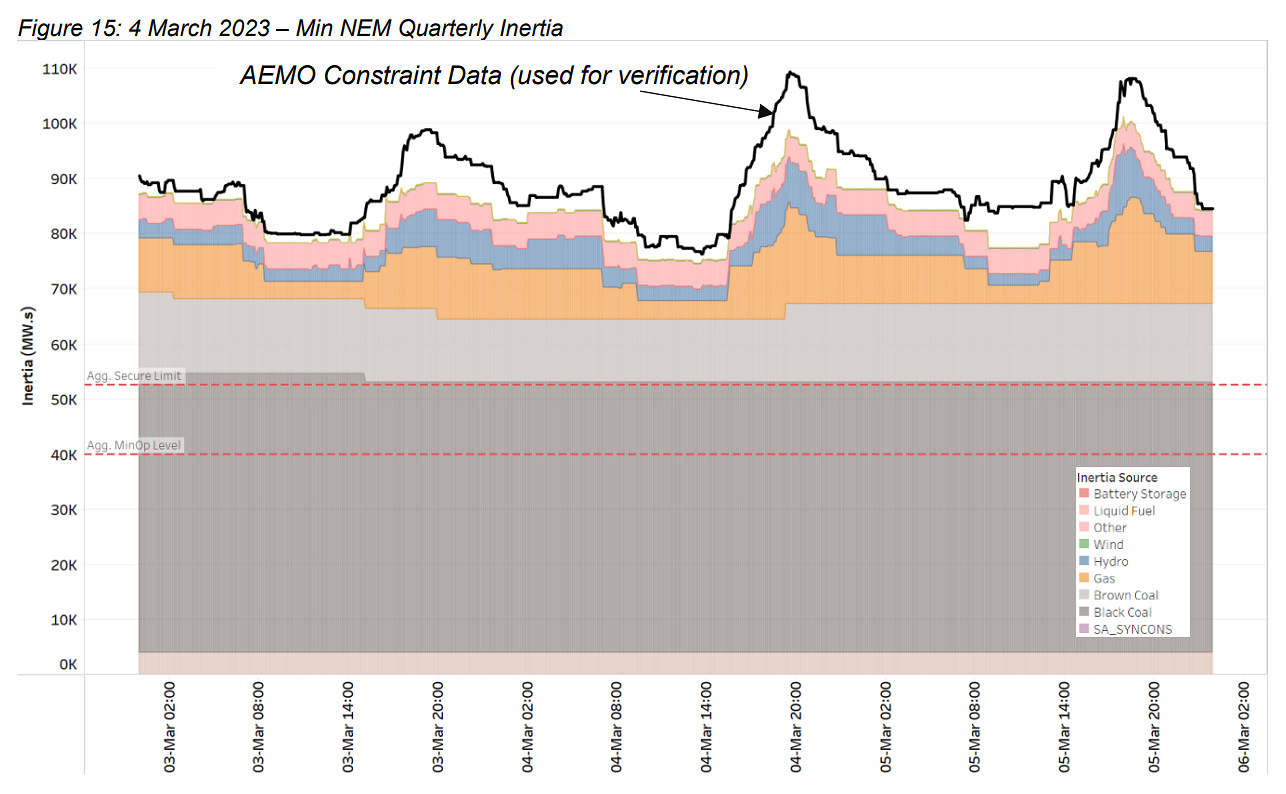
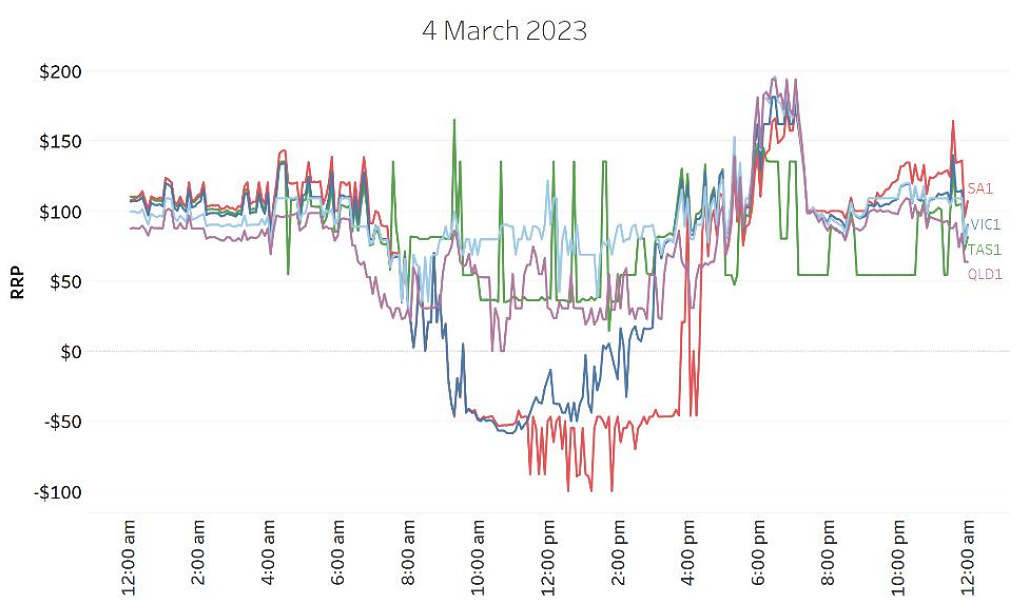
Furthermore, the RRP on this Saturday, under very high solar conditions, RRP in SA and VIC was below $-40 for much of the afternoon. The decommitment of gas generation that occurs on the 4th March highlights the challenge of balancing all the various factors of RRP, unit stability, interconnection and power system security.
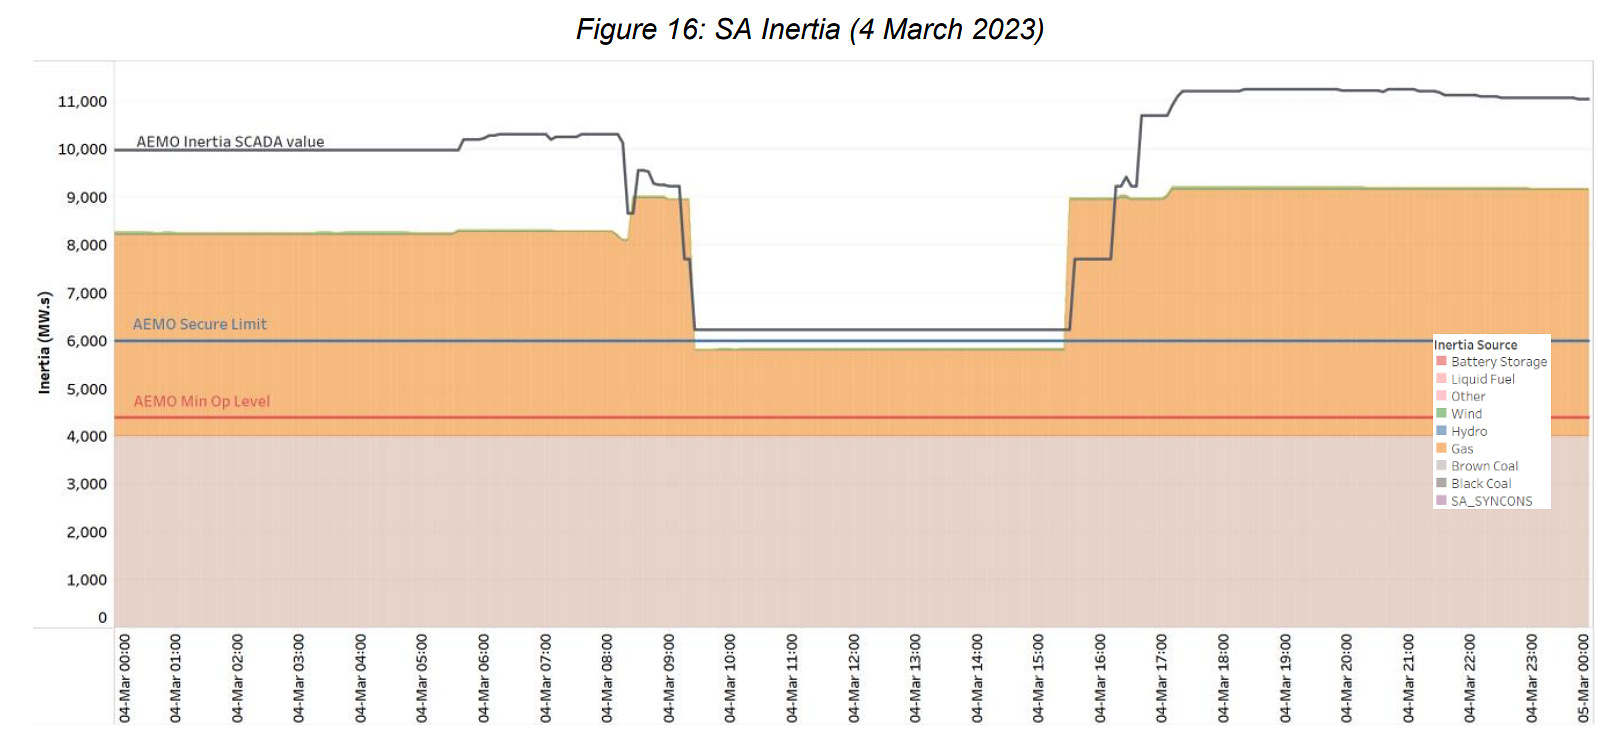
The below figure shows SA inertia estimates, in conjunction with the AEMO SCADA information. It shows SA inertia falling after PPCCGT shut down for the midday trough (as it had done the day before), only to restart around 4pm. It clearly shows SA operating near the AEMO Secure Limit for SA, with our bottom-up calculated value summing to just below the Secure Limit, whereas the AEMO SCADA value is just above the Secure Limit (we assume this is what AEMO uses for its references).
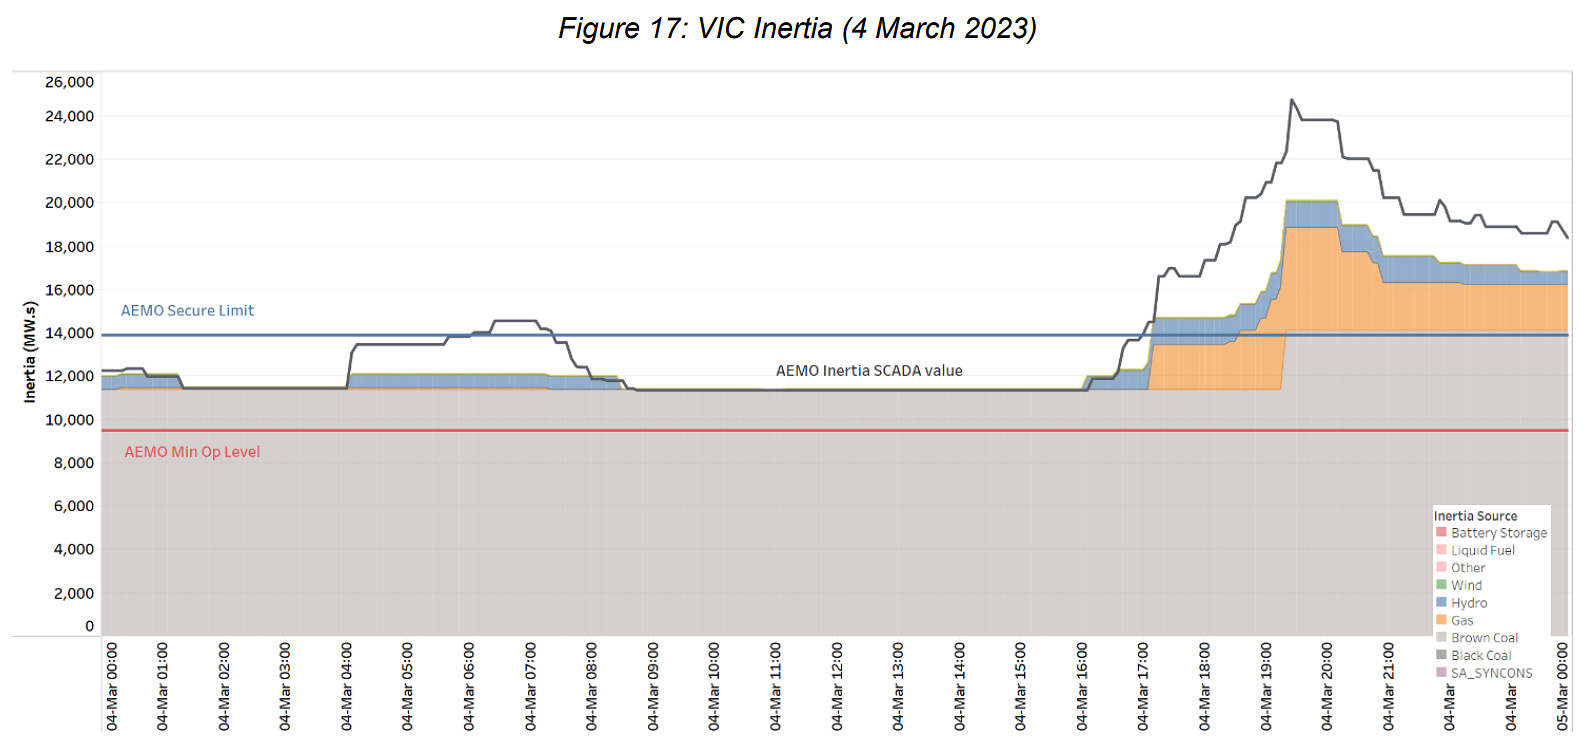
However, in VIC on the same day (also seeing very low prices), we see both metrics under AEMO Secure Limit. Our internal method calculated values showing that it was under until after LYA2 restarted late on 4 March.
On this day, the two AC interconnectors between VIC-SA and Vic-NSW were online and available, albeit constrained, hence the RRP separation.
The Figures show the decommitment of VIC and SA generation in the early morning due to low prices, mixed with other plant outages, resulting in VIC & SA inertia dropping below each of their individual regional Secure Limits in both AEMO’s SCADA data and our methodology.
A single trip of a Loy Yang A or B unit (which each contribute ~2300MWs of inertia to the system), would have taken both SA and VIC below their MinOp level. Thankfully on this day, which did not occur and an LYA2 unit returned to service.
——————— END OF EXTRACT ————————
What does all this mean?
The most important aspect is to understand that inertia is CONSTANTLY changing within the power system – it is a live and dynamic value that needs to be understood in dispatch and predispatch timeframes. As can be seen in the VIC and SA only charts for 4 March, at the moment the unit is committed or decommitted, the inertia value steps up or down as inertia is a very binary value (on or off). And while it is good that SA syncons do provide ~1000MW.s of inertia each due to the addition of flywheels on those devices (most syncons do not have flywheels!), the devices are not like-for-like replacements for dispatchable units … they do not provide active power and constantly consume power.
The next most important element is to understand how much of the NEM’s power system inertia is coming from coal and gas fired units – well over 80% most of the time if not more – hence the stable system we have now is because of those units. And while there are 2 or 3 BESS now providing grid forming capability and the addition of BESS will add fast-frequency response will continue to increase, the addition of BESS will need to occur simultaneously with the addition of wind and solar if they are to replace coal generation. We have installed 17000MW of wind and solar and just 1000MW BESS in the past 10 years – these need to occur more simultaneously or in hybrid configurations going forward.
As we worked through these inertia estimates, it became clear that there are still many missing datasets in this space that need to be developed such as consistency on BESS H constants, syncon status of generation and network equipment (especially when it comes to hydro units) and that additional network equipment contributions require further effort.
We will continue to refine and update these calculations, especially as we update the data in preparation for the next update of the Quarterly Insight for Q2 2023. If anyone is interested in further information, please reach out.
P.S. Inertia in the ABC
As this article was being finalised, we noticed Daniel Mercer had written ‘Australia’s energy transition is sparking a search for the new ‘glue’ to hold the system together’, in ABC news, linking many of the topics from above into the article.
Inertia is best understood as short term energy storage which is used to absorb/release energy in response to changes in the supply-demand balance. It is not an objective in itself, it is a tool to maintain stability of voltage and frequency.
It should also be remembered that synchronous machines can’t actually deliver much of their stored energy. For example, if the maximum frequency excursion is limited to 0.5 Hz Then a rotating machine can only absorb or supply 1-(49.5/50)^2 of its inertia so a 500 MW steam turbine with an Inertia Constant of 9 or 4,500 MWs of inertia can only convert about 90 MWs of energy. If the frequency change occurs over two seconds it is an average power of 45 MW. A 50 MW battery could supply both the power and the same energy, but if the frequency decline persists, then there is no more inertia available and the governor response firstly has to replace the lost inertia of the steam turbine i.e. return the 90MWs and then start to make up for the shortage of power in the system. The battery is just adding power and energy back to the system from the get-go. Without going into the boring details, for the first few seconds gas turbines are even worse because they have around half the inertia of a steam turbine and engine power drops if speed (frequency) falls so the governor response has to be even more vigorous.
If generation can respond fast enough the system needs very little inertia, in fact inertia can become a hindrance. Many years ago, in machine tool design it was considered necessary that the inertia of the motor should be at least 3-4 times the inertia of the load so to accelerate the load a torque of 5-6 times the nominal load torque had to be applied. Now it has been realized that if the control system can detect errors quickly enough and the power amplifier has a very high rate of response on the power curve, lighter more accurate systems can be built with low inertia motors with as little as 1/10th of the inertia of the load because now total torque is only 1.1 times the load torque so less energy is required to correct errors.
The same is true in reciprocating engine design where engines 50-80 years ago had huge flywheels to stop them over-speeding if load fell or stalling if load increased abruptly, now with high resolution speed and torque sensors, micro second control of fuel injection and low inertia flywheels, diesel gensets, sportscars etc can ramp power up or down almost an order of magnitude faster than their 1950’s predecessors, so better load matching with less inertia
Similarly in a power system if the output of a battery can be ramped up or down by full capacity in 150 ms then it can contribute/soak up far more energy than the inertia of a steam or gas turbine. Some years ago, Eire Grid determined that a 10 MW battery contributed as much to grid stability as a 100 MW gas turbine. Partially curtailing or reducing curtailment of a solar farm can have a similar effect and because wind turbines are asynchronous they can contribute much more of their physical inertia while still maintaining frequency and of course in the case of over-frequency the inverters on wind or solar farms can reduce power safely far faster than thermal generators. Even reciprocating thermal power plants which have relatively low inertia can partially make up for that by having very high power ramp rates as long as the gain on the governor system is set appropriately.
Then there is the load inertia to consider, large fans pumps etc and the inductance of the transmission and distribution system all contribute to system stability. Now many modern motors are connected via VFDs so that decouples their inertia but other systems such as fans or pumps have the added benefit that the load drops as the square or even higher power of frequency, so not only does the system gain the mechanical inertia, but a useful reduction/increase in load.
When all of the above is considered and control schemes are reconfigured appropriately it is likely that in the future, the system frequency will be maintained at or better than current levels with less than 1/10th of the inertia now thought to be necessary
Peter, I’d like to introduce you to my electric-arc furnace.
We’re creating a grid that is no longer fit for industry-purpose.
I invite Mr Farley to review his statements that gas turbines supply less inertia than an equivalent steam turbine, and that mechanical inertia is increased by the use of variable speed drives.
Jonathan, you arguably should have taken Peter to task for besmirching your excellent article.
Peter: inertia is not kinetic energy. You need to go back to the source, Isaac Newton.
Inertia is resistance to velocity change. A T/G has the same inertia when it is at rest as when it is at 2,970 rpm (49.5 Hz) or 3,000 rpm and the same whether it is generating 50 or 500 MW.
You also appear to be confusing energy and power. In your example, when the frequency started to drop the T/G was delivering 500 MW. At 49.5 Hz, if its AVR took no action, it would be delivering ~490 MW – the drop due to the drop in voltage due to the drop in speed/frequency.
If the drop in frequency occurred in 2 seconds the T/G delivered ~990 MWs of energy to the system (in those 2 seconds) not 90 MWs. How much of this came from a decline in the T/G’s kinetic energy is irrelevant.
Yes, a 50 MW battery only takes a tiny amount of time to start delivering 50 MW, and if we ignore that short delay and any tiny power decline, the battery delivers 100 MWs in the 2 seconds. To deliver the same amount of energy in the time interval you need a 495 MW battery.
But that’s also irrelevant. This is about RoCoF and the inertia of the T/G was in play immediately.
The system is in need of inertia to slow the rate of RoCoF and of power to reverse the decline.
To be harsh, if the decline was caused by the 500 MW tripping a bit more than a 50 MW battery will be needed to halt and reverse the decline.
The battery is good for the secondary response and can give that service from a quiescent state. Whereas the T/G had to be operating and then, if designed to contribute to frequency control, could deliver another 50 MW in a minute simply by AVR and governor action (yes 50 MW of so called “overload”).
Fortunately the boffins in AEMO appear unswayed by your arguments. AEMO’s 2023 system inertia report agrees batteries can contribute to solving the problem of declining inertia, so can syncons particularly if they have flywheels as in SA, and grid forming inverters.