
The events of Tuesday last week threw up a plethora of questions about power system and market outcomes – quite separate from the very extensive damage to distribution system assets that storms wrought across the state causing power outages in wide swathes of territory, which have rightly attracted the most public attention.
A great starting point for a technical overview – aside from WattClarity’s own growing collection of posts – is AEMO’s Preliminary Operating Incident Report, published in what must be record time last Friday.
This post will aim to cover many of the more detailed questions about large-scale renewable generation trends raised by Paul in his earlier market-wide scans of generator bidding behaviour, and then looking into the four-second SCADA data.
I’m aiming to do this with a single chart, so without further ado, here it is:
 (probably best to open this on a second screen if you plan to follow along)
In the remainder of this post I’ll unpack what this is showing, starting with an overall guide to the chart.
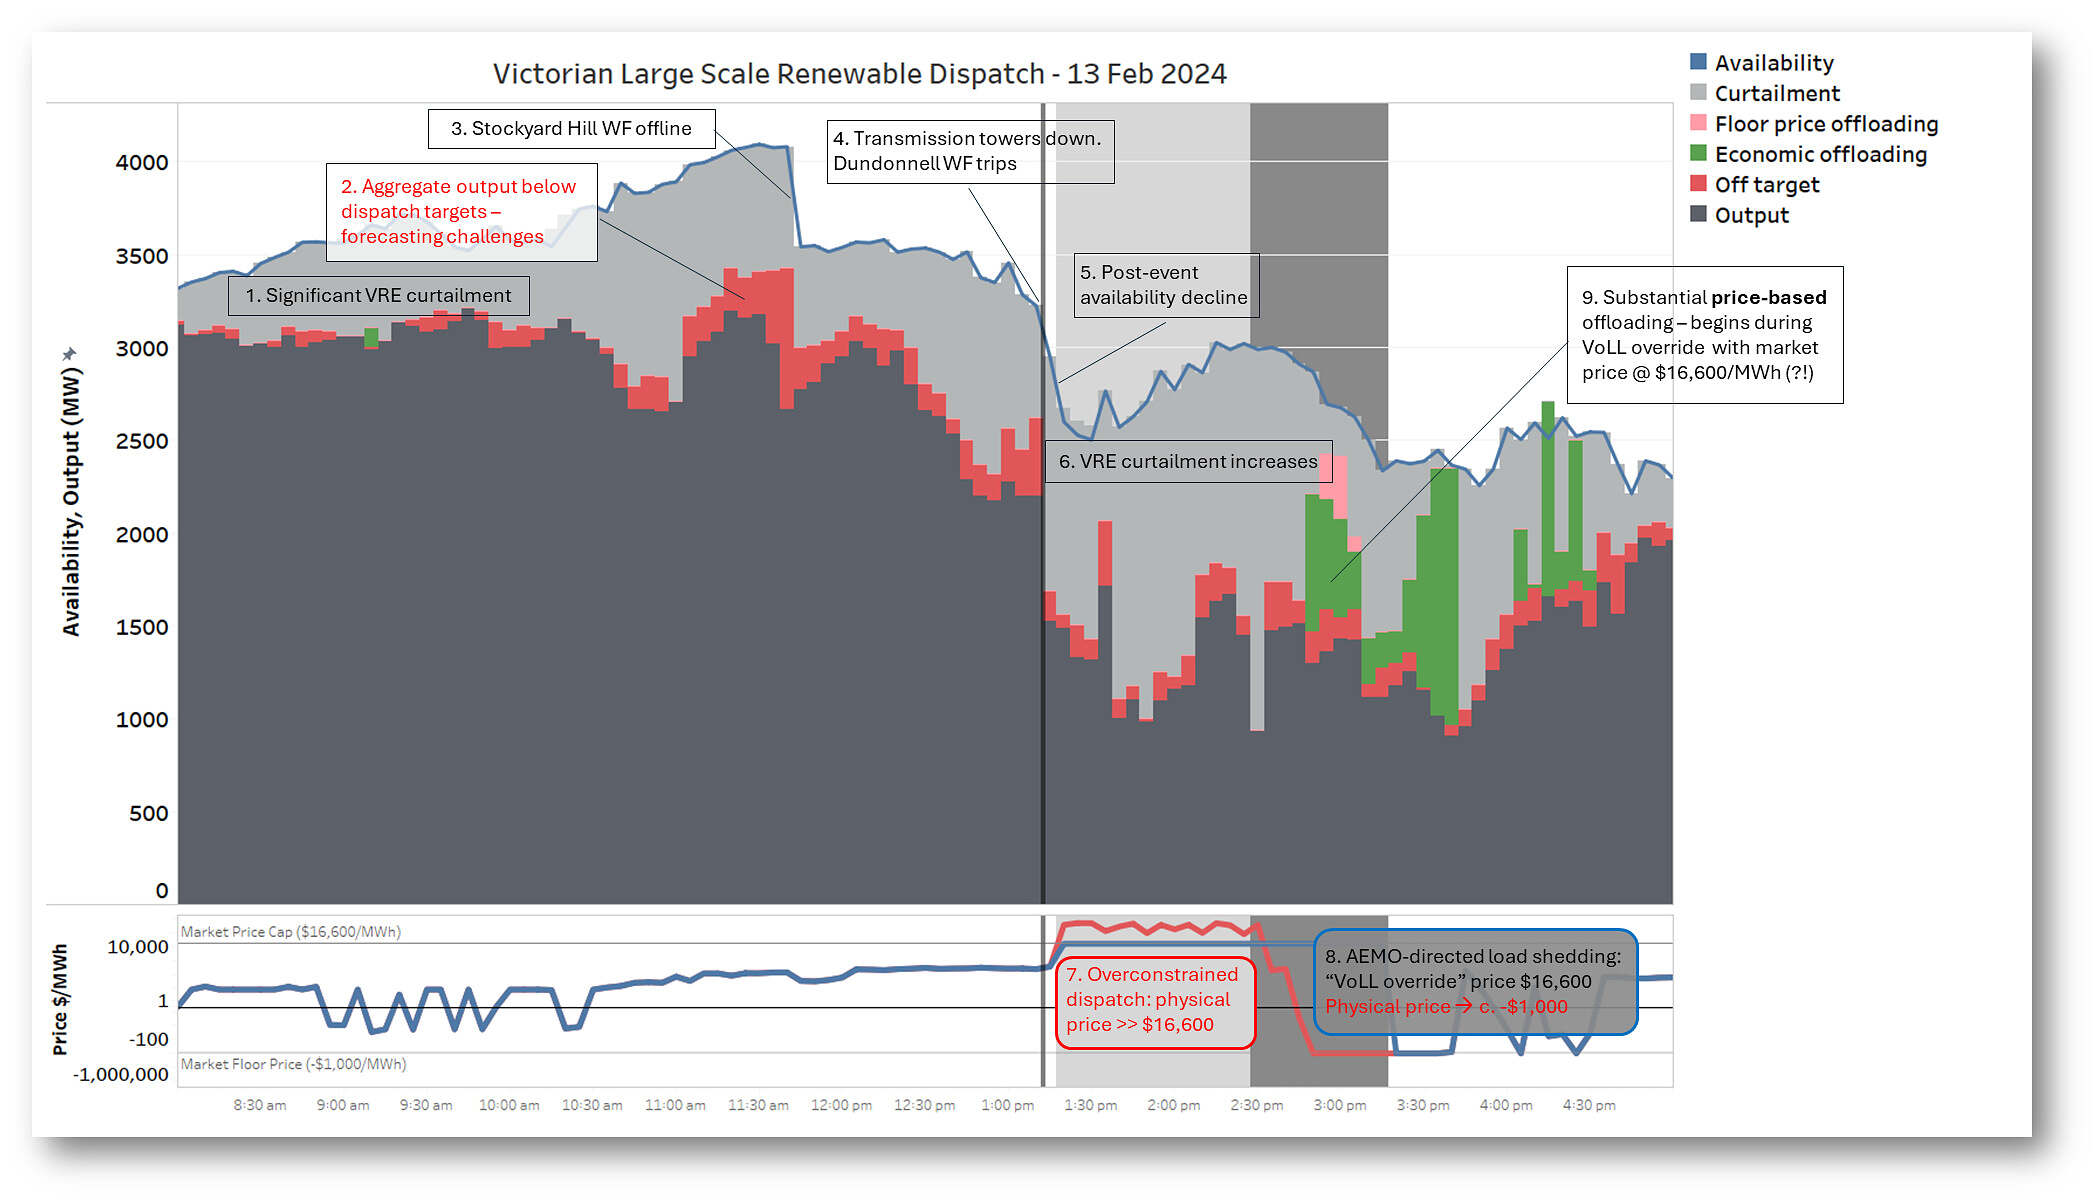
- The busier upper panel is showing the aggregate availability (potential output) from all Victorian large-scale wind and solar producers between 8am and 5pm on the day, the actual output from these assets, and the breakdown of the gap between the two – potential output that didn’t get generated for one of multiple reasons. The data granularity is five-minute market dispatch intervals.
- The lower panel shows the Victorian spot price in blue, but also (where it differs) the physical dispatch price in red (note the log scale). I’ll come back to what this second price is about – it’s clear that not even all market participants fully grasp its meaning.
From here I’ll follow the numbered annotations on the chart to unpack what was going on across the key parts of the day.
1. Significant VRE curtailment
From the start of the period charted we see a growing gap between availability and generated output, coloured light grey and representing curtailment of output from wind and solar sources (variable renewable energy, or VRE). Potential output grows from the start of the day, but actual output stays relatively flat.
Curtailment here means available output that is not dispatched even though it is offered at a lower price than the market dispatch price.
In general this curtailment arises from various limits on the transmission system reflected in constraints on market dispatch. It tends to particularly impact renewable generators which typically bid their output at low offer prices seeking to maximise their generation. With growing concentrations of solar and wind farms in parts of the power system with limited transmission capacity, periods with plentiful wind and sunshine like last Tuesday morning often see significant curtailment.
2. Output below targets
Picked out in red is any net difference between output targets for renewables and their actual delivered output. Output targets are produced by the market dispatch algorithm – NEMDE (National Electricity Market Dispatch Engine) – as it seeks to balance supply and demand at least cost, taking into account:
- participant supply (and scheduled load) offers,
- market demand levels, and
- transmission and other system security constraints
In the case of VRE, an important parameter for supply offers is forecast availability which can vary quite widely in each dispatch interval. Much more detail on this topic is available (!) in a great WattClarity post by Linton Corbet.
Even five minutes can be a long time in weather terms (especially here in Victoria), so these forecasts can be too high or low. Furthermore, other drivers of plant performance might change, meaning that VRE generators may end up off target.
VRE generators’ control systems can readily withhold any “excess” potential output above their targets. Under the market rules semi-scheduled VRE generators are obliged to do so:
- when impacted by constraints, or
- when some or all of their output is bid at offer prices above the market price and NEMDE “economically offloads” them – just like any other generator offering above the market price.
But in the converse case where an over-forecast (or sudden clouds or wind lulls, etc) mean they have insufficient potential output to meet targets, they can’t magic additional wind or solar energy from nowhere (unless they’ve got a “behind the meter” battery – something an increasing number are considering), and they end up off-target on the low side.
Because of the strong asymmetry I’ve just described, it should be obvious that VRE is much more likely to be off-target on the low side, than generating above its dispatch targets. The red area on the chart shows the net extent of this below-target behaviour last Tuesday.
We can see that this grew particularly in middle of the day. This growth reflects the challenges of accurately forecasting wind and solar output – even at short five-minute horizons – as strengthening gusty winds, fast-moving clouds, and storms developed across the state. And it was almost certainly one factor impacting system frequency and the need for AEMO to enable increased quantities of Raise Regulation FCAS as the day developed.
3. Stockyard Hill windfarm offline
The state’s largest windfarm went and remained offline after about 11:35 (NEM time) from output of nearly 500 MW, shown in the large availability and output drops at this time – and also a large off-target value, as it wasn’t forecast to happen. It’s since been reported that this was required due to firefighting operations in its vicinity.
Not related to Stockyard, but after this we also see a gradual, small decline in remaining aggregate availability, with a much larger fall in output leading up to 13:00, driven by increasing curtailment.
4. Towers down
At around 13:09 the main power system event unfolded, as six 500 kilovolt transmission towers near Anakie – well, “folded” seems apt – taking out two parallel lines between Moorabool and Sydenham. The immediate and general sequelae to this have been well covered in other posts. Concentrating here on impacts on VRE generation we just note that another large wind farm in Victoria’s south-west – Dundonnell – tripped from about 275 MW.
AEMO’s Preliminary Report makes it clear that this was in line with the design of a specific protection scheme for its section of the 500kV network. The small Yaloak South windfarm tripped as well, but at 23 MW output this was not material to events.
5. Other availability declines
On the heels of the event and the Dundonnell / Yaloak South trips, there’s a further net availability decline of about 400 MW over the next few dispatch intervals.
About three-quarters of this drop seems to have been at various solar farms even though their share of overall VRE availability at this time was only about 800 MW to wind’s 2,100 MW. Detailed analysis of which farms were affected and why will have to await a further post, probably by someone with more time than me.
6. Curtailment increases (again)
Just when the power system could have used more power, less of what was available was able to be dispatched from VRE sources, leading to a sharp drop in their aggregate output – well beyond the availability declines discussed above.
This was the result of the impaired power grid position following the collapse of the Moorabool-Sydenham lines and especially the rundown of all four generating units at Loy Yang A.
Two different sets of constraints started impacting generators in the west and north-west of Victoria even more strongly than had been the case from the start of the day. Loy Yang A’s 2200 MW going hors de combat meant that more power was trying to flow:
- eastward from western / south-western Victoria (where plenty of wind generation was still available despite the trips) via the lower capacity 220 kV system linking Melbourne to Geelong, Moorabool and places further west, and
- southward from Victorian hydro plant, Snowy, and New South Wales via Dederang and South Morang. This link also carries some flow from north-west Victorian renewable sources.
NEMDE did its best to balance things under duress, but had to more strongly curtail output from generation trying to get through these bottlenecks. Which brings us to the next issue …
7. OCD
… over-constrained dispatch. A phrase that still causes some AEMO people to break out in cold sweats remembering events of May-June 2022.
When faced with Hobson’s choice of:
- allowing power flows to exceed some of its normal security constraints, or
- failing to dispatch enough generation to meet demand,
NEMDE is programmed to violate some of those constraints – allowing a possibly insecure dispatch outcome in order to keep the lights on. This is achieved in as controlled a fashion as possible, with prioritisation of constraint violations according to their potential consequences, driven by pre-set constraint violation penalty factors.
I noted some of these constraint violations in a quick on-the-day post last Tuesday – notice that the constraint Left Hand Side values (LHS) are not less than the RHS numbers – even though they should be:
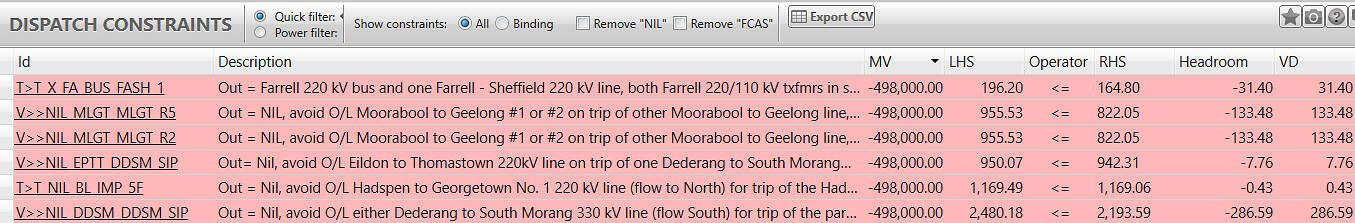
(technically this isn’t a chart, just for anyone counting)
Amongst other things, this goes some way to explain the ‘weird and wacky transmission transfer limits’ that Paul noted on the day – following a customer query.
This has many other consequences which I won’t cover here, but an immediate one is that the “physical dispatch price” – the underlying “raw output price (ROP)” for electricity, produced by NEMDE in every dispatch run – shoots up to many multiples of the $16,600/MWh Market Price Cap (MPC). This physical price got to well over $400,000/MWh last Tuesday, but because the MPC is – you guessed it, a cap – the market trading price was set to $16,600/MWh.
Despite this, and getting back to VRE, we don’t see any less curtailment through this OCD period – many renewables were simply in the wrong place at the wrong time.
8. Controlled load-shedding and “VoLL override” pricing
Over-constrained dispatch and violating system security constraints are not something AEMO can allow to persist. To urgently return the power system to a secure state, and with no prospect of the quick return of Loy Yang A, the sole arrow left in AEMO’s quiver was to instruct network companies to begin controlled rotational load-shedding, impacting about 90,000 customers. This began from 14:20 NEM time and within a couple of dispatch intervals returned the system to a secure dispatch configuration.
There was now enough generation to securely meet the (now artificially lower) demand, but whenever load is shed in this way, the market trading price gets set to the MPC – $16,600/MWh – under the so-called “VoLL override” provisions of the market rules. The basic idea here being to create incentives for as much generation as possible to bid available so that NEMDE can find a secure dispatch solution and ultimately so the load-shedding can be ended.
What’s less appreciated about “VoLL override” pricing is that with lower demand – because of both the AEMO-initiated shedding, and separate storm-driven distribution blackouts – and generators (mostly) offering at very low prices to get dispatched at the trading price of $16,600/MWh, the underlying physical dispatch price produced by NEMDE can suddenly crash to the other end of the spectrum as too much generation is offering at low prices to all get dispatched.
The “floor price offloading” of VRE generation highlighted in this period represents volume offered at -$1,000/MWh by wind and solar generators that wasn’t being curtailed by constraints, but still couldn’t be dispatched because the overall volumes offered at the floor were being scaled back by NEMDE to keep supply and demand in balance.
We also see large amounts of curtailment continuing here – the physical state of the network not having improved – but also some odd-looking bidding behaviour leading to price-based offloading while the market price was at $16,600/MWh. What?
9. Which price??
Multiple spot prices are confusing for everyone, especially it seems some bidding software, with automated bidding tools increasingly being rolled out across the NEM.
I suspect this could explain why in the latter part of the VoLL override period, when the physical dispatch price had crashed to -$1,000/MWh, but the financial trading price was still at $16,600/MWh (because controlled load-shedding was still underway), we see a significant volume of VRE generation “economically offloading”. Recall that this means generation which is being offered at prices above the spot price so is not being dispatched by NEMDE.
The sixty-four dollar question here is “which spot price?” It’s not the $16,600/MWh trading price being set by the VoLL override rules – NEMDE knows nothing about this. The relevant price for physical dispatch of generation is – you guessed it – the physical dispatch price*, sitting in this period at -$1,000/MWh (or -$999.99/MWh in a couple of intervals).
* This physical dispatch price is incorporated into the ‘Connection Point Dispatch Price’ (or CPD Price for short) that is featured in various widgets in ez2view, including the ‘Unit Dashboard’ widget and the ‘Constraint Dashboard’ widget. I expect you’ll see screenshots of these widgets in future articles exploring this event.
The only way, other than unusual constraint situations, for a generator to get its maximum share of dispatch during this period was to be offering its output at -$1,000/MWh. A skerrick higher and NEMDE would dispatch it off (or down as far as possible if it’s a slow ramping generator).
Without naming names here there were a group of VRE generators who, judging by the form of their rebid reasons, all seemed to be using the same bidding tool(s) and for a short period chose to offer output at well above -$1,000/MWh, as if confident that the $16,600/MWh market price would still see them dispatched. As the undispatched volumes highlighted in green show, it didn’t.
Wrapping up
Well done if you persisted this far. This was a complex event with all sorts of implications, and lots more detail to come. The terrible disruption of the blackouts at distribution system level and the physical integrity and robustness of the grid as a whole, in a world of fast-warming climate, are no doubt the biggest issues emerging.
For VRE generation generally, the impact of transmission constraints – and understanding their implications – again comes to the fore.
For individual participants, it again highlights just how arcane the NEM can be, and why a solid grasp of not just the fundamentals but the many vagaries of market operation is essential, not optional.
=================================================================================================
About our Guest Author
 |
Allan O’Neil has worked in Australia’s wholesale energy markets since their creation in the mid-1990’s, in trading, risk management, forecasting and analytical roles with major NEM electricity and gas retail and generation companies.
He is now an independent energy markets consultant, working with clients on projects across a spectrum of wholesale, retail, electricity and gas issues. You can view Allan’s LinkedIn profile here. Allan will be occasionally reviewing market events here on WattClarity Allan has also begun providing an on-site educational service covering how spot prices are set in the NEM, and other important aspects of the physical electricity market – further details here. |
I was interested to read Paul Simshauser’s research about dynamic transmission constraints. The main thing I took from this, and I probably took the wrong thing, was that if the wind is blowing then more transmission on a line is possible because by definition the line will be getting wind cooling.
I guess the transmission constraints through the NEM don’t generally reflect dynamic max load as opposed to hot day static max load?
It’s interesting to me that because wind and solar receive an AGC set point developed from a wind / solar forecasting model, that any variation in weather conditions (sudden strong winds, calm spells, clouds) cause forecasting errors, which require FCAS to correct, which increases cost and risk.