Our 16th Case Study in the series was published on Wednesday, dealing with a ‘simple’ case of extreme* under-performance on Monday 4th February 2019.
* in terms of ‘extreme events’, we’re specifically looking at Dispatch Intervals where there has been:
Scenario 1) more commonly ‘large’ collective under-performance across all Semi-Scheduled units (being measured as Aggregate Raw Off-Target > +300MW); or also
Scenario 2) much less frequently ‘large’ collective over-performance across all Semi-Scheduled units (being measured as Aggregate Raw Off-Target <-300MW).
If we skip forward one month, we arrive at Wednesday 6th March 2019, which is the focus of this 17th Case Study.
(A) Background context
Remember that we identified a total of 98 discrete instances where aggregate Raw Off-Target across all Semi-Scheduled units was either:
(a) above +300MW (representing collective under-performance) or, much less commonly,
(b) under –300MW (representing collective over-performance relative to AEMO’s expectations, seen in the Dispatch Target).
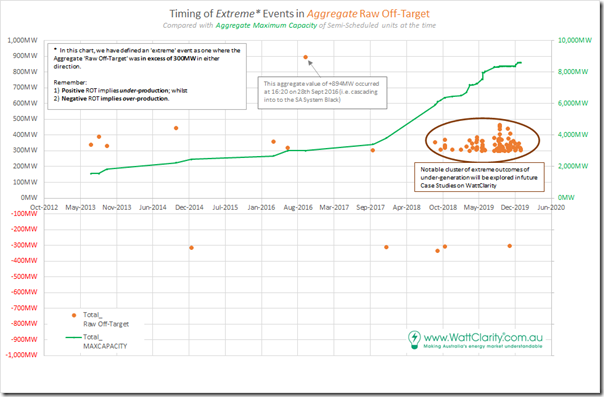
There was a smattering of only 10 cases through 2013, 2014, 2015, 2016, 2017 and through until August 2018. However thereafter (to the end of 2019) there was a sharp escalation of extreme incidents – as seen in the following chart:
Note also that we have not yet looked into 2020 data, which will be the focus of the GSD2020 (so we can’t comment on whether the trend from 2019 has continued to grow).
We’re doing this given a push from the AER Issues Paper, but moreso inspired by the deliberations by the (now defunct) COAG Energy Council and (extended?) ESB relating to ‘NEM 2.0’. Note that these case studies deal with imbalance in the Dispatch Interval timeframe, but readers should understand that there are other challenges that ‘NEM 2.0’ also needs to resolve, including:
Other Challenge #1) Within the dispatch interval timeframe, energy-related services focused on frequency maintenance and response to contingencies;
Other Challenge #2) Relating to ‘firmness’ of supply in the broader forecast horizon; and
Other Challenge #3) Others that we bundled into a ‘keeping the lights on’ services in our discussions in the Generator Report Card 2018 (for instance, in relation to System Strength).
In preparing these focused Case Studies, we’re seeking to understand why and what the implications are of this escalation.
(B) Summary results for Wednesday 6th March 2019
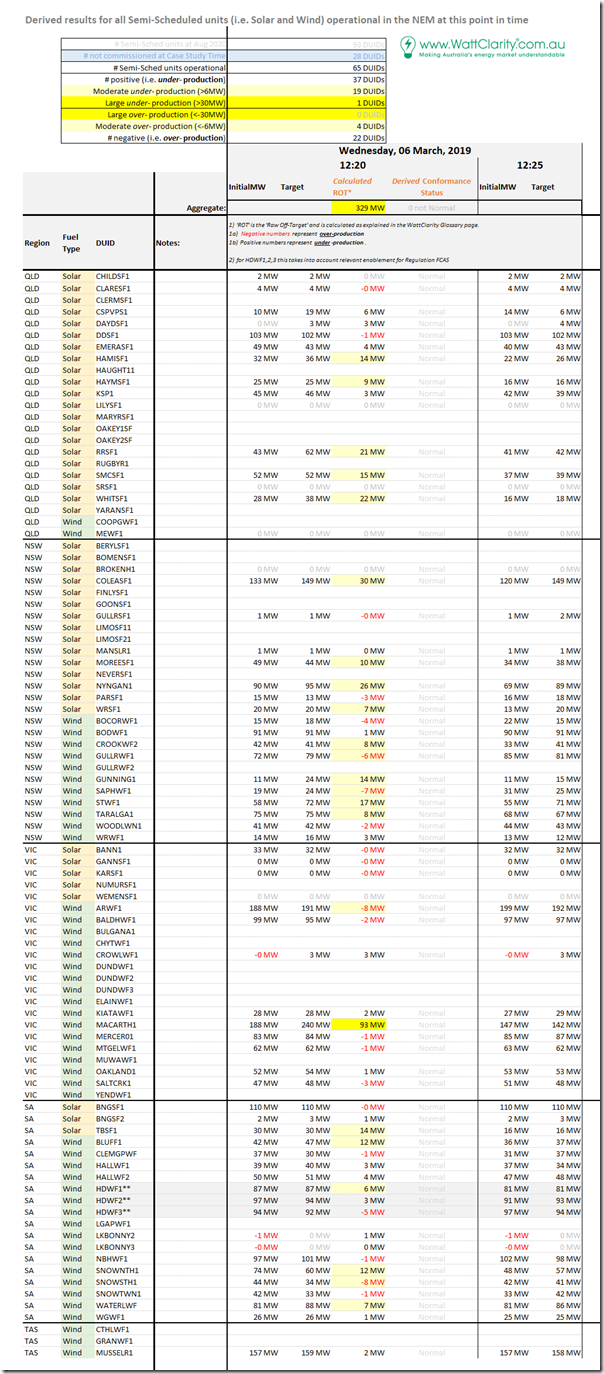
Here’s the same tabular framework of results for individual Raw Off-Target performance of all 65 x Semi-Scheduled units that were operational at the time:
In summary from this table, we can see the following:
1) Of the 65 DUIDs registered at the time, there are 165% the number under-performing (37 DUIDs) as there are over-performing (22 DUIDs).
2) Of the units highlighted as having Raw Off-Target greater than 6MW (a threshold that is one of the inputs in determining Conformance Status for a unit), we see the split is even more unbalanced:
(a) 19 DUIDs flagged as under-performing by at least 6MW (with 1 of these under-performing by more than 30MW); whilst
(b) Only 4 DUID flagged as over-performing by at least 6MW.
… which, needless to say, is a very skewed ratio (and not the first time we have seen it, either).
This is one more example we see where the commonly touted belief that I might paraphrase as ‘the unders and overs will average out’ just does not hold true, at least in many of these extreme events.
(C) Results for individual DUIDs
Once again we use the ‘Unit Dashboard’ widget in ez2view (and the ‘Time Travel’ powerful rewind functionality) to review what some of the core stats were for this point in time for each of the units flagged as having significant Raw Off-Target:
(C1) One DUIDs showing large under-performance
We’ll start with the three DUIDs that show Raw Off-Target of greater than 30MW, a quite significant deviation for an individual unit. Remember that the choice of what’s ‘large’ is a little subjective – however I have based it on two things:
Criteria #1) Practical considerations, like my time constraints in drilling into each – and also my sense of how long even a patient reader here might stay with me to get to the bottom of this (quite long) article;
Criteria #2) More holistically, though, I have also made the choice based on the fact that 30MW has been the historic threshold where a dispatchable asset must be registered with the AEMO and operate as a Scheduled Generator.
… Seems a good criteria to also use in looking at the growing number of invisible, and quite random ‘phantom generators’ we have entering the NEM which are operating as the ‘evil twin’ of a Semi-Scheduled generator which would be fully predictable in a dispatch time horizon through the AWEFS and ASEFS processes.
(C1a) Macarthur Wind Farm (+93MW under-performance) in VIC Region
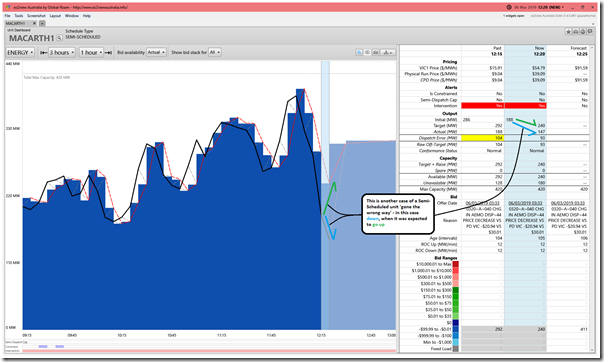
Here’s what MACARTH1 looked like:
In this case, we see that the unit ‘went the wrong way’ – one of the causes of significant Raw Off-Target we’re coming across in all of these Case Studies. In this case, the ‘phantom generator’ is 93MW in size – certainly not insignificant.
We’re becoming quite used to see Macarthur Wind Farm appearing towards the top of this type of league table, which is not really the KPI any Semi-Scheduled plant would like to excel in.
It’s not a surprise that MACARTH1 is turning up so often, as we’d already seen it was the ‘worst performer’ of any DUID through 2019 when reviewing data for all units published in the Generator Statistical Digest 2019 at the start of the year.
(C2) 18 other DUIDs showing moderate under-performance … compared with only 4 moderately over-performing
However, even if we subtract the +93MW contribution to the +329MW aggregate Raw Off-Target, what we are left with (+237MW) is quite sizeable in its own right. Clearly it is more than MACARTH1 which is to ‘blame’ here.
(a) Of the 22 units in total counted here, 4 had deviations greater than 20MW but under 30MW:
i. RRSF1 (+21MW) – another case of ‘gone the wrong way’ (albeit smaller – though aggregate DUID size will have been one factor in this),
ii. WHITSF1 (+22MW) – another case of ‘gone the wrong way’,
iii. COLEASF1 (+29.5MW) – another case of ‘gone the wrong way’, and
iv. NYNGAN1 (+26MW) – another case of ‘gone the wrong way’.
(b) Subtracting these four off the remaining under-performance still leaves +138MW.
I won’t drill further on this Case Study.


Leave a comment