On Thursday 23rd February 2023 we emailed our Annual Newsletter to our distribution list. In that newsletter we noted that we’d share a couple of snippets from the 198-page GenInsights Quarterly Update for Q4 2022.
Since that time we’ve shared on WattClarity one other excerpt from that report:
1) On Monday 27th February 2023 we published ‘Some revelations in GenInsights Q4 2022 about Self-Forecasting’ (pertaining to some Semi-Scheduled wind and solar farms).
2) Today (Monday 6th March) in this short article we’re sharing one of the main observations relating to coal units.
3) Time permitting we’ll share a couple other of these observations.
(A) Trended aggregate unavailability
Within this 198-page Update for Q4 we included a 33-page Appendix 5 that looks at different aspects of the performance of (and challenges with) the remaining coal units across the NEM.
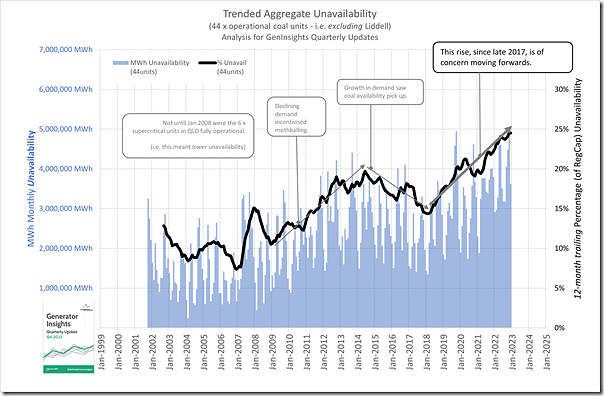
One of the key pieces of analysis that we’ve been including consistently in these ‘WattClarity Deeper Insights’ pieces of analysis stretching back to the GRC2018 (with data to 31st December 2018, following 20 years of operation of the NEM) has been this trend of the aggregate level of unavailability of still-operational coal units:
In the GRC2018 we ran this analysis over 48 x ‘still operational’ coal units but we’re now running the analysis across only 44 x coal units (i.e. excluding the soon-to-be-fully-closed Liddell) in order to ensure the results are longitudinally consistent across 24+ years of operation of the NEM.
So a couple quick observations:
1) As noted in the image itself, the headline observation is that the rising level of unavailability is of concern, moving forwards;
2) It should be obvious, but worth pointing out that the rise in unavailability above is not due to the declining performance of Liddell (because that station is excluded in the results);
3) It’s also worth noting that the climb in aggregate unavailability is also influenced (at least in part) but several long term forced outages, including:
(a) First and foremost, the 19-month-long (and counting) forced* outage of Callide C4 as at 31st December 2022 clearly meant Callide C4 was unavailable for the entirety of the calendar 2022 year.
… this alone will have added directly to the aggregate unavailability level.
(b) Second longest period of forced outage through calendar 2022 was, the long forced* outage for Loy Yang A2 ….
… that long outage added to a couple more during the year to total 5,233 hours of forced* outage.
(c) Third longest period of forced outage through calendar 2022 was a 3,577 hour period of forced* outage at Yallourn Unit 4 …
… not in a contiguous block but clearly part of the the reason why EnergyAustralia suffered a large loss and has announced remedial action.
(d) Less significant through the whole of calendar 2022, but dragging into calendar 2023, is the long-term forced* outage of Callide C3 following cooling tower failure:
… the 1,623 hours of forced* outage in 2022 represents 18.5% of the year.
—-
* for the avoidance of doubt, useful for readers to understand that the GenInsights Quarterly Updates reports now incorporate the use of internally developed techniques at Greenview Strategic Consulting to separately identify planned outages and forced outages.
—-
4) However it is also important to recognise that a number of coal units continue to operate quite well (in Allan’s analysis here he contrasted the poor performance of Liddell to the quite good performance of Stanwell and Tarong).
Oh, and it’s worth clarifying (e.g. in case some reader wants to try to replicate the above) that we have consciously chosen to use Registered Capacity (not Maximum Capacity) as the denominator in calculating Availability (hence Unavailability), for reasons explained in September 2022.
As noted there, this makes some sense for coal units, but would not be our choice for other fuel types (particularly solar farms, as Dan will echo in the coming days).
(B) Key Observation #3 of 6
In the 198-page report we included 6 separate ‘Key Observations’ that are styled on the 22 discrete ‘Key Observations’ that proved of so much value to those readers of GenInsights21.
I thought it was useful to copy in what we published as Key Observation #3/6 within the Q4 Update:
“Through this GenInsights series we have continue to report that the data shows:
· that coal units are not tripping more frequently than had been the case in the past (despite what you might have read elsewhere); but
· the units are collectively unavailable for a much longer period (or volume of energy) than was the case several years ago.
At the end of 2022 the 44 remaining coal units (excluding the 3 soon to close at Liddell) have collectively reached 24% aggregate unavailability. This is going to increasingly have implications for Reliability Planning into the future.
Of the 13 x coal stations assessed in this analysis (bundling 6 x supercritical units into a ‘Supercriticals’ notional station):
· only 5 (of 13) stations are operating with less than 25% unavailability.
· a number of the others are significantly in excess of 30% unavailability.
It’s not just Liddell that is troubled. “
We’ll continue to watch the performance of these coal units through the Quarterly Updates during 2023.
(C) Trended incidence of ‘Aggregate Raw Off-Target’ > 300MW
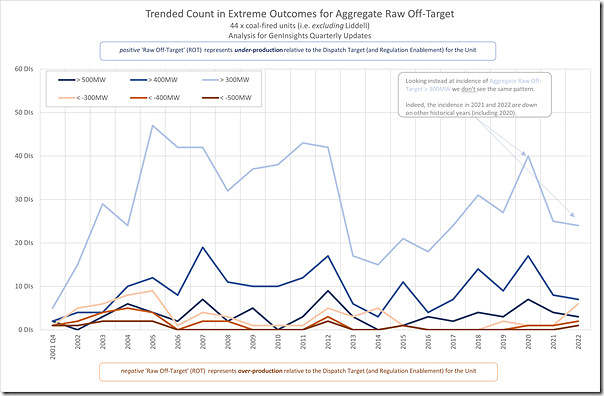
The comment above about ‘not tripping more frequently’ is likely to be a surprise to some readers, so it’s worth flagging how we determined this to be the case…
For a number of years we’ve been tracking three different metrics which each point to trended aggregate level of ‘Sudden Failure’ of coal units:
Metric #1) We’ve been trending a calculation of ‘Sudden Trip’ that was inspired by AEMO reporting in a QED back in 2018;
Metric #2) We’ve been tracking the metric of ‘Unit Starts’ (which those clients who have access to the GSD2022 can see down at an individual unit level); and
Metric #3) We’ve been tracking the incidence of large ‘Aggregate Raw Off-Target’ (AggROT) across (48 and now) 44 remaining coal units, as shown here:
None of these metrics are showing an increased incidence of units (as a whole) experiencing increased ‘Sudden Failure’ … though obviously some (like Liddell, as Allan showed) have been troubled.
For those who previously read the GRC2018 or GenInsights21 this observation won’t be a surprise.


None of this is terribly surprising. If the asset managers in the stations with announced closing dates are doing their jobs they will have started rationing expenditure on maintenance (both routine and particularly sustaining capital) so that the units are kept safe but will perform a graceful bellyflop on their last day of operation. This means you can expect increasing unavailability and particularly forced outage and derating where you start to increasingly operate on run to failure / breakdown maintenance. If you have no interest in the longevity of your units then this is the cheapest way of doing things. Just guard against catastrophic failures that can kill people and off you go. People outside the industry often don’t understand that a cheap little component can quite easily stop one of these big units. Given that these units have maintenance cycles measured in years and this is the reason you cannot easily change direction once you start going down this slippery slope. Plant engineers have been doing this for decades when they move to retire old power stations – so they know how to do it. What is different this time around is the process is being undertaken across many units simultaneously – many of which would normally have had many decades of operating life but simply they have had their revenue and hence commercial viability destroyed. Inevitably will end in an untidy outcome.