
2023 was the year of the big battery in the NEM. The year started with ten batteries registered in the market and ended with a doubling to twenty, with no signs of a slowdown.
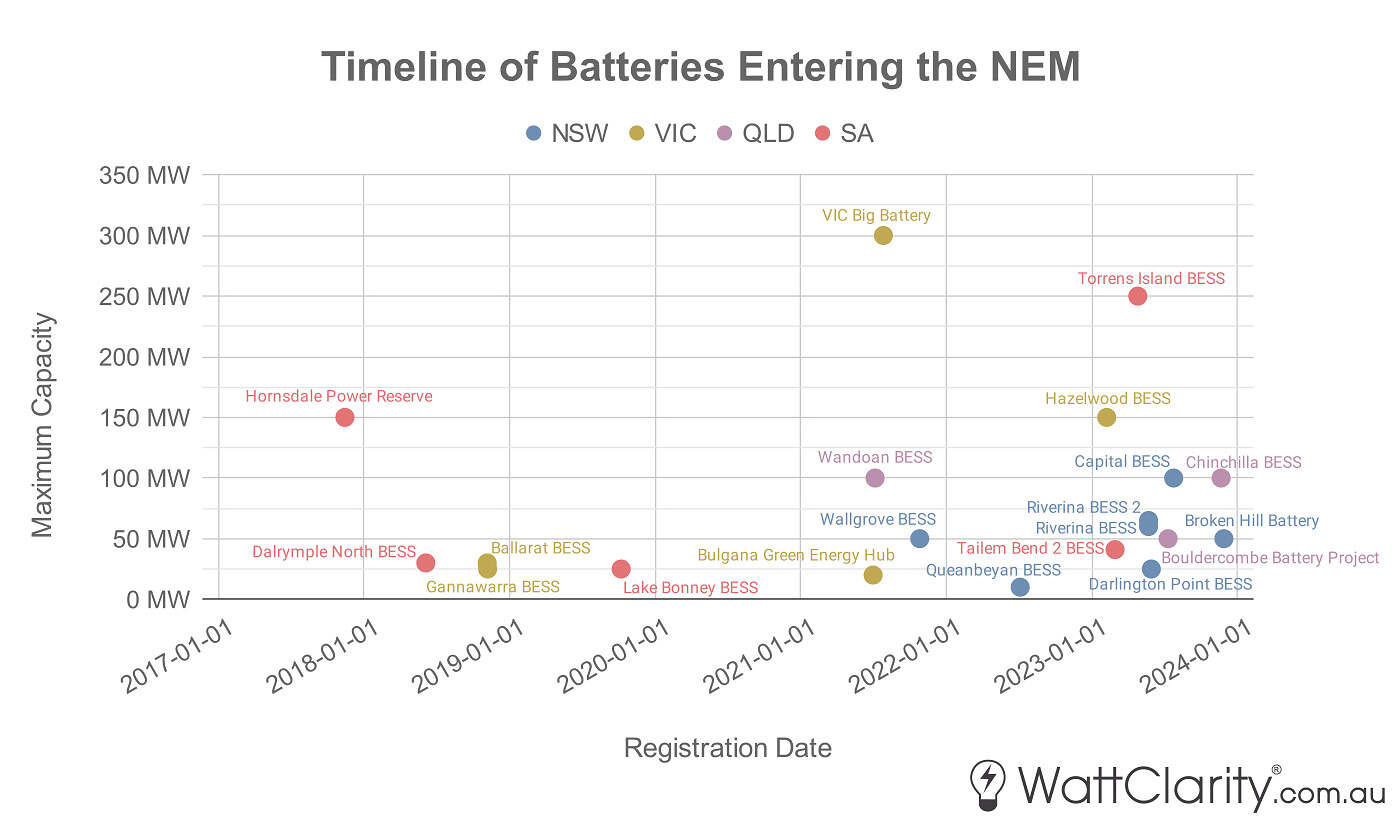
We saw a doubling of the NEM’s battery fleet throughout 2023
Note: Hornsdale Power Reserve originally had a maximum capacity of 100MW when registered in 2017, but this was expanded to 150MW in 2020. Only showing batteries with MW capacity equal to or greater than 10MW.
Our team has had a growing interest in batteries since the beginning of the current development boom – a surge that can be traced back to that infamous Elon Musk tweet. With the 2023 edition of Generator Statistical Digest published a little over three weeks ago, its release provided me with the opportunity to dissect what the market data is revealing about the battery storage boom.
To begin, I’ve charted the long-term monthly revenue for all batteries in the NEM, breaking down ‘market revenue’ by source. The chart begins with the first output of Hornsdale Power Reserve back in November 2017.
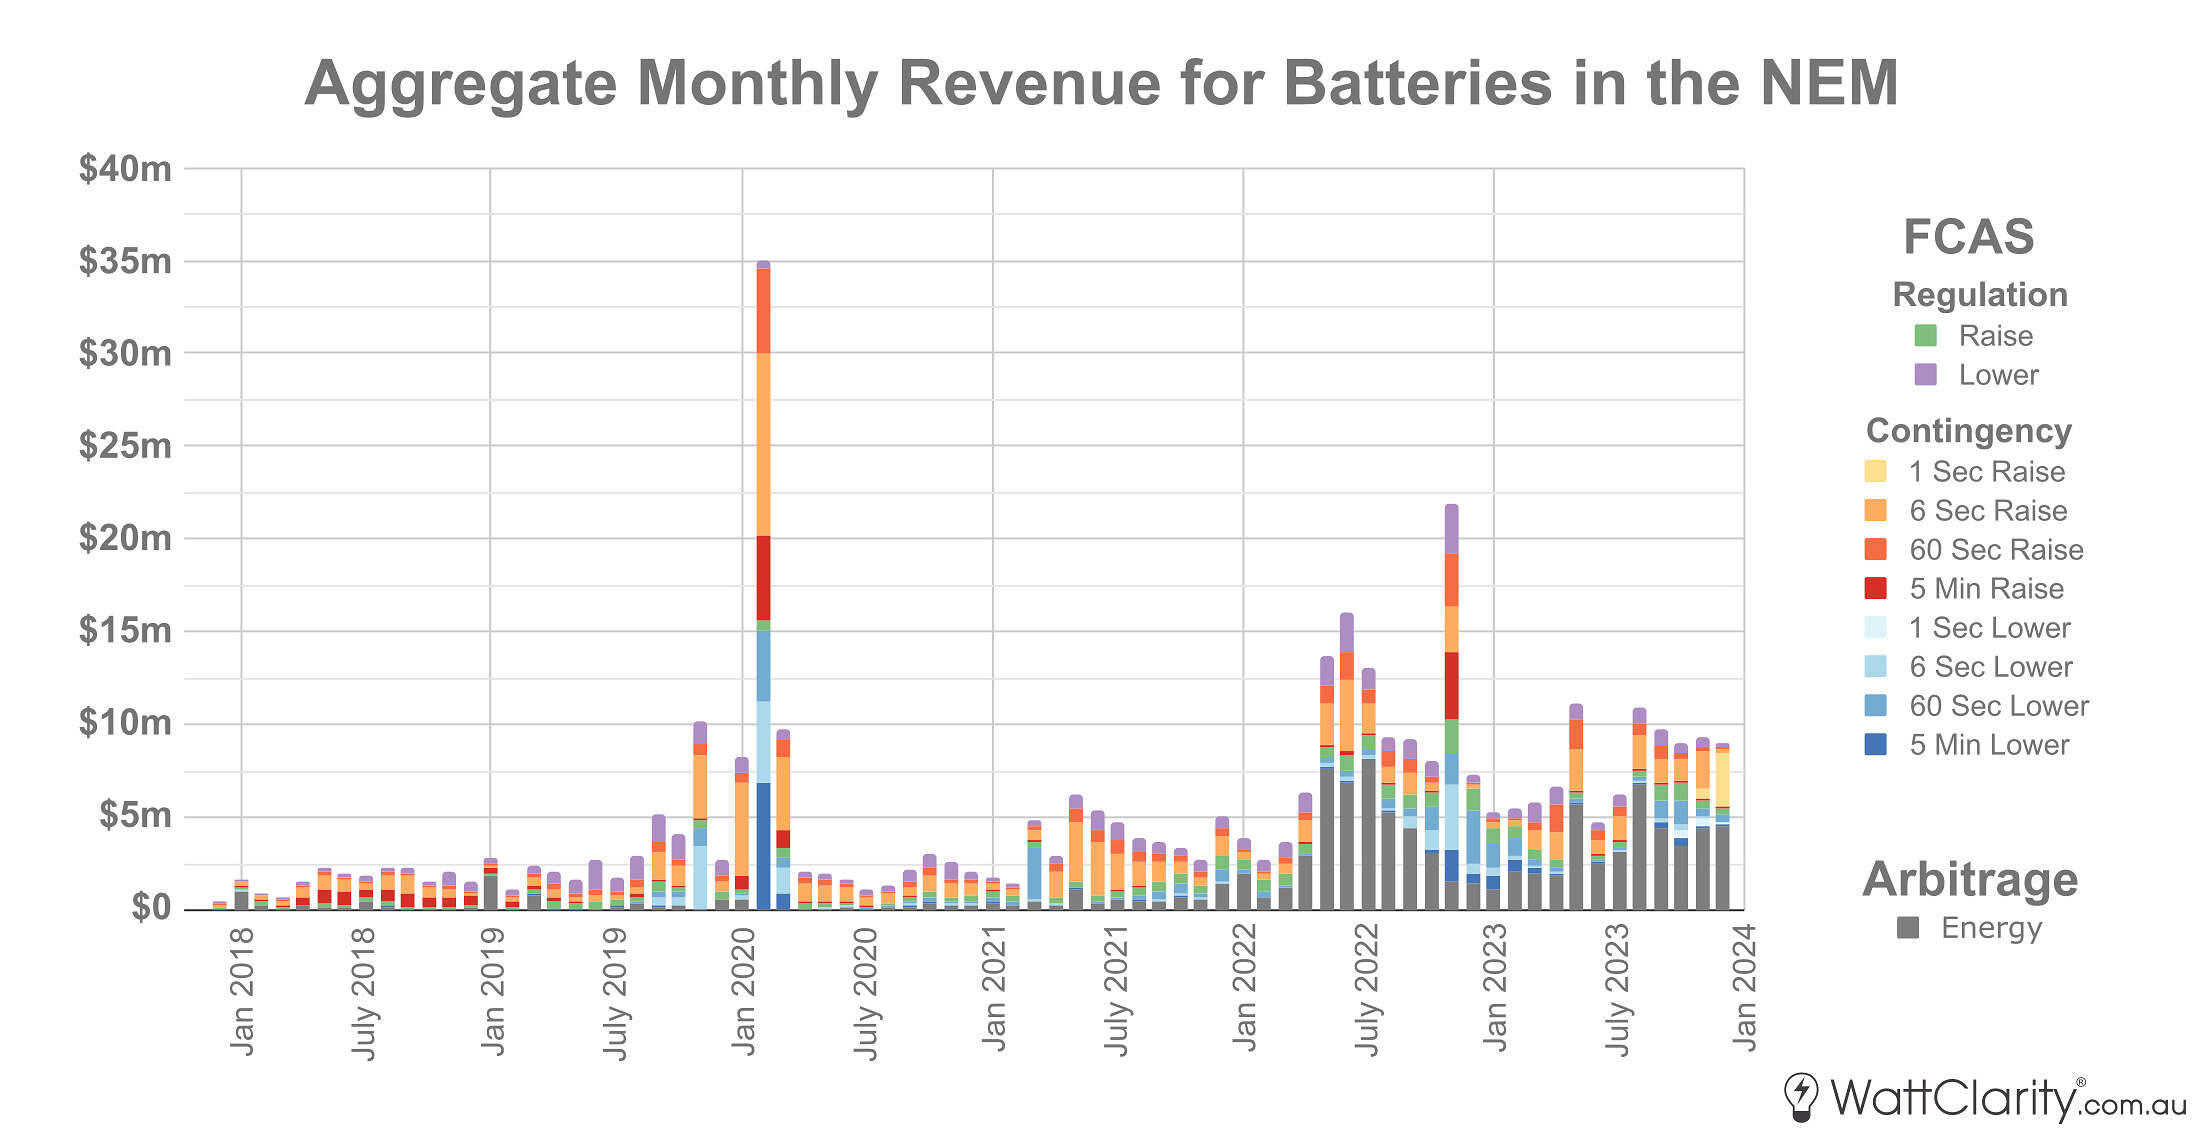
Aggregated Monthly Spot and FCAS Revenue for all big batteries in the NEM
Note: Only aggregated for batteries with MW capacity equal to or greater than 10MW. Based on 5-min InitialMW data.
Source: GSD2023 Data Extract
Looking at the chart above, three key long-term trends stand out to me:
- The obvious long-term upward trend of total market revenue largely owing to the increase in the number of batteries entering the NEM.
- The increasing trend of energy revenue as a more equal share of market revenue, particularly from early 2022 onwards.
- Three key unexpected events have played a significant role in market revenue upside for batteries thus far – the SA islanding in late January 2020, the Energy Crisis of June 2022, and the second major SA islanding in November 2022.
I also see that the last two bars in the chart demonstrate the early returns from the new 1 Sec Contingency markets since their introduction last October – but the sample size is too small to conclusively determine whether its introduction has contributed to a material uplift in total battery market revenue.
Revenue outcomes and individual performances
Here, I’ll discuss revenue in three parts:
- Arbitrage. This is the net result of what we would refer to as ‘Spot Revenue’ or ‘Energy Revenue’ in the NEM – and it’s simply calculated as the price paid for charging minus the price received for discharging in the energy market.
- FCAS. Revenue from providing enablement into any of the 10 Regulation or Contingency Frequency Control markets.
- Capacity and other. SIPS/WAPS revenue, bespoke contracts, and other accounted value derived from the dispatchable capacity or other services that the battery provides.
But before looking into individual financial performance through these three streams, it’s worth first reminding our readers how the design characteristics of each battery, and contracted financial positions, play a role in revenue strategy.
Firstly, duration can play a significant role in how the operators bid their volume between the energy market and FCAS market as the fleet itself is made up of batteries of different shapes and sizes.
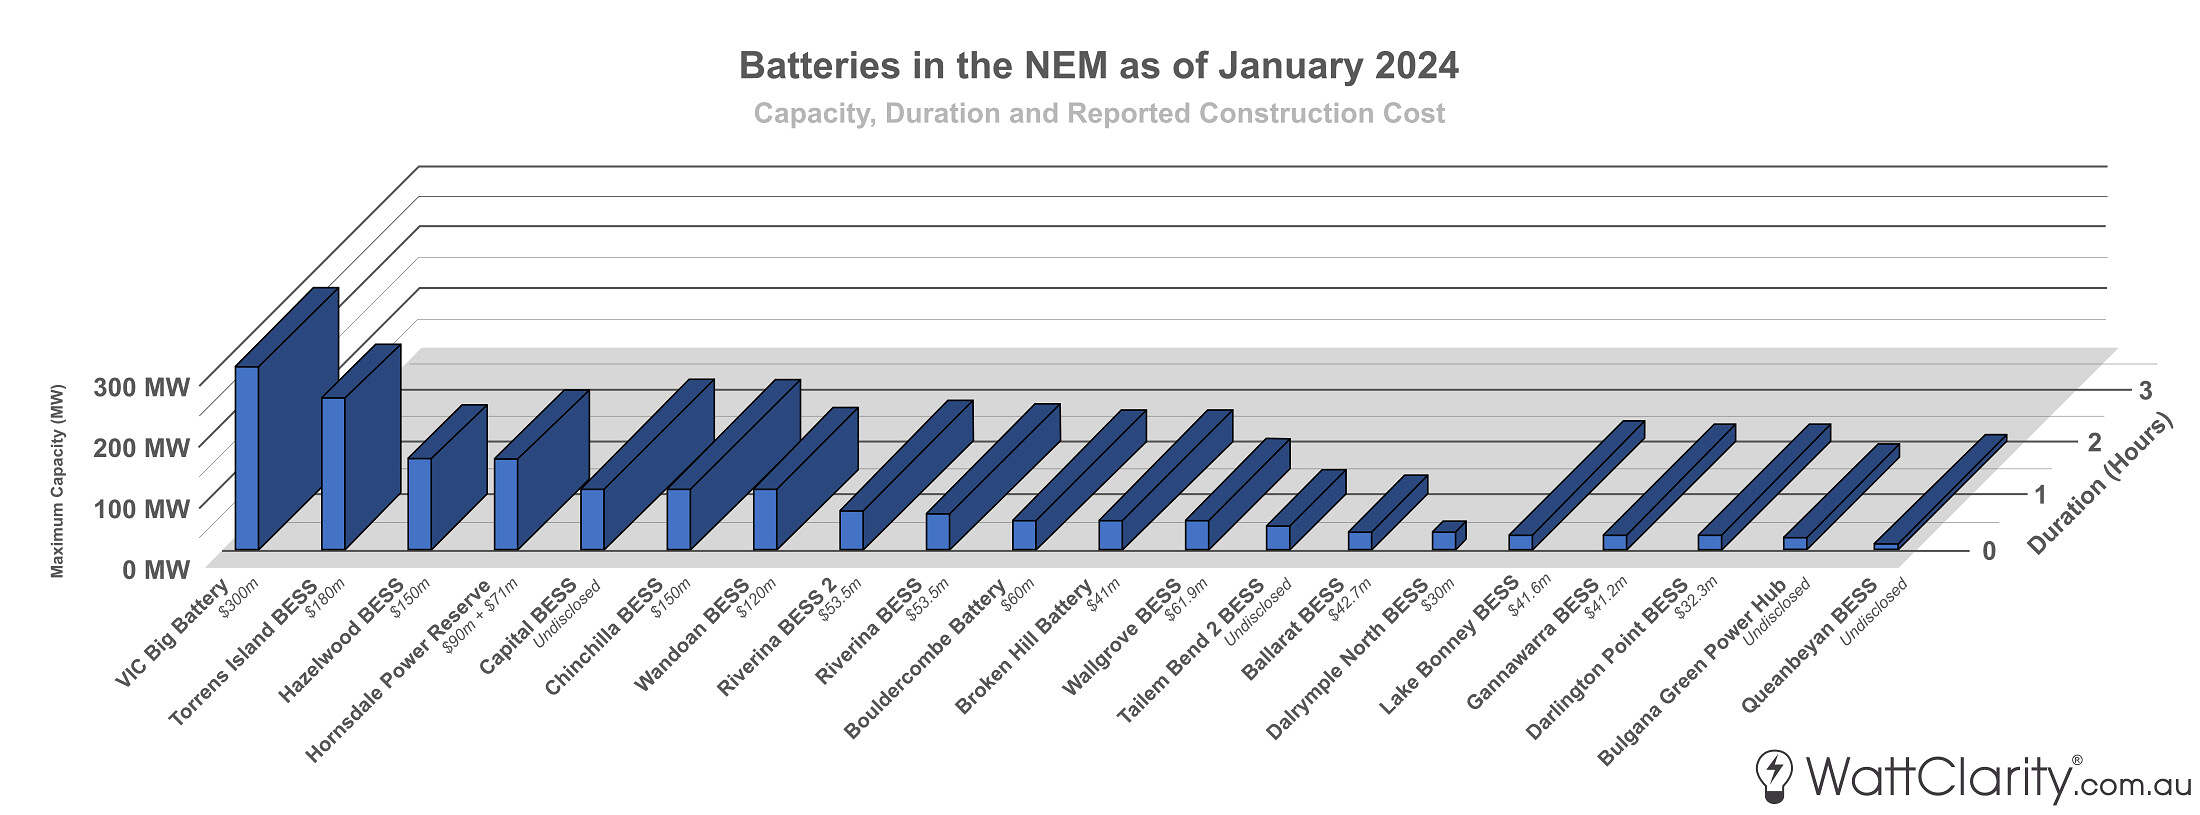
Capacity, duration, and reported construction cost of each big battery currently registered in the NEM.
Note: Hornsdale Power Reserve originally had a maximum capacity of 100MW when registered in 2017, but this was expanded to 150MW in 2020. Only showing fully scheduled batteries with a maximum capacity greater than or equal to 10MW. Capacity of generation DUID only.
Sources are listed in the references below.
In the chart below, we can see that being designed with a very short duration in the two most extreme examples (Dalrymple and Ballarat) plays a significant role in how their energy and FCAS bids are targeted.
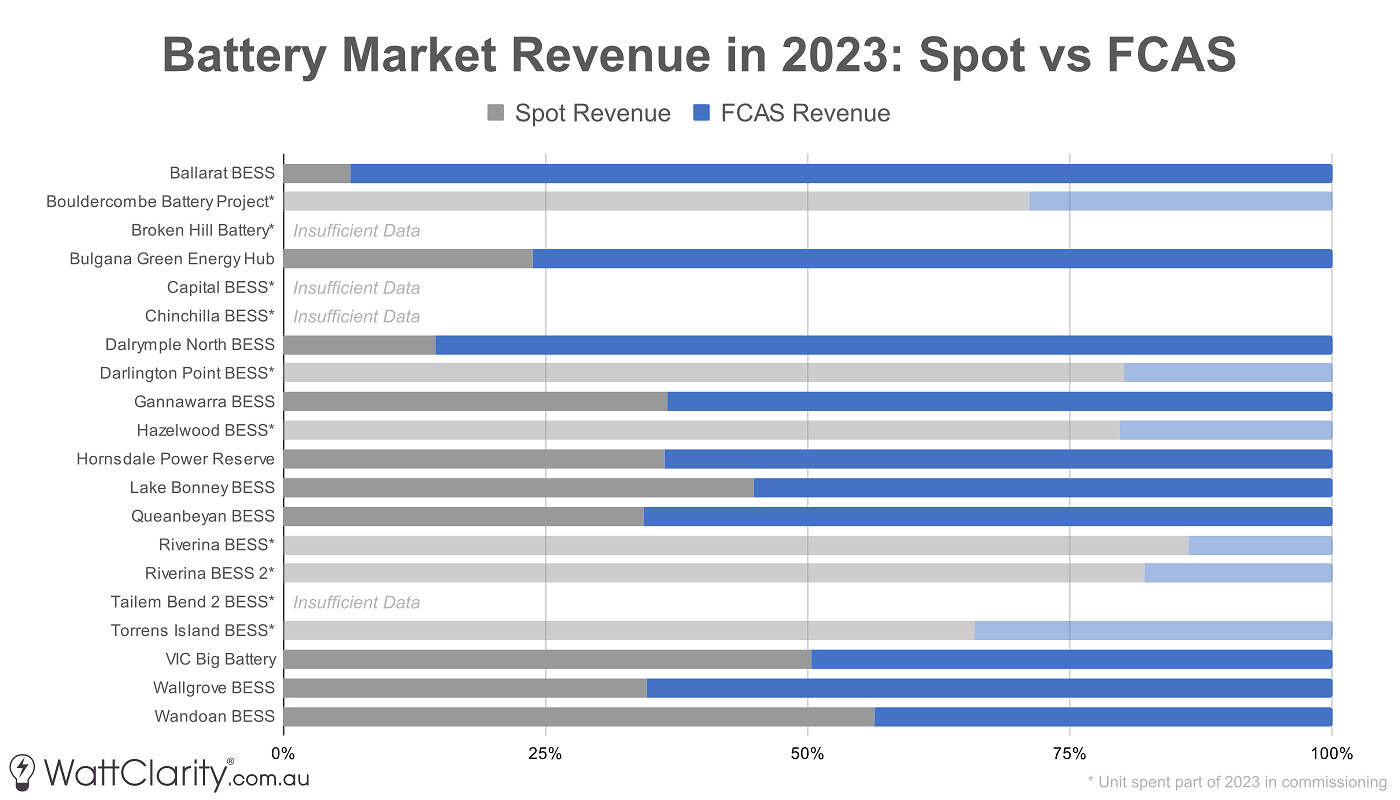
Split of Spot (Arbitrage) vs FCAS revenue provides some signal of trading strategies for each battery.
Note: Arbitrage based on 5-min InitialMW data.
Source: GSD2023 Data Extract
We can see a range of Spot-FCAS revenue splits for 2023. I’ve faded those batteries that spent time in commissioning throughout 2023 as it’s common for batteries to trade in energy before FCAS during their commissioning phase. Hence those revenue splits are unlikely to be indicative of long-term strategy.
It’s also worth noting that we are yet to see any batteries enter the market with more than two hours of duration. All current batteries are considered to be relatively ‘shallow’, which largely confines them to arbitrage intraday price spreads only. I’ve previously written on WattClarity about this, and the weak price signal for duration in the NEM’s current energy-only market design.
Of course, arbitrage and FCAS are not the only revenue sources for some batteries, as I will discuss below. Unfortunately, however, they are the only two where we have transparency. Another aspect that we don’t have full transparency over is any revenue protections that would insulate revenue below a certain baseline, for example:
- Through private hedging arrangements, such as the 8-year offtake agreement between Genex’s Bouldercombe BESS and Tesla – which provides the battery with an undisclosed revenue floor.
- Or through more formalised means such as the LTESA products or incoming CIS, although it will be some months/years before we see the first batteries connect covered by those arrangements.
Arbitrage
Below is a simple plot of arbitrage revenue for each battery per MW of installed (maximum) capacity, ranked highest to lowest.
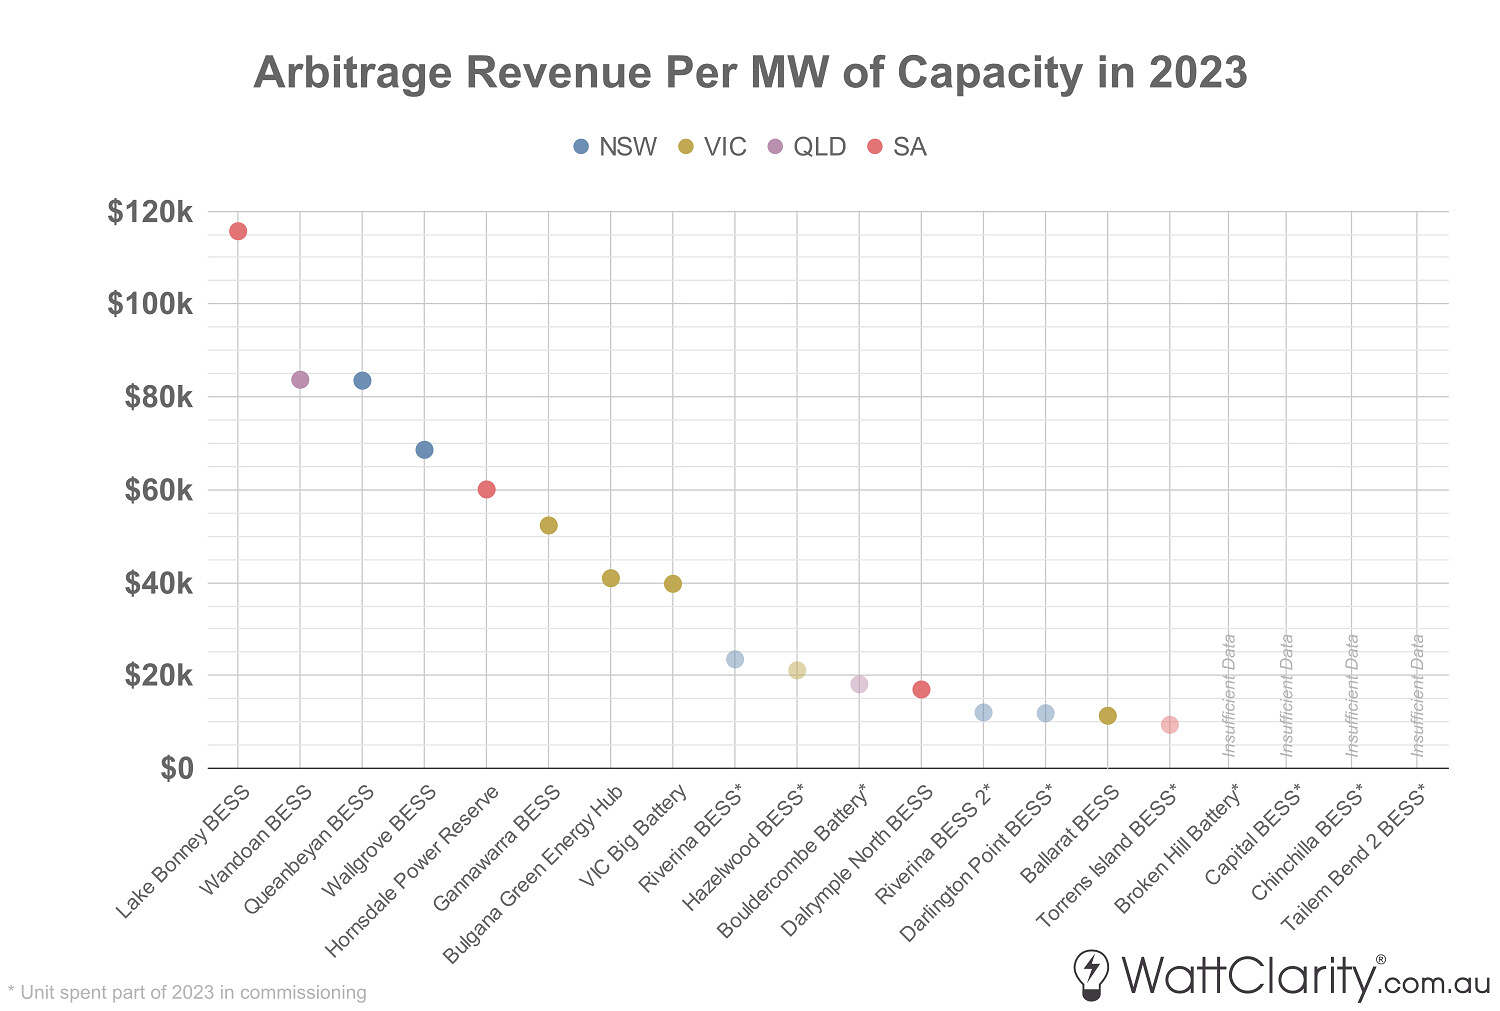
Batteries in Victoria underperformed on an arbitrage revenue per MW of installed capacity basis.
Note: Arbitrage based on 5-min InitialMW data.
Source: GSD2023 Data Extract
By this simple metric, the 25MW Lake Bonney BESS came out on top by a fair margin. But also notably, I must highlight the relative underperformance of batteries in Victoria.
One significant contributing factor was the lack of ‘high-high’ prices in the region throughout 2023. We’ve extracted data from our GSD to put together the chart below which shows how effective each battery was at discharging during periods of extremely high prices. The column on the right shows the total time that the battery was able to be exposed to a price above $10,000/MWh. For batteries that entered the market part-way through the year, the time shown is measured since the interval of first bid, hence factors are relative to time spent in the market.
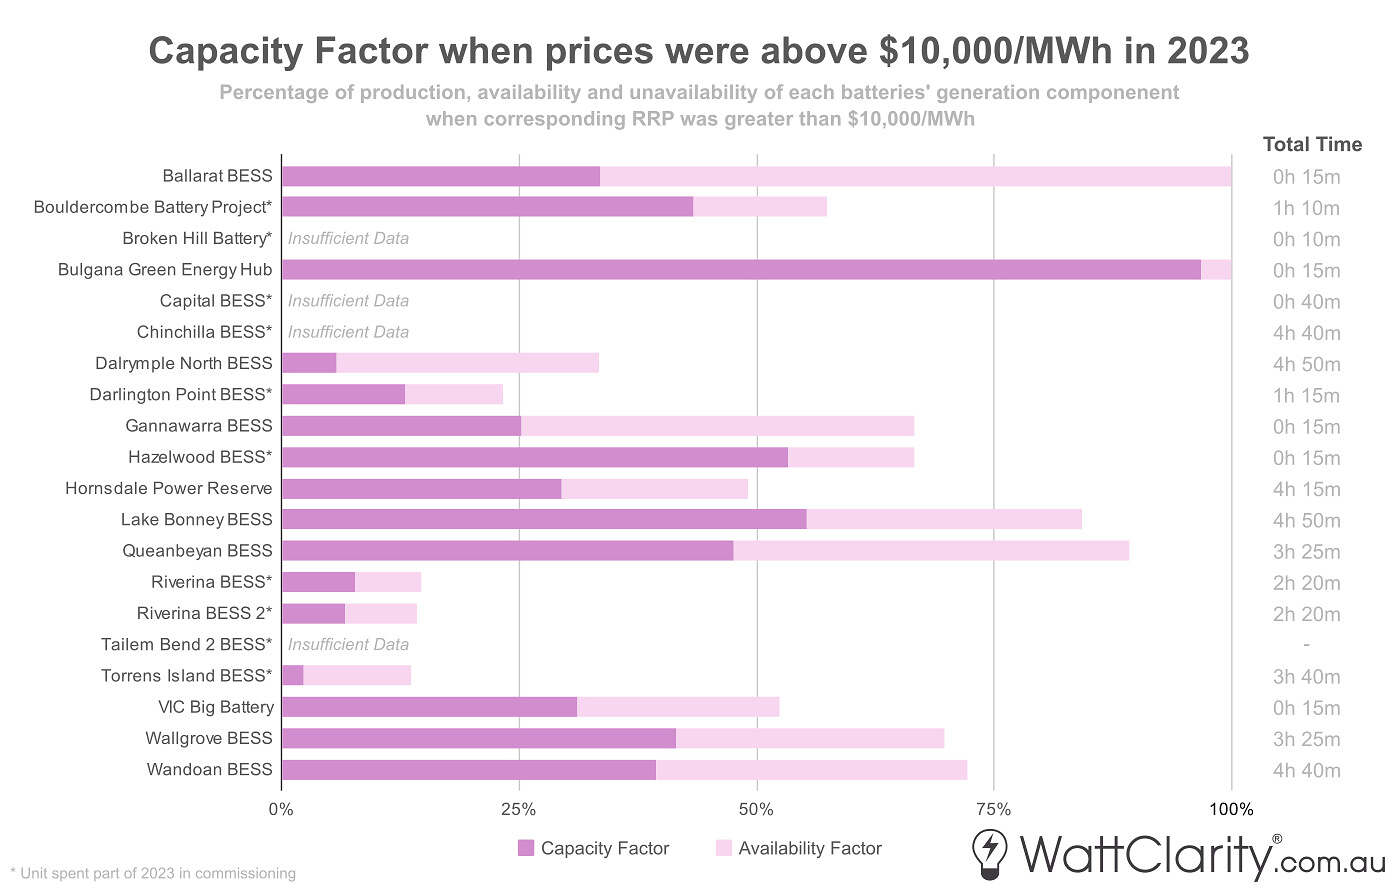
Capacity factor of each battery (for discharging) when prices were above $10,000/MWh
Note: Generation DUID of each battery only.
Source: GSD2023 Data Extract
So whilst Bulgana and Hazelwood were relatively effective at capturing these ‘high-high’ prices, VIC only experienced 15 minutes of such prices throughout 2023. Meanwhile, SA experienced 4 hours and 50 minutes of this level of extreme prices in 2023, of which Lake Bonney BESS was able to discharge more than half of its maximum capacity during these periods. This would be one of the significant factors in starting to explain the battery’s arbitrage overperformance.
In the chart above I’d also note that a low availability factor suggests that each of these batteries was not in a position to discharge during these price spikes. This could be for a number of reasons such as: being capped by duration, commissioning, FCAS enablements, auto-bidding algorithm, pre-IESS dispatch limitations, or capacity obligations such as those faced by the VIC Big Battery and Hornsdale Power Reserve (as will be discussed later).
FCAS
Below we see FCAS revenue combined for these 10 markets for each battery, per MW of maximum capacity.
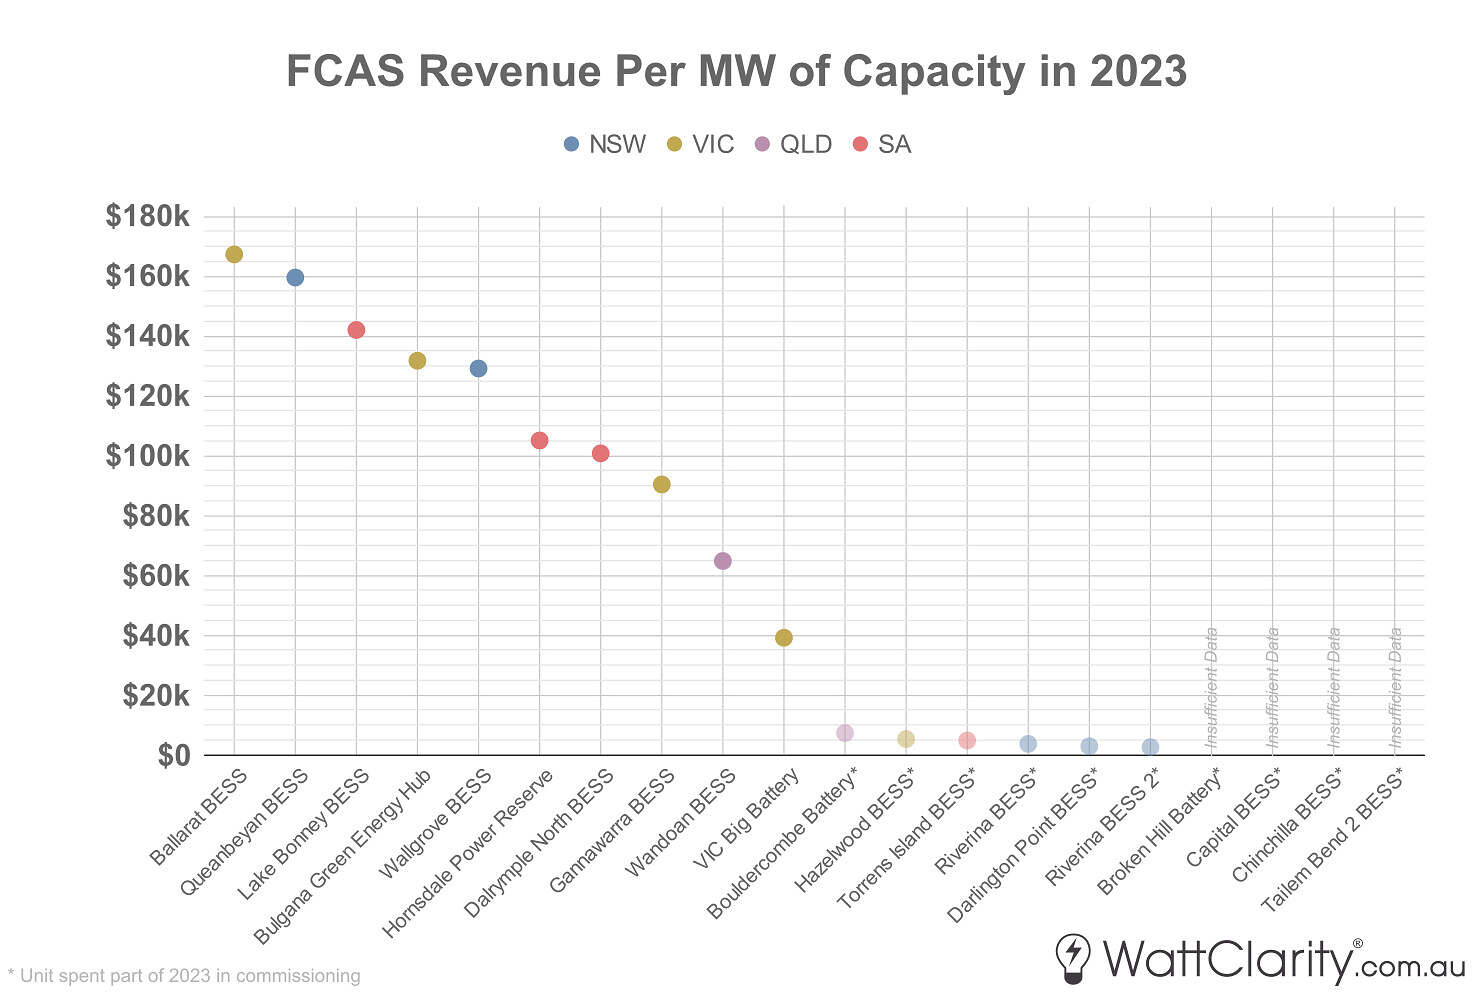
The more FCAS-inclined Ballarat BESS delivered the most combined FCAS revenue per MW of installed capacity.
Source: GSD2023 Data Extract
The smaller batteries were at the top of this list with Ballarat, Queanbeyan, and Lake Bonney in the ‘top 3’ – noting that the latter two batteries also achieved the third highest and highest arbitrage revenue per MW of capacity, respectively.
As we generally see less price separation between regions for FCAS prices (in normal times) – there was not the same regional divide for FCAS revenue throughout 2023 as what we saw in Arbitrage revenue.
The chart below provides further context, showing a breakdown of this FCAS revenue into the three main categories.
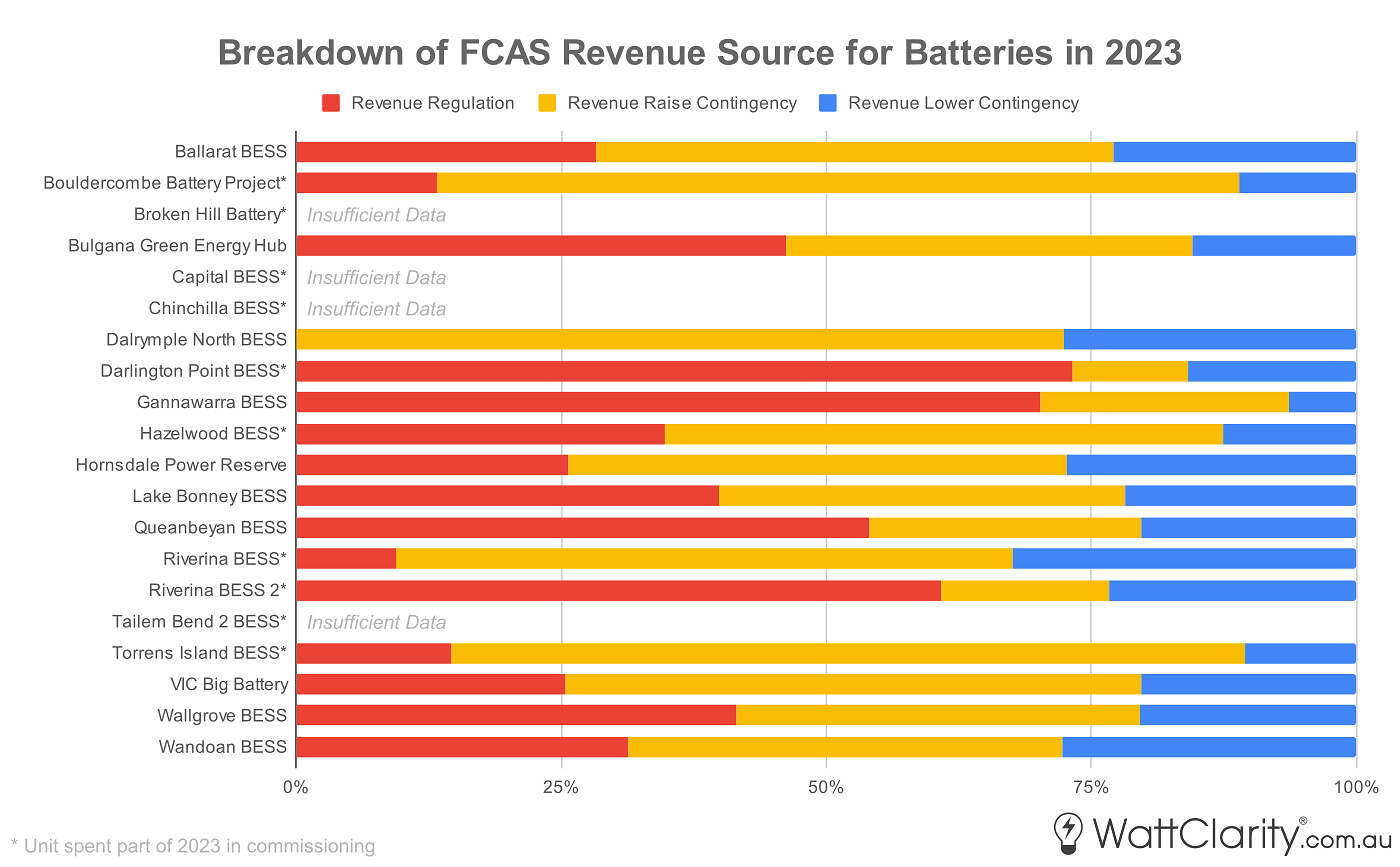
The breakdown of FCAS revenue sources for each battery, where we see lower contingency made up the lowest share on average.
Source: GSD2023 Data Extract
Interestingly, we can see that lower contingency revenue was fairly low across the board. This was due, at least in part, to relatively less volatile and softer prices (particularly in June and July) for these FCAS services across the NEM.
Capacity and Other
With the lack of a formal capacity mechanism in the NEM, we only get small glances at how batteries can use their capacity to generate revenue (or add portfolio value). This often comes via press releases or news articles, which are rarely heavy on details or contract terms. But it’s thought that this revenue source can be material. As an example, three weeks ago I noted that AGL’s half-year results presentation suggested that somewhere near 70% to 80% of the apparent revenue derived from their Torrens Island BESS in FY24H1 was attributed to ‘capacity and portfolio benefits’.
For completeness, it’s worth a quick review of what these revenue sources may include, with some known examples.
Support agreements
These are agreements between the owner/operator of the battery with the transmission service provider, government, and/or the AEMO – such as the System Integrity Protection Scheme (SIPS) or the Wide Area Protection Scheme (WAPS).
There are at least three batteries that have reportedly been contracted under SIPS or WAPS – the Hornsdale Power Reserve, the Dalrypme BESS, and the Victorian Big Battery. The service delivered is specific to each of those contracts – but in return, a fixed revenue is paid for reserving some amount of the battery’s capacity. In the case of the Victorian Big Battery, 250MW of its 300MW capacity is contracted to be reserved between November 1st to March 31st every summer from 2021 to 2032. They are paid $12.5 million per year (adjusted for inflation) for this service. And this obligation limits their ability to generate energy or FCAS revenue during those periods.
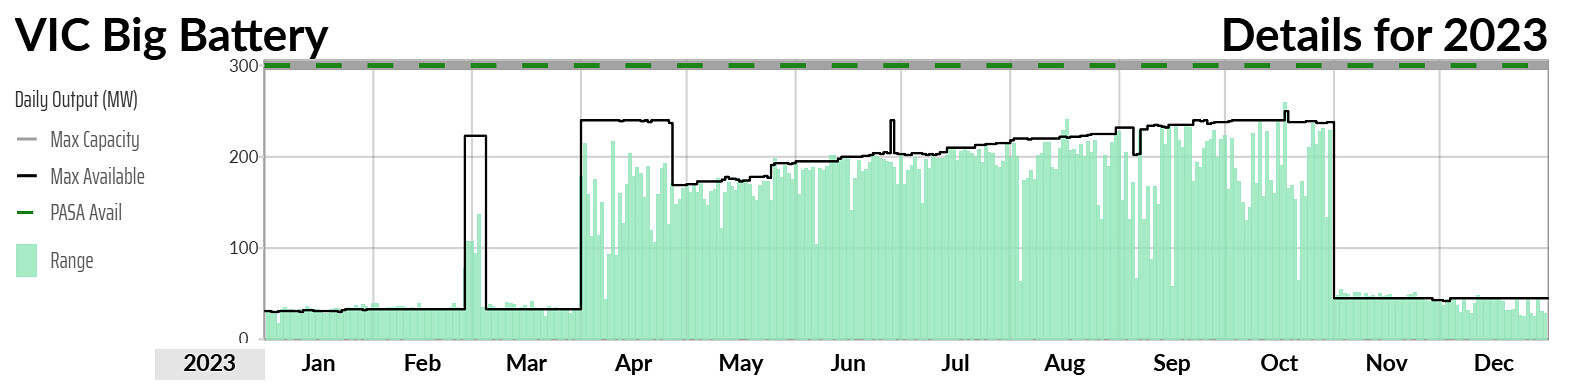
The shape of VIC Big Battery’s output over 2023 shows the effect of its SIPS obligations.
Source: GSD2023
From using ez2view to review rebid explanations, I can see that the battery undertook a brief ‘Dynamic SIPS trial’ in late Feb 2023 for one week where their capacity available to the energy market temporarily increased. Curiously, I have also noted the load component of the battery doesn’t appear to be capacity-limited for summer 2023/24 thus far. But we have yet to have the time to fully investigate this.
Hornsdale originally signed a 10-year/$40m contract in 2017 under SIPS, but it was reported that this was superseded by an undisclosed contract in late 2020.
Virtual Caps
Particularly for a generator with retail exposure, a battery can be utilised in place of a traditional cap contract. Hence the owner can potentially attribute the value of this foregone cost as capacity revenue. In early 2020, UQ ran (and documented) a case study experimenting with this concept, albeit on a 1.1MW scale.
As Andrew Wilson noted in that WattClairty article, a ‘virtual cap’ is not a pure like-for-like replacement for a traditional cap as a battery can face physical limitations (e.g. being limited by duration, network constraints, etc.) whereas a financial derivative does not. It’s less clear how this additional risk is managed in practice.
Other
There are many other ways a battery can generate revenue or add value to a portfolio, to name just a few more:
- Through sales of bespoke cap-like contracts or other OTC products to other market participants or to large customers directly.
- Reducing FCAS Causer Pays costs across a portfolio. This was one of the key objectives originally behind Iberdrola’s development of the Lake Bonney BESS.
- Reducing curtailment of other owned generation assets. This was a key benefit listed in the ARENA grant summary for the Gannawarra BESS.
- Increasing portfolio flexibility, hence assisting in lowering fuel costs for other slower ramping generation within a portfolio.
Key Takeaways
This article is just a brief skim on the surface of generator performance – believe us, we just published an 1180-page book of statistics about each one.. However, there should be a couple of high-level takeaways from this review:
- Battery revenue streams are continuing to increase in diversity. The split between arbitrage and FCAS has shown signs of evening out, but beyond that, there are signals that batteries are generating more holistic value.
- Market extremes play a very outsized role in overall financial performance. As we often emphasize, the NEM is a very volatile market hence averages are becoming less relevant.
References
Sources of reported construction cost estimate (in order): VIC Big Battery, Torrens Island, Hazelwood, Hornsdale + expansion, Chinchilla, Wandoan, Riverina 2, Riverina, Bouldercombe, Broken Hill, Wallgrove, Ballarat, Dalrymple North, Lake Bonney, Gannawarra BESS and Darlington Point BESS.
Subscribe to updates please.
Thanks
It may be coincidence, but the increase in energy arbitrage revenue seems to roughly correspond to the introduction of 5 minute settlement in October 2021.