It’s Sunday 21st November 2021, which means we’re just over 2 weeks from scheduled Monday 6th December 2021 release date of our upcoming GenInsights21 publication (the next in a series, following the GRC2018 a couple years ago – also developed collaboratively with Jonathon Dyson’s team at Greenview Strategic Consulting).
I’m trying to review our 2nd print run of an early draft of the report (now something over 400 pages in total) but my phone keeps buzzing with SMS alerts to distract me…
(A) New low point for demand in South Australia
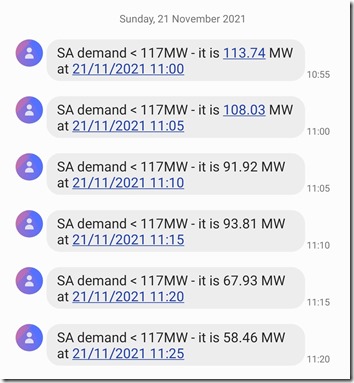
Here’s the run of text messages looking at ‘Scheduled Demand’ has been dropping in South Australia this morning (you might think of it as ‘Market Demand’):
(SMS alerts can be configured in a number of our products – ez2view and deSide®, and NEMwatch Platinum)
The 117MW low-bound threshold set in the alert was with reference to the short-lived low point record set only on 31st October 2021 and discussed at the time.
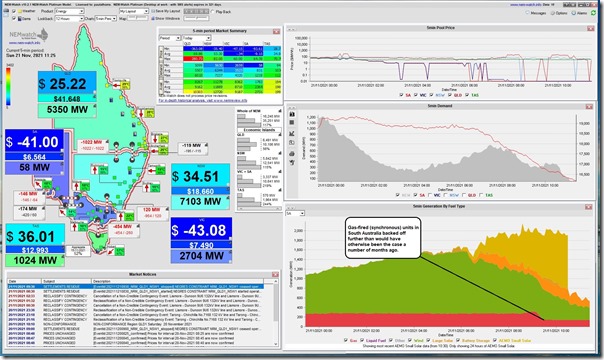
One significant thing that has changed in the intervening 3 weeks is that the fuller effect of South Australia’s synchronous condensers are being felt, allowing thermal units to be backed off further than was previously the case. We can see this in this snapshot from NEMwatch for the 11:25 dispatch interval (NEM time) today:
We can also see wind generation ramping down – which may be in part due to the sub-zero prices that South Australia has been experiencing as rooftop PV cleans up the lion’s share of underlying demand:
1) Can’t know for sure until more data is published tomorrow; but
2) Prices have not dropped below -$100/MWh, so commercial curtailment may not be so great, given the adder effect of LGC revenue.
At this time, the ‘Market Demand’ (i.e. the ‘Total Demand’ figure in AEMO’s MMS) is down at 58MW … which was (for 5 minutes) the lowest-in-NEM-history:
1) At least until it was superseded with:
(a) a mark down at 33MW for the 11:30 dispatch interval!
(b) then a mark further south – down at 29MW (rounded up) for the 11:45 dispatch interval!
(c) further still to only 18MW for the 12:00 dispatch interval!
(d) down further, to only 14MW for the 12:15 dispatch interval!
(e) down, to only 0.17MW for the 12:20 dispatch interval!
(f) then further still – below zero – to -46MW for the 12:35 dispatch interval!
2) Excluding the artificially lower points around the time of the SA System Black (though that was only down at 5MW, so is really not that far away now!) Can now delete this line!
—
No doubt AEMO will be along later with official stats (after their checking process) to confirm how long ‘Operational Demand’ dropped to in South Australia … their preferred measurement of demand as it better reflects ‘Grid Demand’.
—
At some point in the coming weeks, but not straight away, we’ll update this tabulated record of minimum demand points across all regions.
(B) Back to GenInsights21…
Thanks to the growing number of people who have submitted their pre-orders for this upcoming release:
If you’ve not done so already – don’t forget that you’re also able to submit your pre-order for GenInsights21 now, in order to have first access to the report when it is released and save on what the cost will be at the time of release (only valid until the time of release – targeted for Monday 6th December 2021).
Last weekend we determined that there would be 28 Appendices in total – exploring a wide range of aspects of this energy transition. It just so happens that Appendix 14 explores aspects of Minimum Demand … such as what we have seen today in South Australia!
You might want to refer back to this note from a month ago to see how the appendices will fit in with the broader document.
The future is coming very quickly indeed!


What is the point of achieving that amount of penetration for a short time on the weekend? When the sun goes down and the wind fails, as it often does for hours at a time, SA depends on local gas and coal power from Victoria.
A chain is only as strong as its weakest link and the effectiveness of a flood protection barrier is limited by the lowest point, regardless of the high parts. Windless nights are the weak link in the chain, like the gap in the levee.
How hard is that to grasp? Don’t mention pumped hydro storage, when Snowy2.0 comes up at immense financial and environmental cost it will only partly replace Liddell. Big batteries to cover windless nights? You have got to be joking!
“How hard is that to grasp?”
Well if you have the obvious answers Rafe there’s plenty of well paid opportunities going begging it seems-
https://reneweconomy.com.au/architect-of-integrated-system-plan-to-leave-aemo-as-staff-exodus-continues/
“Don’t mention pumped hydro storage”
There’s not much worth mentioning in SA anyway-
https://reneweconomy.com.au/one-pumped-hydro-project-still-standing-as-south-australia-heads-to-100pct-wind-and-solar/
Rafe, I don’t think the flood protection barrier analogy works. In that case, if the flood exceeds the lowest parts of the levee, everything on the other side is compromised: a literal tipping point. So, as you say, the only thing that matters is how high the lowest points are.
That doesn’t apply here. Occasionally resorting to gas or even coal is still a huge improvement over constantly using it. “What is the point?” Not burning all that gas when the wind *is* blowing or the sun *is* shining. That’s the point.
Your analogy would only make sense if the entire system were to somehow collapse if gas or coal were ever used, which isn’t the case.