It’s Monday evening, 15th November 2021 – which means it’s now 3 weeks away from the intended release date of GenInsights21 … that being Monday 6th December 2021.
(A) Progress with GenInsights21
Firstly, a quick update on status…
Thanks to those clients who have submitted their new pre-orders for GenInsights21 as a result of the email on Monday last week. The number of pre-orders continues to grow (apologies for the delay in responding to all of you who came back to me with questions and requests).
If you’ve not done so already – don’t forget that you’re also able to submit your pre-order for GenInsights21 now, in order to have first access to the report when it is released and save on what the cost will be at the time of release (only valid until the time of release).
Over the weekend, with lots of compilation work still on the go, we finally sat down to collate all of the appendices that are still coming together and we counted 28 Appendices in total – exploring a wide range of aspects of this energy transition.
You might want to refer back to this note from a month ago to see how the appendices will fit in with the broader document.
The combined team (a number of us here at Global-Roam Pty Ltd, several others from Greenview Strategic Consulting, and a number of other external analysts) have each been focused on different aspects of this compilation process.
Particularly for me, a number of days recently have been invested wading through the enormous volumes of bidding data to distil what’s been happening down to an individual DUID basis – I already posted this note on 1st November and this earlier note on 26th October about this. Now that we know the numbering, I can tell you that it’s going to be Appendix #22.
—
However I’ve had enough of that for today, so need to turn my mind to something else for a bit … and what better than another puzzle!
(B) Another ‘mystery DUID’ puzzle from the ‘Forecast Convergence’ appendix
On Thursday last week I posted this puzzle about 5 different mystery DUIDs which we asked you to deduce ‘just’ from a 20-year trend of MLF for the DUIDs. This is part of an Appendix which Daniel Lee has been putting together … with the numbering of these Appendices all sorted now, we know this will be Appendix #4.
1) In the days since posting that puzzle we’ve been receiving guesses from a range of readers – such as here on Twitter, and here on LinkedIn.
2) Feel free to have a stab yourself, if you think you know what one or more of them are?
More will be revealed on this one after the release of GenInsights21.
—
Today I’m going to refer back to some analysis that Linton Corbet has been performing that’s along the lines of what the ‘Forecast Convergence’ function in ez2view is focused on doing with a range of the AEMO’s forecast data sets:
1) In this case for GenInsights21 just uses P30 Predispatch data (… but across a number of different data sets).
2) What Linton has been doing will be Appendix #16.
Linton already introduced the method he has been using back on 21st June … this is one of the Appendices that has been on the go for many months, in between Linton’s contributions to ez2view version 9, and other things.
In the case of this next ‘Mystery DUID’ puzzle , we’re not looking on the demand side of the equation, but rather the supply side and in particular the declared availability of particular DUIDs (and groups of DUIDs) leading up to the point of dispatch.
There are 6 examples here of a variety of fuel types, and I wonder how many readers can come close to guessing these 6 x Mystery DUIDs? There is a solar farm in the mix … but we have filtered out the hours in the data set such that it is only looking at forecasts pointed towards ‘daylight hours’ in the location of the solar farm.
Note that it’s aggregated to Station across one or more DUIDs (so really a ‘Mystery Station ID’ quiz). Note also that we have also normalised (by dividing by Maximum Capacity) – which both:
1) Makes it a bit harder to guess, but also
2) Helps readers to think more about the fundamentals, and what they might mean (both in terms of the data shown here – but also more generally, in terms of the energy transition).
With all of these stations, you’ll see a few common characteristics … with one of the main ones being that the firmness of the forecast is relatively low 24 hours ahead of the half-hour of dispatch, and progressively increases through to the point of dispatch.
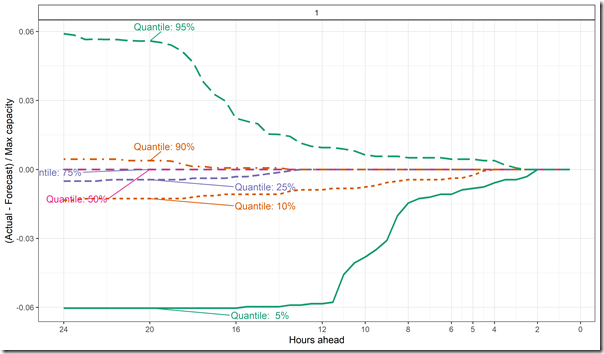
(B1) Mystery Station ID #1
Here’s the spread of ‘firmness of forecast availability’ for station number #1.
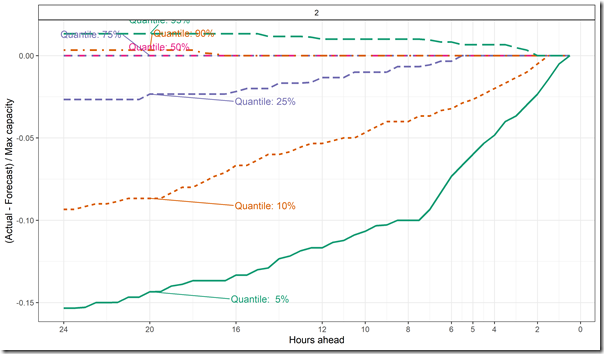
(B2) Mystery Station ID #2
Here’s Mystery Station #2 … which looks quite a bit different than the first one.
Why is that?
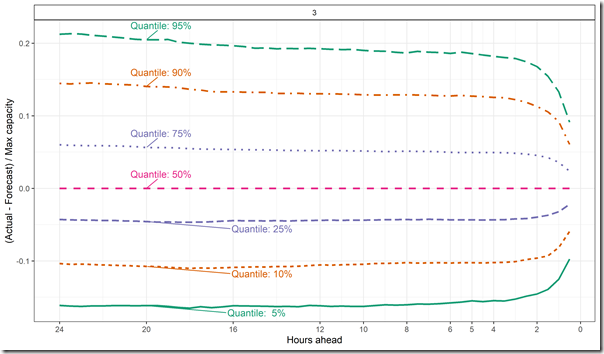
(B3) Mystery Station ID #3
Here’s Mystery Station #3 … again, quite a different shape (and breadth).
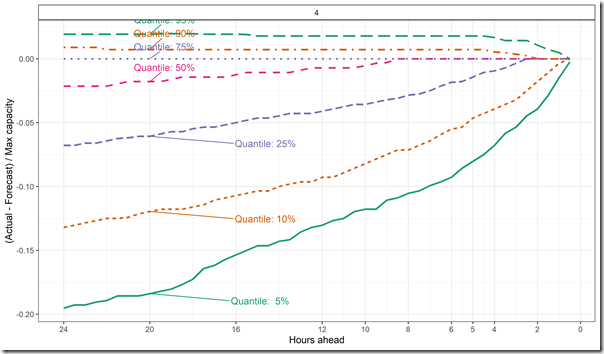
(B4) Mystery Station ID #4
Here’s Mystery Station #4 … quite similar to Mystery Station #2. Why are they similar – and, when they are different, why is that the case?
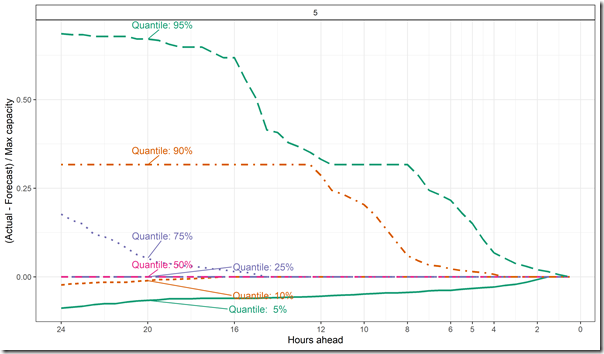
(B5) Mystery Station ID #5
Here’s Mystery Station #5 … in some ways looking like a mirror image of #2 and #4.
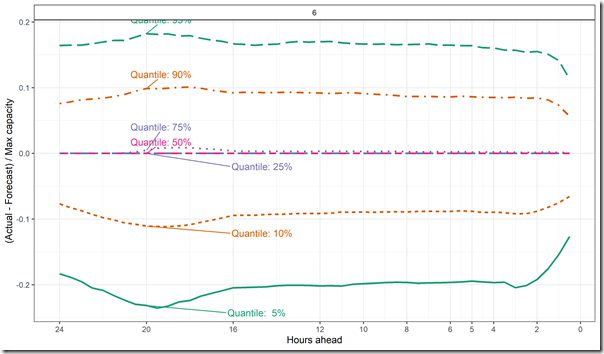
(B6) Mystery Station ID #6
Last but by no means least, here’s Mystery Station #6
You will also have seen some big differences – so you might want to think about why these differences occur? We’ll explain more about this in your copy of GenInsights21 (if you pre-order your access today).
Happy guessing!


Leave a comment