On Thursday last week, I posted a short article about ‘The rise of the auto-bidder’, in relation to one of the work streams of analysis we’re completing for the upcoming GenInsights21 release:
It’s now Monday 1st November – which means we’re only 5 weeks away from our expected release date of Monday 6th December 2021. We’ve a lot to do between now and then, but the multi-pronged approach to analysis we’re taking across a range of analysts is leading to some intriguing observations about different aspects of how the NEM is evolving – including with respect to this energy transition.
Don’t forget that you’re also able to submit your pre-order for GenInsights21 now, in order to have first access to the report when it is released and save on what the cost will be at the time of release (only valid until the time of release).
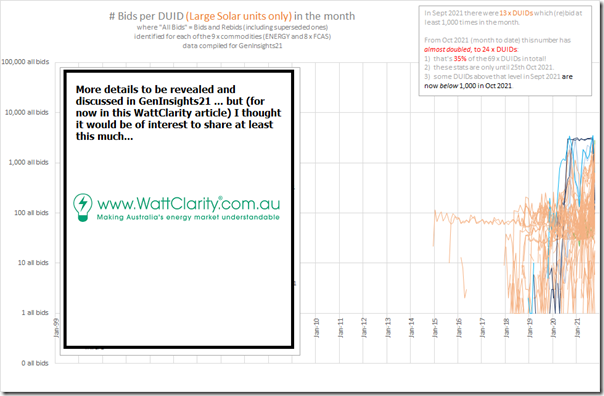
Today I’d like to share this image that jumped out at me over the weekend in continuing to explore the (mostly!) increasing level of activity in bidding across many different types of units:
More will be explored in GenInsights21 itself, but for now I’ll leave you with this:
1) What’s shown here is a trend (for every* Large Solar Farm DUID) of the number of Initial Bids and Rebids placed by that DUID in the month.
* Semi-Scheduled solar farms, that is, as Non-Scheduled solar farms don’t have to bid.
2) This one is in log scale in order to highlight a couple things that will be discussed in GenInsights21 itself.
3) Some particular solar farms are highlighted to draw out other observations.
4) What I particularly wanted to highlight in this article was a startling difference between the bids for September 2021 and the bids for October 2021 (with data only to 25th October 2021) – not really visible in the noise of the chart:
(a) In September 2021, there were 13 x Solar Farm DUIDs that had total number of bids submitted to AEMO in excess of 1,000 for the month:
i. which is an average of 33 bids and rebids each day … definitely into auto-bid territory;
ii. the highest was up at 3,594 (averaging 120 each day);
(b) Through October* 2021, this number grew substantially – with now 24 x Solar Farm DUIDs having a total number of bids in excess of 1,000:
i. technically (*) this was only until 25th October, which is where we extracted the data for this analysis.
ii. the highest, in this case, was up at 2,845 bids
iii. there are 69 x DUIDs, in total, in the list currently – which means 24 of those represent 35% units employing some form of autobidder technology in October 2021, up from September 2021.
… so far it all seems pretty understandable … with the increase (from 13 to 24) being just another illustration of ‘the rise of the autobidder’!
(c) However what really jumped out at me was that, of these 24 x DUIDs, only one of them was in the list for September 2021 as having a number of bids greater than 1,000:
i. so that is 23 new units reached over the 1,000 threshold in October 2021;
ii. which begs the question – what happened to the 12 other DUIDs that bid in excess of 1,000 times in September 2021, but not in October 2021?
iii. Why have they dropped out of the list? Indeed, a number of them are down 95% (or more) on the volume of bidding in September 2021. More like ‘fallen off a cliff’ than ‘dropped out of the list’!
iv. An obvious difference was the commencement of Five Minute Settlement … but was this really the only reason for all of them?
—
We’re exploring this question in some detail, along with many others, for GenInsights21 … don’t forget to get your pre-order in to save before it’s released!


Leave a comment