In addition to the double-barreled trip of the Callide C units in the middle of the day today, I also noticed Market Notice 82116 from the AEMO, which is one of the ‘Local Temperature Alerts’ I wrote about here just before Christmas. In this case, the alert covers the Dalby reference point in southern QLD:
——————————————————————-
MARKET NOTICE
——————————————————————-
From : AEMO
To : NEMITWEB1
Creation Date : 13/01/2021 10:53:01
——————————————————————-
Notice ID : 82116
Notice Type ID : GENERAL NOTICE
Notice Type Description : Subjects not covered in specific notices
Issue Date : 13/01/2021
External Reference : NEM Local Temperature Alerts for QLD from 13 Jan 2021 to 17 Jan 2021
——————————————————————-
Reason :
AEMO ELECTRICITY MARKET NOTICE
AEMO’s weather service provider has issued forecast temperatures equal to or greater than the NEM Local Temperature Alert Levels for listed weather stations below.
QLD
Dalby Ap (37+ Deg C): 16th Jan
The NEM Local Temperature Alert Levels are:
Launceston Ti Tree Bend: 33 Deg C, Dalby Airport: 37 Deg C, for all other selected weather stations: 39 Deg C.
AEMO requests Market Participants to:
1. review the weather forecast in the local area where their generating units / MNSP converter stations are located and,
2. if required, update the available capacity in their dispatch offers or availability submissions consistent with the forecast temperatures.
Further information is available at:
AEMO Operations Planning
——————————————————————-
END OF REPORT
——————————————————————-
So I thought I would take a quick look…
(A) What’s expected on Saturday 16th Jan
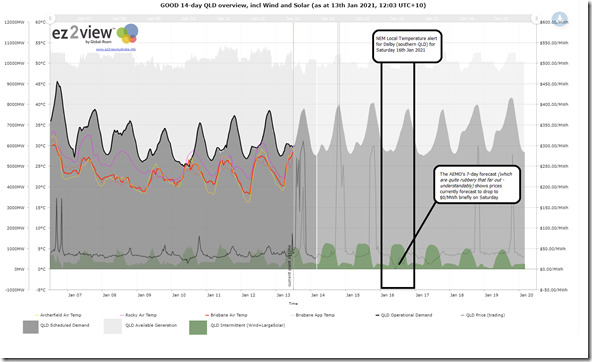
Using the pre-coded 14-day trend view for Queensland in the ez2view ‘Trend Engine’ (licensed users can find their copy here) we can see that the current forecast is for the QLD region to be quite ‘boring’ on Saturday:
(B) High temperatures matter … for all types of plant
Given that we’re currently reviewing the second draft of the Generator Statistical Digest 2020 (GSD2020), aiming for a release on or around Wednesday 27th January 2021, I thought it might be timely to flip through some of the units that (I think) would be using Dalby as their reference temperature in terms of acing bids.
Before doing so, it’s worth reiterating that:
1) Pretty much all technology in the electricity supply chain (generation, transmission, distribution, embedded DER) is affected by extreme temperatures in some way.
2) All operators of Scheduled and Semi-Scheduled assets are required to notify AEMO of how their plant are likely to be affected by high temperatures:
(a) For Scheduled plant, the process is pretty straightforward (i.e. alert AEMO, and the market, through your bid!)
(b) For Semi-Scheduled plant, the process has evolved to be a bit more confusing & frustrating for all (as Marcelle discussed on 18th December) because of the confusing overlaps and gaps between the Bid system and the AWEFS/ASEFS/Self-Forecasting processes, which are different for the current dispatch interval and the near-term predispatch.
As an aside, this is just another reminder of the need to streamline the data submission, retention and publication processes!
(C) Historical results in South-West QLD through calendar 2020 from the GSD2020
The Local Temperature Alert means that those assets located in and around Dalby (i.e. south-western QLD) would need to be alerting AEMO. All of these assets are included in the GSD2020 … which (in the ‘B Pages’) shows the performance of the assets through CAL 2020 at various local temperature points.
So I thought I would have a look at a sample … for a couple reasons:
1) As part of the data checking process (is it what we would expect?)
2) To understand what the significance might be on Saturday … or, more particularly, on a hot day after Australia Day when underlying demand is cranked back up to more ‘normal’ (i.e. non holiday) levels.
Here’s a sample of some…
(C1) Kogan Creek coal-fired power station
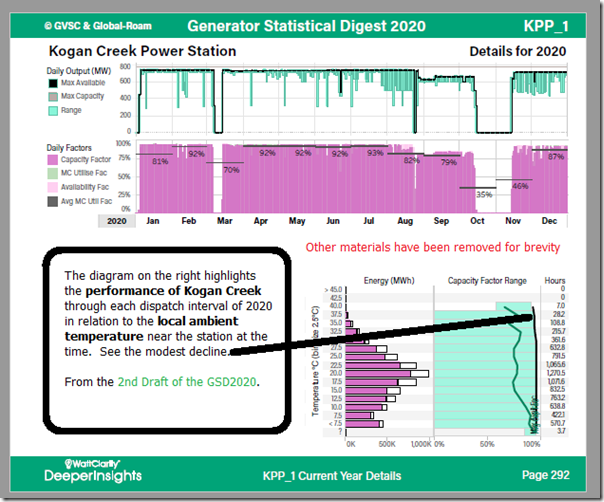
I presume the Kogan Creek power station would be using Dalby as their local reference point (i.e. despite the fact that Dalby’s not ‘just up the road’, it would be the closest of the measurement points the AEMO uses in terms of representative weather). Here’s how the ‘B-page’ in the current draft of the GSD2020 looks for Kogan Creek.
For those who have access to the earlier Generator Report Card 2018, remember the discussion in there about how Kogan (being air-cooled) shows a more severe high-temperature limitation than does most of the other coal-fired units (being water-cooled). See page 36 in Part 4 of the 180-page analytical component.
(C2) Darling Downs CCGT
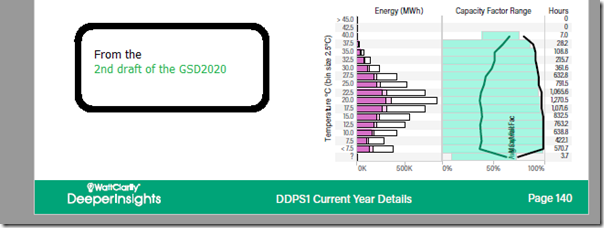
Closer to Dalby is Origin’s Darling Downs CCGT. Here’s what we currently see:
We see that the high-temperature limitation is greater for Darling Downs than it is for Kogan Creek.
(C3) Braemar 6
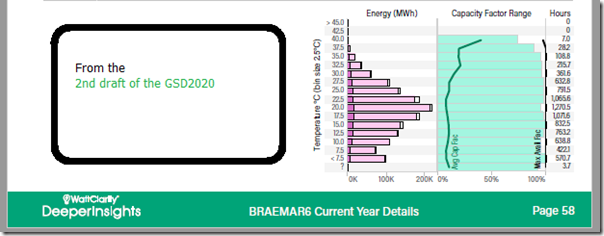
Again, for those who have access to the earlier Generator Report Card 2018, remember the discussion in there about how open-cycled gas turbines show a significantly greater effect of high temperatures than do combined-cycle gas turbines. See page 60-61 in Part 4 of the 180-page analytical component.
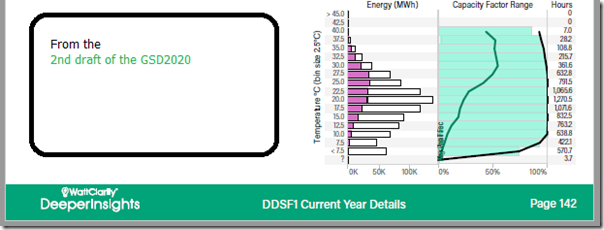
However when looking at the actual data for unit 6 of Braemar B (i.e. the Arrow Energy plant) we see some effect, but not really more significant than shown above for DDPS1.
—
That might be (I am speculating, as I have not invested time to check the unit configuration to know if this would be even possible) because DDPS1 did not run through the hot months of 2020 with the HRSG in operation?
(C4) Darling Downs Solar Farm
Just up the road, we can see what the data looked like for the Darling Downs Solar Farm, which had a fully year of activity in 2020:
There is some small drop in capability apparent at higher temperatures, but it’s not huge. For those who understand that the efficiency of PV reduces as temperatures progress above (approx) 25 degrees Celcius, the reason there is generally not a marked reduction in output shown for large-scale solar farms was also discussed in the GRC2018 (see page 92 in Part 4 of the 180-page analytical component).
(C5) Coopers Gap Wind Farm
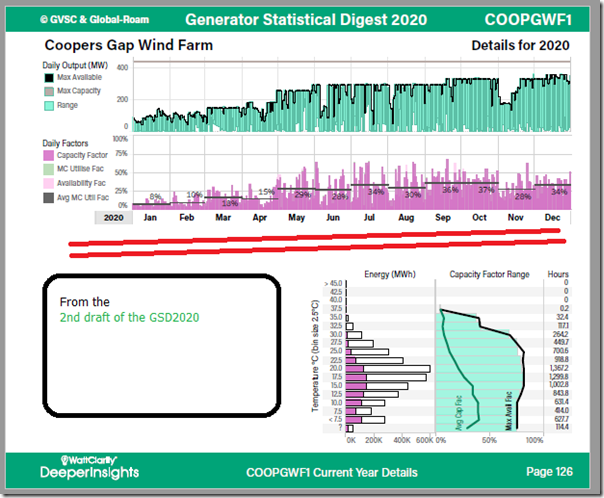
There’s not much choice, yet, in terms of which wind farm to look at in the general vicinity of Dalby … so we’ll show the results that are apparent for Coopers Gap Wind Farm:
In this case, I’ve left in the 2 charts at the top of the page in order that readers can see how the project progressively came up to (almost) ‘full steam’ by the end of the year. Ben Willacy’s article from almost exactly a year ago showed the equivalent chart from 2019 … highlighting that it has been a slow journey in getting fully up to speed.
Keeping that in mind, it does appear that there might be a significant high-temperature effect, starting at quite low temperatures.
Obviously with your own copy of the GSD2020 (once released) you would be able to dig into more units…
(D) Still ~2 weeks left to save when you pre-order
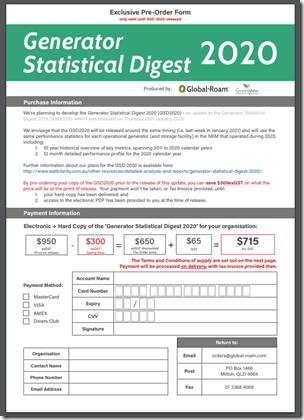
Further information about the Generator Statistical Digest 2020 is provided here on the WattClarity site, but today I just wanted to highlighted the ability for you to save $300exGST by pre-ordering before the GSD2020 is released:
| You’ll be able to download the GSD2020 (when it is released) … for those who have already ordered |
This is how to save $300exGST when you pre-Order the GSD2020 … if you have not yet done so |
| Obviously, the GSD2020 will not be available until it has been released (expected 27 Jan 2021).
Once it has been released, clients will have their access to the electronic copy Generator Report Card here: You’ll need to set up your own unique log-in, using your organisational email address in order to access:
One bound hard-copy is also being supplied as well (if we have your best postal address). |
Complete the order form and send back to us:
After we receive your order, we will (after release): (1) Set you up with electronic access at the site above (hence be sure to specify your corporate email address); and (2) Deliver your bound-hard copy; and (3) Process your payment and provide a tax invoice. |
We look forward to hearing back from you!


Be the first to comment on "NEM Local Temperature alert for Dalby (QLD) for Sat 16th Jan 2021 … an opportunity to check the draft GSD2020"