This is the next instalment in a progressively evolving Case Study looking at what happened with the unexpected price spike on Tuesday 13th October 2020:
Part 1 was a contemporaneous record, which highlighted the two key occurrences:
1a) The unexpected price spike to $15,000/MWh in the 09:45 dispatch interval;
1b) Coincident with the sudden (and equally unexpected) spilling of almost 600MW of Large Solar generation across 10 solar farms (9 in northern QLD)
Part 2 was written the following day, and highlighted how the reduction in grid demand in northern QLD was the trigger for the sudden curtailment:
2a) Demand which was being hollowed out through the morning by rooftop PV; and
2b) With a ~35MW drop in the North Zone tipping the balance over the edge;
2c) With the constraint particularly severe given outage on the #821 transmission connection between H10 Bouldercombe (i.e. near Rocky in Central-West) to H11 Nebo (i.e. near Mackay in North).
…. Note that we’ve received a fair bit of feedback and comment about this particular aspect, so will look to expand on this as Part 5 in the series when time permits.
Part 3 followed on Saturday 17th October, stepping through a more holistic sequence of events, and also reinforcing that the price spike was not forecast in advance (via predispatch) – though there were perhaps some leading indicators to be aware of in future for those who have ez2view containing Powerlink’s QData set.
… which brings us to this Part 4.
In this part of the Case Study, we’re briefly walk through many of the DUIDs in the QLD region to highlight some of the interesting points of behaviour that we spotted. Note that:
NOTE 1) there may be other things that we did not spot and/or did not have time to write about – and
NOTE 2) it also might be that we have overlooked something for the units we do write about – and also (importantly)
NOTE 3) there may be errors (given our time constraints, or something we don’t understand) in the interpretations below.
Let us know if you spot any?
Thank-you, to the growing number of people who’ve already contacted us to point out errors, and sometimes additional data to include. You’re helping us make this article better – and also helping to drive our software forward.
.
Also note that some of the links below are to specific references to publications in our evolving Asset Catalog (a service that’s growing out of the earlier Generator Catalog, for those who have a licence).
(A) How to think of the Queensland Grid?
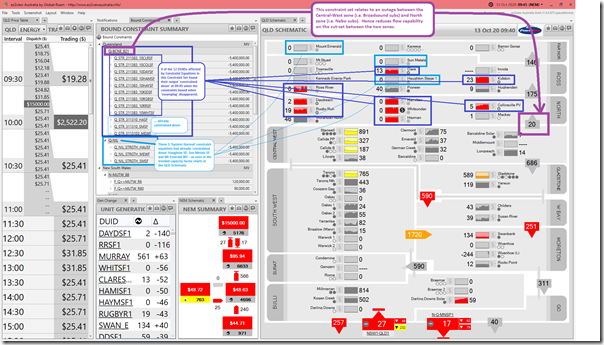
Once again, let’s include this snapshot here of an ez2view Window Time-Travelled to 09:45 on Tuesday 13th October included in Part 3:
For what follows, pay particular attention to the ‘QLD Schematic’ widget on the right-hand side of the widget. All DUIDs in QLD are aligned in network location through the 11 x Transmission Zones that Powerlink uses* to define the Queensland grid.
* you’ll find the same zones used in Powerlink’s Annual Planning Statement each year, for instance.
In the ‘QLD Schematic’ widget, we’ve already seen (in Part 3) that Powerlink’s near real time metered flow data between these zones is shown … and is a leading indicator to watch for in future. In Part 2 we already saw that the 2nd type of data in the Powerlink ‘Qdata’ set (i.e. near real time grid consumption for each zone) was useful in understanding why the Right-Hand Side of the constraints in the constraint set ‘Q-BCNE_821’ all suddenly bound at 09:45.
(B) Location is important Essential!
On Sunday 11th October I wrote about how location is an essential ingredient to any electricity grid … but is especially the case for a ‘long skinny’ grid like the NEM. Unfortunately it seems that the current methods for supporting additional developments in ‘anytime/anywhere energy’ still persist in overlooking both components of space and time…. which can only end in tears.
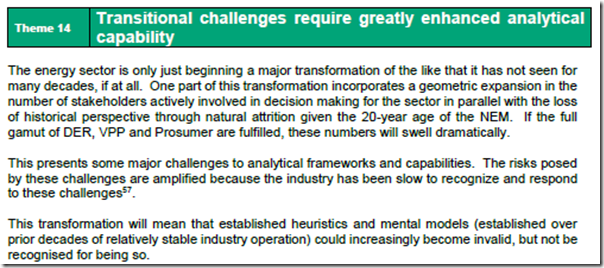
Unfortunately, some commentary I have seen over the past week purporting to explain what happened … and how it could have been avoided … also neglects to consider the locational aspects. Yet another reminder that the transitional challenges require greatly enhanced analytical capability:
… which is what we explored in Theme 14 within Part 2 of the 180-page Analytical Component of the Generator Report Card 2018. Worrying that this should still be continuing!
With this in mind, be very mindful of the location of all of the contributing factors below:
We’ll start from top to bottom and work through many of the stations in turn:
Note 1) We will cover every station in ‘northern QLD’, because this is the area of particular interest – but then time and space constraints mean we’ll only cover some of the stations in central and southern QLD
Note 2) We’ll make heavy use of Time-Travelled ez2view, and in particular the ‘Unit Dashboard’ Widget (with some others also used in some cases).
Note 3) In some instances we will provide direct links to the station entries inside of the Asset Catalog as a convenience for those who have a licence. The Asset Catalog is a newer version of our Generator Catalog, and is a service being developed to augment the capability of software products like NEMreview and ez2view. Contact us if you want to learn more.
(B1) ‘Far North’ Zone
This zone represents supply and demand in and around the area of Cairns in far north Queensland.
(B1a) Mount Emerald Wind Farm
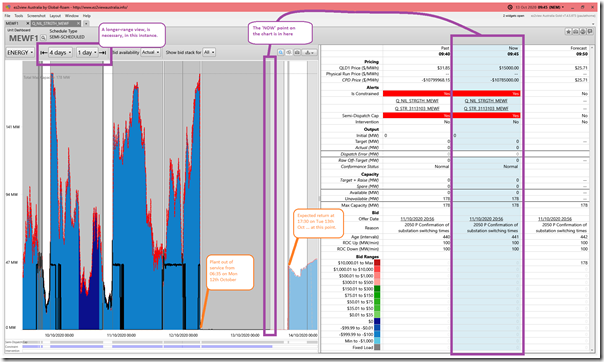
Mount Emerald Wind Farm (along with Sun Metals Solar Farm and Haughton Solar Farm) was already constrained off from 05:50 that morning by some longer-lasting ‘Q_NIL_STRGTH_MEWF’ system strength constraint (part of the ‘Q-NIL’ System Normal constraint set) and played no role in what happened on the day:
The unit had been offline since 06:35 on Monday 12th October, and was (at the time of the spike) not envisaged to return to service until the 17:30 trading period on Tuesday 13th October. This is seen in the longer-range view in the ‘Unit Dashboard’ widget in ez2view above.
In this case it’s a curiosity that the ‘Q_STR_3113103_MEWF’ constraint equation had been bound for many hours beforehand (hinting at a different resolution for the RHS, hence a different formulation). Would be something for me to dig further into in Part 5 of this evolving Case Study, if I have time.
(B1b) Kareeya Hydro Power Station
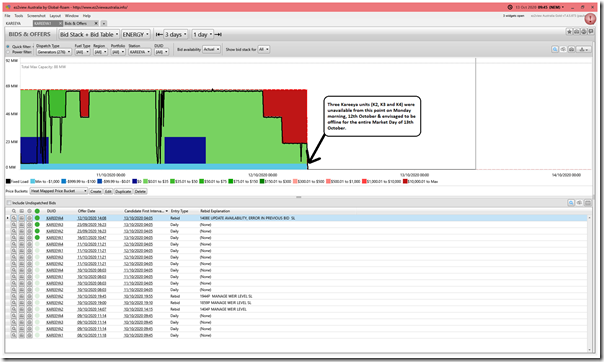
The Kareeya Power Station was not operational through the period of the spike. This was particularly relevant in relation to the operation of the Right-Hand Side of the constraints in the constraint set ‘Q-BCNE_821’ … but was also a factor that confused some other analysts in the commentary they were making (such as Ben Cerini at Cornwall Insight) about what was happening through the period of the spike.
The Kareeya station is 5 units – 4 scheduled and a smaller ‘K5’ non-scheduled unit downstream that was constructed late in the 1990’s. Three of these units (K2, K3 and K4) all came offline on Monday morning and were (according to bids at the time) forecast to remain off for the whole of the Market Day, Tuesday 13th October:
We’ll be aiming to explain the specifics of these particular constraints next in Part 5 of this evolving Case Study (if/when we get to it).
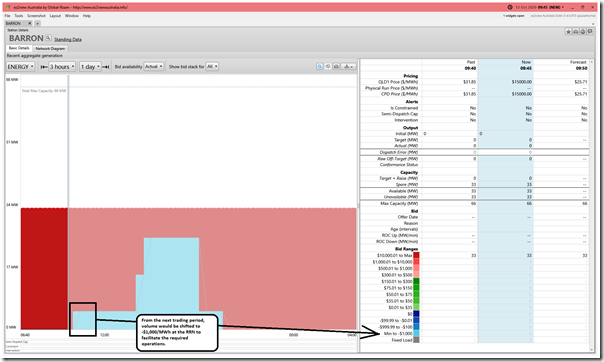
(B1c) Barron Gorge Hydro Power Station
The Barron Gorge Power Station was slated to start operating from the half-hour period ending 10:30 (i.e. just after the trading period in question):
… unfortunately too late to have an effect on the price spike.
(B2) ‘Ross’ Zone
This zone represents supply and demand in and around the area of Townsville in far north Queensland. Importantly, it also contained at least one large industrial energy user that exhibited spot-price exposed demand response (as noted in Part 2) in response to the price spike. We know of one energy user that will have done this (a long-term client of ours) but they are not specifically identified in the data, so won’t name them here.
Stations in each of the zones are presented in descending order of Maximum Capacity, so this is also reflected in the listings below:
(B2a) Mt Stuart Peaking Power Station
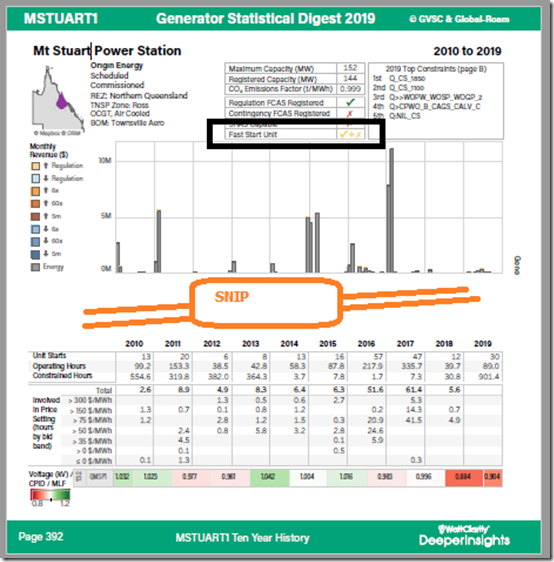
The Mt Stuart station consists of 3 units that are currently registered as ‘Fast Start’ with the AEMO – as noted in this snippet from the ‘A’ page for MTSTUART1 in the Generator Statistical Digest 2019:
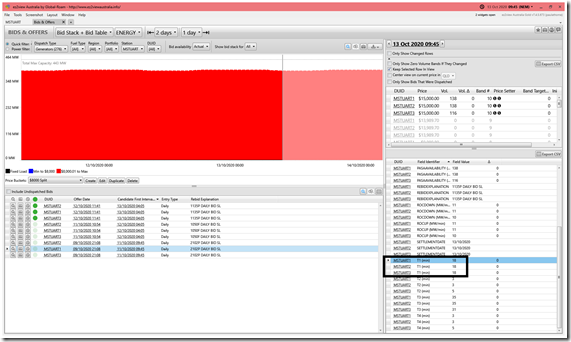
We can see (in the revenue chart underneath) that it barely runs, which is the nature of a peaking plant. Because of its registration as ‘Fast Start’ that means the Fast Start Inflexibility Parameters (FSIP) are taken account of in the bid. In the ‘Bids and Offers’ snapshot from 09:45 on Tuesday below, we see the key value is that the units had a ‘T1’ or ‘time to start’ parameter set at 18 minutes in the bid … hence not fast enough for AEMO to dispatch them in response to this unexpected price blip:
As quick acting as batteries they are not, which would be one reason why Origin Energy explored the installation of a 4MW/4MWh battery onsite at Mt Stuart in 2018-2019. This development did not proceed.
(B2b) Townsville (Yabulu) Gas-Fired CCGT
The Yabulu CCGT plant was also not operating at the time of the spike:
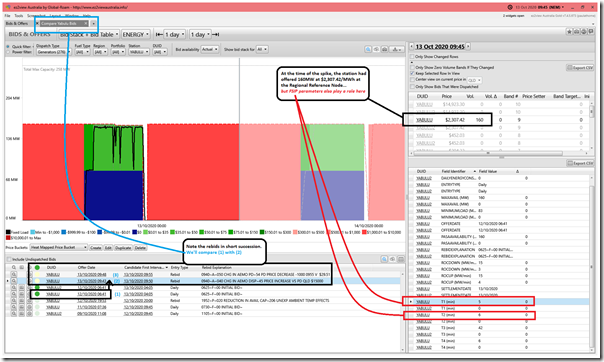
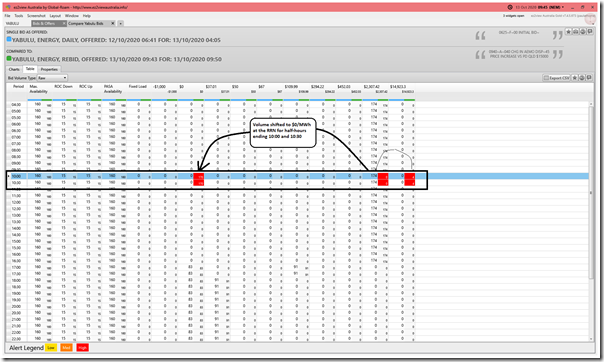
We see that the unit had volume offered at $2,307.42/MWh – which is below the Market Price Cap price outcome at 09:45. However operations here are also complicated by FSIP parameters:
1) Time to synchronise of 5 minutes; and
2) Time to reach minimum load of 6 minutes; and
3) Time at minimum load of 42 minutes; and
4) Time to shut down of 6 minutes.
We’ve annotated the image to note that there were three bids used in sequence:
Bid sequence (1) = was the ‘Daily’ bid offered the morning before that was used in NEMDE’s dispatch run for 09:45; but then:
Bid sequence (2) = this was superseded by a first rebid made at 09:43, so in time for the 09:50 dispatch run, that shifted volume lower in anticipation of prices remaining high:
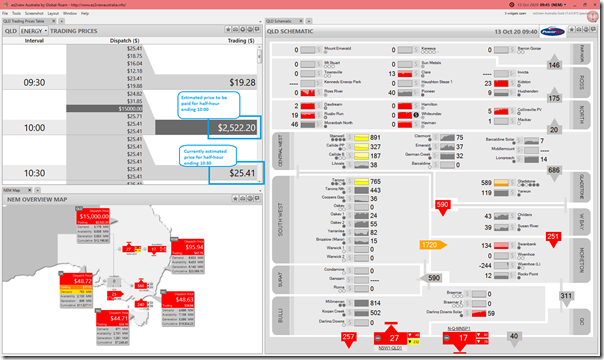
Keep in mind that this bid was offered at 09:43, when the predispatch price forecast for QLD looked like this (i.e. in the 09:45 dispatch interval):
… specifically a high price for the half-hour ending 10:00 and then a (slightly) positive price for the half-hour ending 10:30.
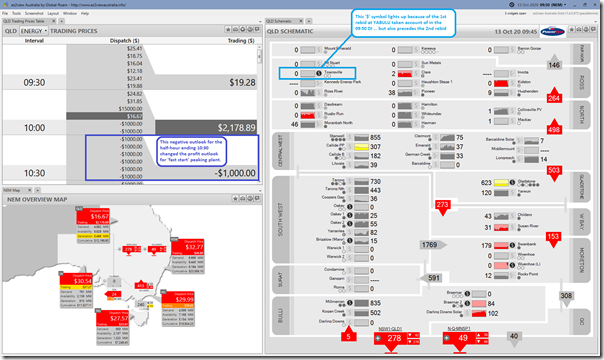
But, as a result of all of the rebids, the price outlook for the half hour ending 10:30 changed to be negative in the NEMDE run published around 09:45:20 as seen here:
Bid sequence (3) = this poorer outlook thus means the operator (AGL Energy) takes the approach of reversing the prior rebid to sit out of all the action. Space constraints mean I won’t show this here.
(B2c) Kennedy Energy Park
Kennedy Energy Park is not yet operational (but we have made provisions for the first stage – a solar farm – on the ‘QLD Schematic’ widget, as it is in AEMO’s pre-production system pending the completion of the registration process).
(B2d) Ross River Solar Farm
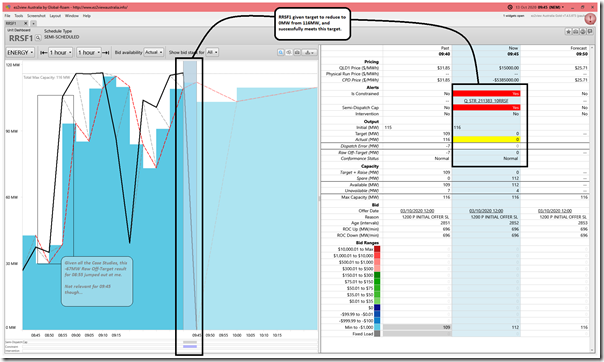
Because of the ‘Q_STR_211383_10RRSF’ constraint equation focused just on RRSF1, the plant is dispatched down to 0MW and successfully meets its Target:
—–
With this, and other units that successfully meet their targets it’s important to be aware that we’ve not looked at the 4-second Causer Pays data to ascertain if the ramping was in a linear trajectory as assumed by AEMO through NEMDE. Readers should be aware that units might ramp too quickly (one of the issues raised in the AER Issues Paper) in which case:
1) There would be implications for frequency; and so
2) There might be non-trivial costs of FCAS Regulation service imposed upon the plant using the ‘Causer Pays’ logic.
(B2e) Sun Metals Solar Farm
Sun Metals Solar Farm (along with Mount Emerald Wind Farm and Haughton Solar Farm) was already constrained off by some longer-lasting ‘System Normal’ System Strength constraints and played no role in what happened on the day. The ‘Q_NIL_STRGTH_SMSF’ constraint equation had first bound at 21:15 on Monday evening 12th October and so not allowed the plant to start on Tuesday morning.
(B2f) Clare Solar Farm
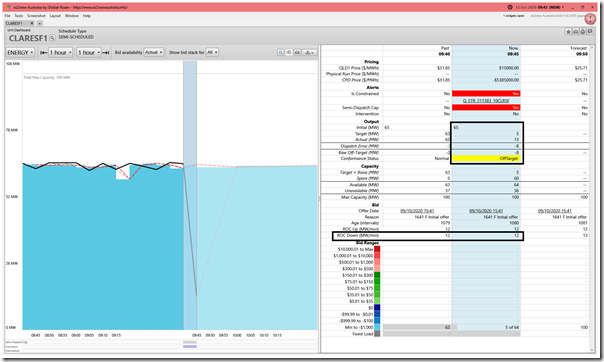
The RRSF1 (above) had been able to be dispatched down to 0MW because of a high ROCDOWN rate. In this case, the CLARESF1 had a ROCDOWN rate of 12 MW/min, which meant a maximum reduction from 65MW to 5MW as shown here:
Also shown in the snapshot here is that the Conformance Status is derived to be ‘Off-Target’ as the unit only manages to reduce to 13MW instead, meaning a Raw Off-Target value of –8MW.
(B2g) Haughton Solar Farm
Haughton Solar Farm (along with Mount Emerald Wind Farm and Sun Metals Solar Farm) was already constrained off by some longer-lasting ‘System Normal’ System Strength constraints and played no role in what happened on the day. Similar to the case for SMCSF1, the ‘Q_NIL_STRGTH_HAUSF’ constraint equation had first bound for HAUGHT11 at 21:15 the evening before, so did not allow the solar farm to get started on Tuesday morning.
(B2h) Pioneer Sugar Mill
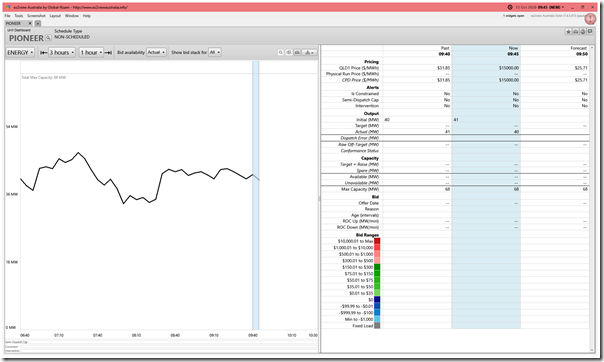
Pioneer Sugar Mill generator was operational through the period of the price spike (one of two synchronous units in northern QLD operating during the period). This is a Non-Scheduled unit:
(B2i) Invicta Sugar Mill
Invicta Sugar Mill generator was not operational through the period of the price spike … or at least that’s what he absence of data from the AEMO implies.
(B2j) Kidston Solar Farm
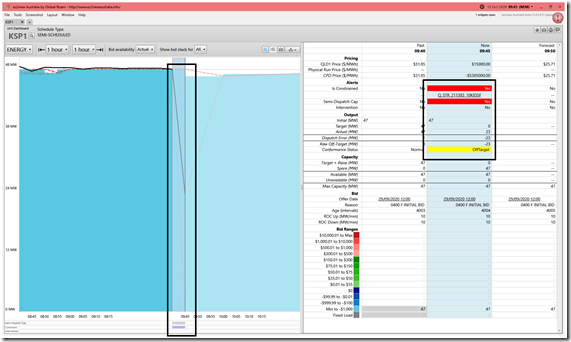
Like CLARESF1 this is another Solar Farm that did not meet its ROCDOWN requirements and so has a ‘Conformance Status’ derived to be ‘Off-Target’ as the unit only manages to reduce to 23MW instead of all the way down to 0MW from 47MW (i.e. a Target reduction of 47MW, which is within its ROCDOWN rate of 10MW/min in its bid). This means a larger Raw Off-Target value of –23MW.
Interestingly, this is one of the units that we’ve seen in our review (like others below) where a unit has appeared to exceed its Target which has meant both:
1) A Conformance Status derived to be ‘Off-Target’ because the Raw Off-Target value of –23MW; and
2) An additional amount of revenue just over $4,000 as a result of the high price in the half hour and the additional volume above that anticipated in the dispatch Target.
CAUTION – in this case, as in the others, we are not aware of why the unit exceeded its Target and our observation here should not be read as any implication of any deliberate non-conformance. We’re merely pointing these out as interesting asides in the process where most units we looked at hit their Targets.
It’s the ‘Q_STR_211383_10KIDSF’ constraint equation that ‘constrains down’ this unit.
(B2k) Hughenden Solar Farm
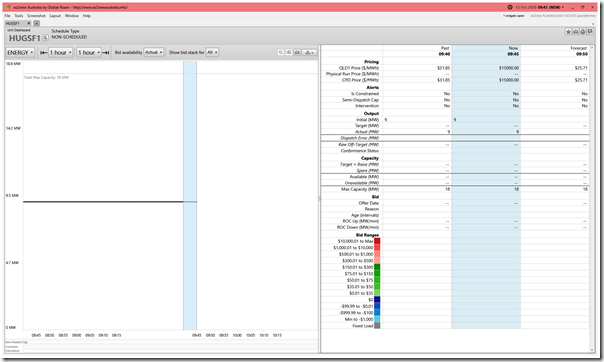
The Hughenden Solar Farm is a small 18MW solar farm that’s Non-Scheduled, and on this occasion sailed right through all the drama:
(B3) ‘North’ Zone
This zone represents supply and demand in and around the area of Mackay in far north Queensland. Importantly, it was a 35MW drop in grid consumption here around 9:34 (as noted in Part 2) which was the immediate trigger for the switch in the RHS on the constraints in the constraint set ‘Q-BCNE_821’ … leading to curtailment of Large Solar in North and Ross zones, and hence the price spike.
It also is the location of the Nebo transmission substation (which is the northern end of the line that Powerlink was conducting an outage on, leading to the constraint set ‘Q-BCNE_821’ being invoked).
(B3a) Daydream Solar Farm
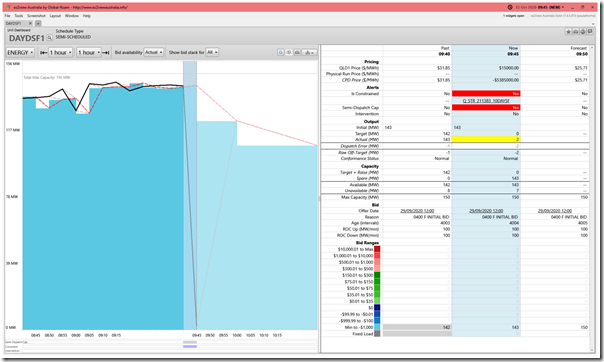
The DAYDSF1 missed its targeted reduction by only 2MW – so has a Conformance Status derived to be ‘Normal’ because the small Raw Off-Target value of –2MW is below the Small/Large trigger levels:
It’s the ‘Q_STR_211383_10DAYSF’ constraint equation that is ‘constraining down’ this unit.
(B3b) Rugby Run Solar Farm
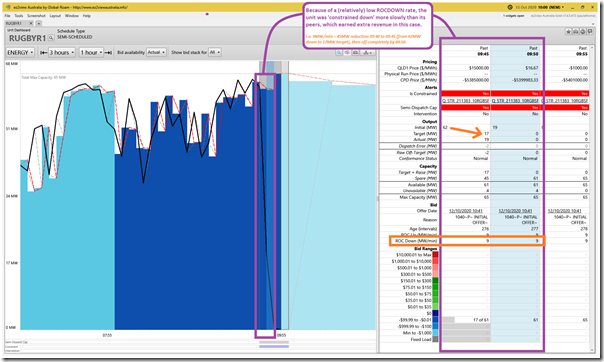
Error Note (Sat 31 Oct 2020):
Was pointed out to me that I had included commentary for Ross River Solar Farm (RRSF1) in here and not Rugby Run Solar Farm (RUGBYR1). This has been corrected with the correct image, and commentary, here now:
The RUGBYR1 had bid a lower ROCDOWN rate of 9MW/min (at least in comparison to its surrounding solar farm peers) and so was limited to –45MW per dispatch interval, which meant it took 2 dispatch intervals to be completely ‘constrained down’ as a result of its particular form of the System Strength constraint ‘Q_STR_211383_10RGBSF’:
In this case, because the trading price was quite healthy for the trading period, this had a beneficial effect for the revenue earned in the half hour.
There was a rebid that took effect in the 10:00 dispatch interval (last DI in the Trading Period) where volume was shifted to to –$1,000/MWh. However the constraint was still bound, so it had no effect.
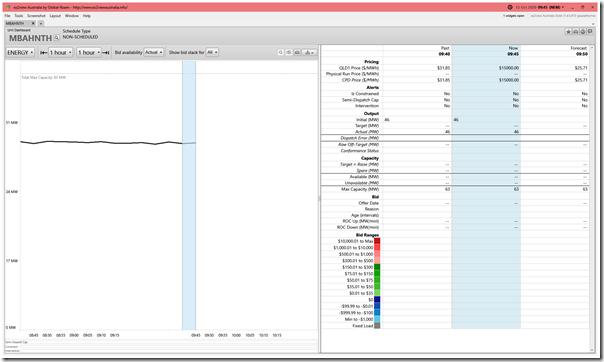
(B3c) Moranbah North Coal Mine Waste Gas Generator
Moranbah North generator was operational through the period of the price spike (one of two synchronous units in northern QLD operating during the period):
This one is also Non-Scheduled (like PIONEER).
(B3d) Hamilton Solar Farm
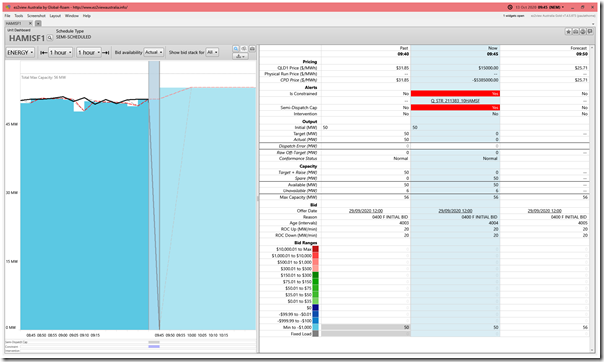
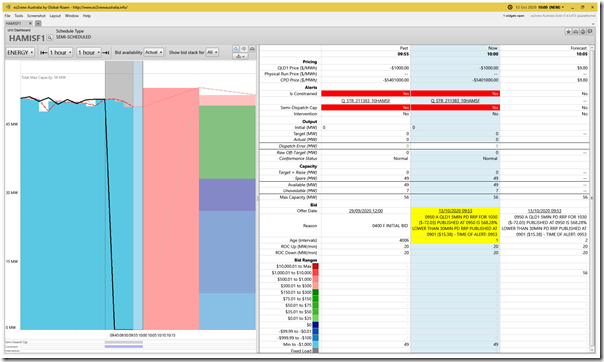
The HAMISF1 unit successfully met its Target of being ‘constrained down’ to 0MW due to the ‘Q_STR_211383_10HAMSF’ constraint equation:
Interestingly, HAMISF1 appears to be one of the units that have engaged one of the auto-bidding algorithms that are now in the market (topical, given the Fluence acquisition of AMS that also happened last week). I noted this later rebid at 10:00 that did not appear to have any real effect on changing outcomes for the plant:
(B2e) Whitsunday Solar Farm
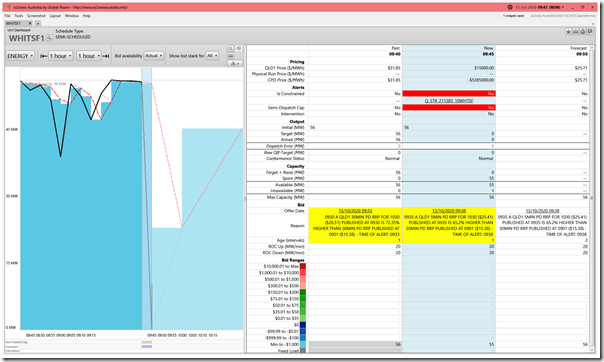
The WHITSF1 successfully met its Target:
We can clearly see another unit here using an auto-bidder (something we’ve noted to analyse, in some detail, in the Generator Report Card 2020 update).
(B2f) Hayman Solar Farm
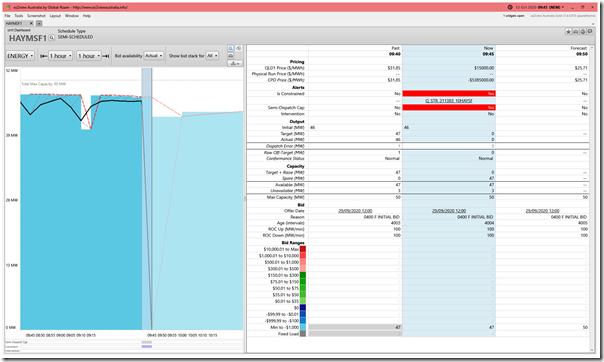
HAYMSF1 successfully follows its ‘constrained down’ Target via the bound ‘Q_STR_211383_10HAYSF’ transmission constraint:
(B2g) Collinsville Solar Farm
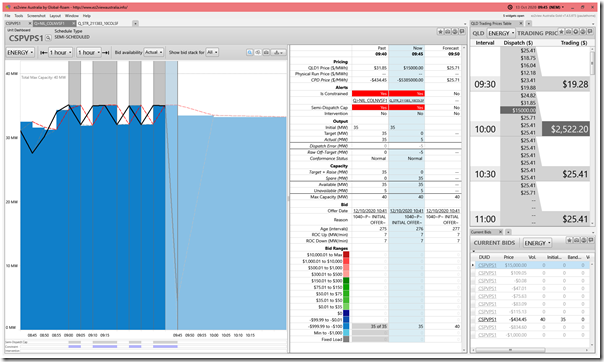
Prior to the main ‘Q_STR_211383_10COLSF’ constraint binding, we also see that the ‘Q>NIL_COLNVSF1’ constraint in the ‘Q-NIL’ constraint set had been limiting the output of CSPVPS1 to 35MW of its 40MW Maximum Capacity. This was part of the reason for the yo-yoing between 35MW and 32MW beforehand:
At 09:45 the Target was slammed to 0MW, which the unit almost met, reaching 5MW instead (a small Raw Off-Target value of –5MW resulting). Interesting that this unit chooses to bid at –$434.45/MWh which is well below ‘negative LGC’ but also well above –$1,000/MWh.
(B2h) Mackay Peaking Generator
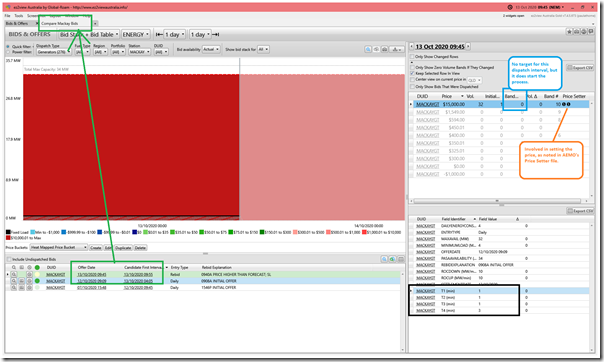
The MACKAYGT is consistently showing an Initial MW value of 1MW which we suspect is SCADA error:
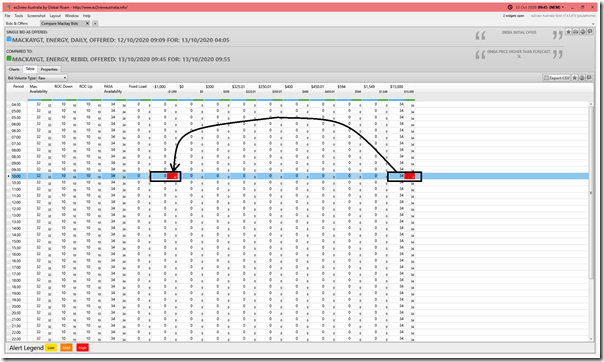
This unit is also registered as ‘Fast Start’, but its T1=T2=T3=1 minute parameters should (we believe) mean it would have received a start signal and been dispatched at 09:45. In this case, a rebid was offered at 09:45 just too late for the 09:50 dispatch run, so taking effect for 09:55. We see here that volume was shifted down to –$1,000/MWh at the RRN in order to make the most volume for the rest of the trading period:
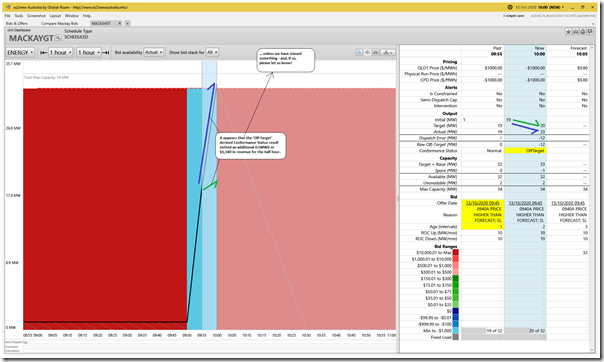
As a result of this, the result at the end of the trading period (i.e. the 10:00 dispatch interval) looked like this:
Interestingly, this is another of the units that we’ve seen in our review (like Kidston Solar Farm above) where a unit has appeared to exceed its Target which has meant both:
1) A Conformance Status derived to be ‘Off-Target’ because the Raw Off-Target value of –12MW; and
2) An additional amount of revenue just over $1,000 as a result of the high price in the half hour and the additional volume above that anticipated in the dispatch Target.
CAUTION 1 – in this case, as in the others, we are not aware of why the unit exceeded its Target and our observation here should not be read as any implication of any deliberate non-conformance. We’re merely pointing these out as interesting asides in the process where most units we looked at hit their Targets.
CAUTION 2 – additionally, keep in mind that this review:
(a) looks at each asset individually (not as a portfolio), and
(b) also does not take into account the co-optimisation component (in terms of FCAS revenues and/or costs); and
(c) also does not take into account hedge levels and the effect of these on behaviours or outcomes
… hence caution needs to be taken in considering what’s been noted for each asset.
(B4) ‘Central-West’ Zone
This zone represents supply and demand in and around the area of Rockhampton and out to the coal mines of the west (e.g. Blackwater etc). It also is the location of the Broadsound transmission substation (which is the southern end of the line that Powerlink was conducting an outage on, leading to the constraint set ‘Q-BCNE_821’ being invoked).
Remember that, from here south, time and space constraints mean that I won’t cover all the generators shown from this zone through to the south, only those which I saw something of interest in via my quick scan…
(B4a) Stanwell Power Station
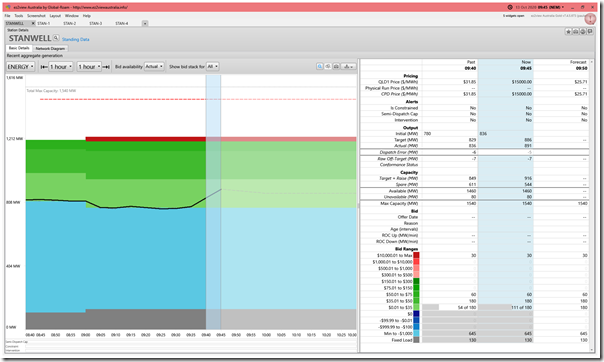
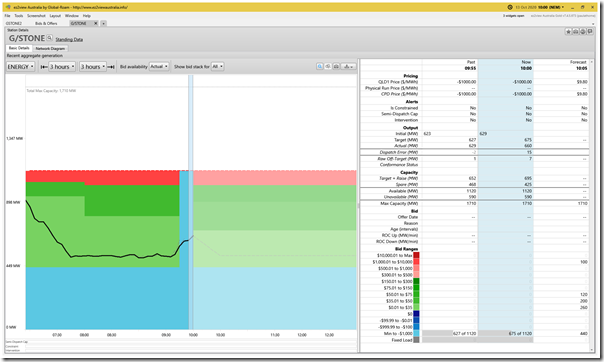
There were 4 units of Stanwell Power Station operational (four dots coloured in on the ‘QLD Schematic’ widget above). Three units were operating normally and Unit 4 on ‘Fixed Load’ with the reason given as ‘Low Load logic commissioning’ (an interesting observation given the plunging level of daytime demand seen in the Queensland region):
Above is a view of aggregate operations across all 4 units for the 09:45 dispatch interval. Output had increased by 56MW in the 09:40 dispatch interval (slightly above Target) and then increased another 55MW in the 09:45 dispatch interval to make up some of the supply lost with the solar farms curtailed.
(B4b) Lilyvale Solar Farm
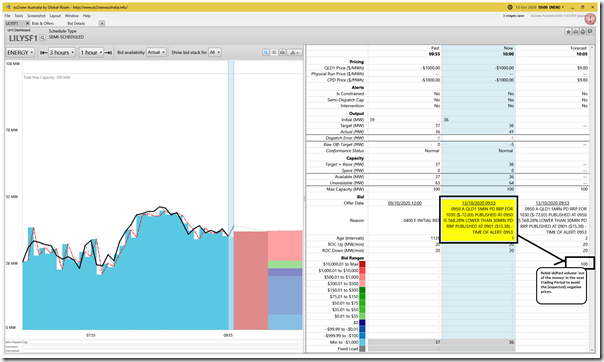
Interestingly, we see LILYSF1 as one of the units not dispatched down in the 09:55 and 10:00 dispatch intervals when the dispatch price dropped to –$1,000/MWh:
… however we do see a rebid offered at 09:50 and received at 09:53 that shifted volume up to the Market Price Cap in the 10:30 Trading Period because of expectations of a negative price trading period ending 10:30. Again the form of that rebid (and the others that followed that day) suggest an auto-bidder in use.
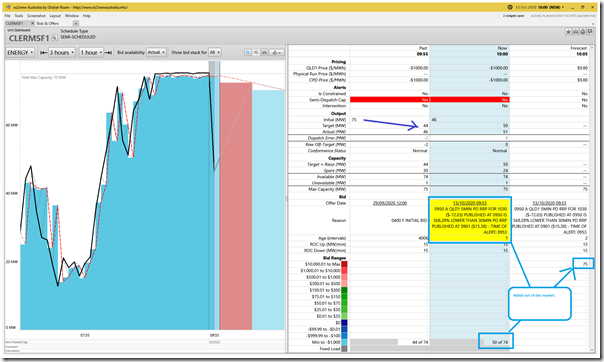
(B4c) Clermont Solar Farm
At nearby CLERMSF1 we see a similar rebidding approach to LILYSF1 (with an automated rebid submitted at 09:53 to move volume to higher priced bid bands for the following trading period):
In this case, we see CLERMSF1 had been ‘dispatched down’ in 09:55 and 10:00 as a result of the negative prices.
(B5) ‘Gladstone’ Zone
This zone represents supply and demand in and around the area of Gladstone, including the major loads there (smelter, 2 refineries and other industrial loads).
(B5a) Gladstone Power Station
There were 4 of the 6 units at Gladstone operational at the time of the price spike (this check was one of the ones used in the RHS of the constraint equations in the constraint set ‘Q-BCNE_821’). Looking at the results in aggregate across all of these units, we see the following pattern:
All available volume was shifted down to –$1,000/MWh at 09:42 when the price spike was first seen – so delivering more volume in the three subsequent dispatch intervals.
(B6) ‘Wide Bay’ Zone
This zone represents supply and demand in and around the area of Hervey Bay etc… and (until the development of Childers and Susan River Solar Farms) did not have sizeable generation of its own.
(B6a) Childers Solar Farm
When this article was published (Thu 22nd Oct) I’d not included commentary on Childers Solar Farm and Susan River Solar Farm as there was nothing that jumped out as ‘out of the ordinary’. However a question was raised so thought it would be better to be explicit.
No illustration included here, but the unit had bid down at -$1,000/MWh and continued through the 10:00 Trading Period in the same way as it had been over recent hours (i.e. not precisely following target, but with ‘Raw Off-Target’ deviations not significantly different than they had been in the hours beforehand).
(B6b) Susan River Solar Farm
When this article was published (Thu 22nd Oct) I’d not included commentary on Childers Solar Farm and Susan River Solar Farm as there was nothing that jumped out as ‘out of the ordinary’. However a question was raised so thought it would be better to be explicit.
No illustration included here, but the unit had bid down at -$1,000/MWh and continued through the 10:00 Trading Period in the same way as it had been over recent hours (i.e. not precisely following target, but with ‘Raw Off-Target’ deviations not significantly different than they had been in the hours beforehand).
(B7) ‘Moreton’ Zone
This zone represents supply and demand in and around the area of Brisbane.
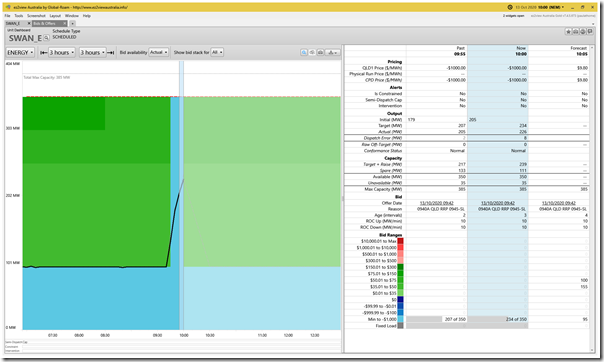
(B7a) Swanbank E Gas-Fired CCGT
The Swanbank E gas-fired plant in southern QLD was another of the plant which was rebid to pick up the shortfall caused by the curtailment of the Large Solar plant, as shown here:
(B7b) Wivenhoe Pumped-Storage Hydro Station
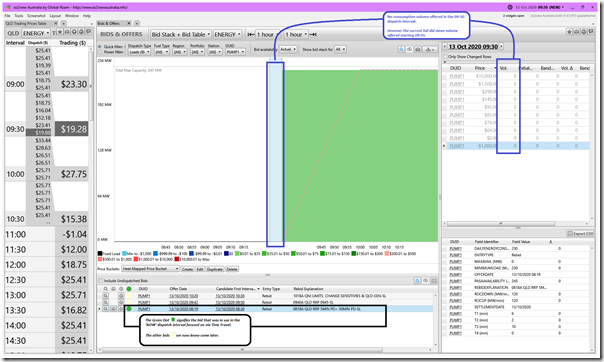
The Wivenhoe Hydro plant, in the Brisbane valley, was an interesting one to watch on the day. Keep in mind that what follows is about the use of the pumped hydro plant as a pump not a generator.
1) At 09:30 … before the trading period starts
Let’s start by looking at what was envisaged in the 09:30 dispatch interval (i.e. the last dispatch interval in the 09:30 trading period). At that time we see that there was no pumping operating – but, at that time, the PUMP1 unit had consumption volume offered at $79/MWh from the next trading period (i.e. would switch on to pump if the price was under $79/MWh at the RRN):
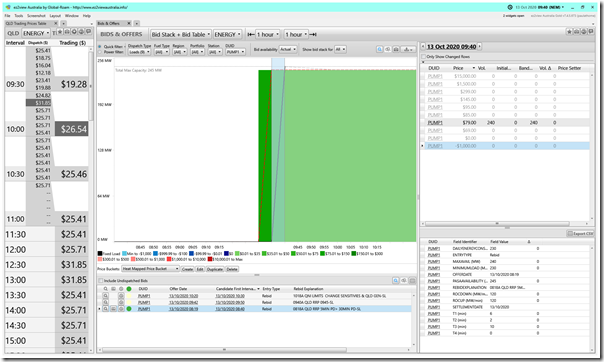
2) At 09:35 … first dispatch interval
The bid becomes active … however FSIP parameters also apply here, as well.
3) At 09:40 … second dispatch interval
Following the T1 (‘time to synchronise’) of 6 minutes in the bid, the unit gets a target of 240MW to be at by the end of the 09:40 dispatch interval:
All appears to be going well (and the price spike that is to come is not forecast at this time). We see in the snapshot below that it successfully reaches its target, which is adding 240MW to the aggregate consumption of the QLD region.
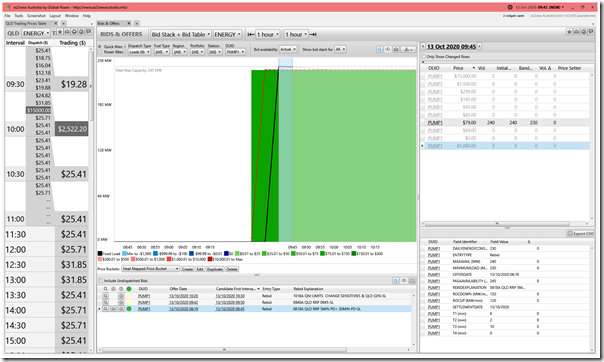
4) At 09:45 … price spike in the third dispatch interval
We now know that the price spike occurs (i.e. above the bid price) but, as a result of T3 in its bid, the unit remains with a band target of 230MW:
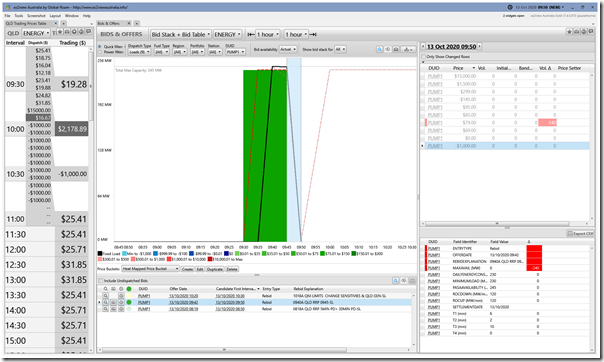
5) At 09:50 … with a rebid
Spurred by the price spike, which they would have seen at 09:40:20 the operator (CleanCo) submits a rebid at 09:42 to remove the plant from the market. This is taken into account in the ~ 09:44:40 NEMDE run for the 09:50 dispatch interval, as a result of which at least two things happen:
Outcome #1 = because of the removal of capacity, the plant is dispatched down to 0MW.
Outcome #2 = because of the sizeable reduction in aggregate demand in QLD region because of the end of Wivenhoe pumping (along with the spot-exposed Demand Response in the Ross Node, as noted above) the price outcome for 09:50 is lower than it would have otherwise been … down at $16.67/MWh.
(B8) ‘Gold Coast’ Zone
This zone sits at the northern end of the Directlink (Terranora) interconnector.
(B9) ‘South-West’ Zone
There are two separate transmission legs that make up the aggregate ‘Central to South’ cut-set (which is itself the subject of other types of constraints that sometimes bind on generation north of this cut-set). The inland Tarong to Calvale route links South-West zone to Central-West zone.
(B9a) Tarong A Coal-Fired Solar Farm
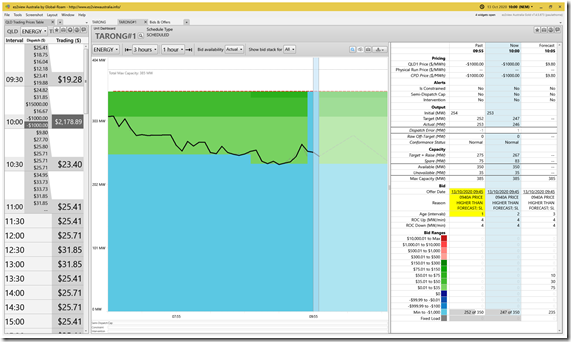
There were 3 of the 4 units at Tarong A station operational (Unit 2 was offline for maintenance).
As would be expected with Unit 1 shown above, the units ramped up at 09:45 in response to the loss of solar power – and then rebid for the remainder of the trading period to maximise volume for the healthy price that resulted.
(B9b) Tarong B Coal-Fired Station
This unit was running ‘fixed load’ and there was no change in output.
(B9c) Oakey Gas-Fired Station
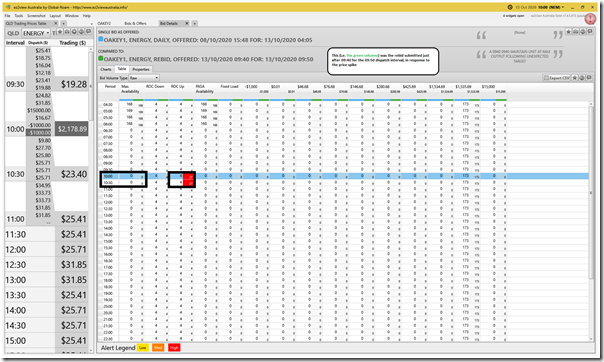
Something might have gone awry with the rebid submitted at 09:40 (i.e. in the light of the price spike) for OAKEY1 and OAKEY2 as shown in the following table:
The rebid reason given was ‘A 0940 0940 MAINTAIN UNIT AT MAX OUTPUT FOLLOWING UNEXPECTED TARGET ’.
I don’t have time to fully think this through – but, if the objective was to ramp the plant up quickly and make the most of the half hour (which seems to be the case, given the increased ROCUP rate from 4MW/min to 27MW/min) then the lack of any volume in the ‘Max Availability’ field in the bid will have meant that the NEMDE will have ignored these intentions…. as a result of which the plant did not run.
(B9d) Oakey 1 Solar Farm
Neighbouring Oakey 1 Solar Farm was one solar farm (by virtue of the fact that it was located south of the ‘zones of constraint’) was affected differently than the ones in the North, Ross and Far North zones:
By it was not totally unaffected.
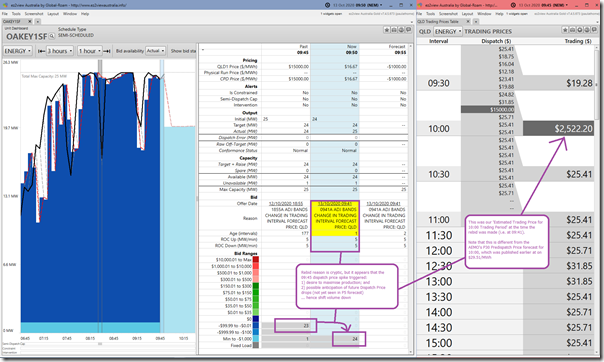
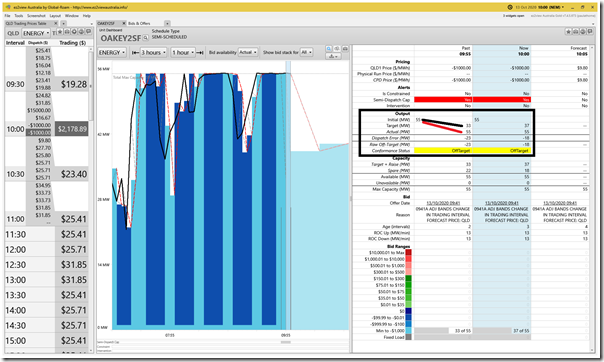
In the ‘Unit Dashboard’ widget snapshot from the 09:50 dispatch interval, straight after the spike, we see the unit shifted all its volume down to –$1,000/MWh at the RRN in order to maximise production even in the case where (as it happened) dispatch prices dropped to –$1,000/MWh as many generators jammed volume in to capture some of the value in the >$2,000/MWh Trading Price for the half hour.
We see (the Price Table Widget on the right, set at the earlier 09:45 dispatch interval) that the rebid was made before the AEMO’s P5 forecasts were showing –$1,000/MWh prices later in the trading period.
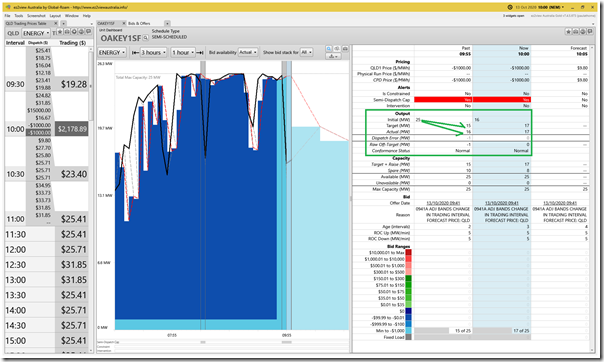
This approached worked well with OAKEY1SF in that they maximised their volume. Shifting the ‘Unit Dashboard’ window forward to 10:00 and we see that the unit was partially ‘dispatched down’ in the 09:55 and 10:00 dispatch intervals because of the Market Price Floor dispatch interval outcomes … and it successfully followed these targets:
This outcome is as NEMDE would expect.
(B9e) Oakey 2 Solar Farm
Unfortunately, something went awry at the larger OAKEY2SF when it tried to adopt the same approach, however.
In this case, the re-creation* of the AEMO’s ‘Conformance Status’ logic within the ‘Unit Dashboard’ widget in ez2view shows that the unit will have been deemed ‘Off-Target’ because it sailed right through the 09:55 and 10:00 dispatch intervals – ignoring NEMDE’s requests to ‘dispatched down’ like its older and smaller sibling next door.
* as an aside, remember that we also re-created this logic to present statistical results for all Scheduled and Semi-Scheduled units for the whole of calendar 2019 in the GSD2019, and will be doing the same at the end of this year in the GSD2020 update.
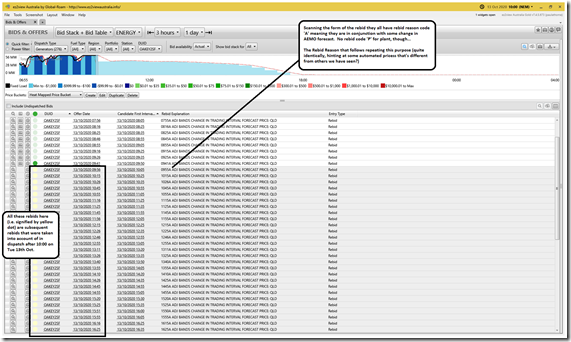
The reasons why this plant (and a couple others above in the list) ignored their targets requesting the units to reduce output are not known, at this point. It seems most likely that this was for some kind of technical reason (as for the other units also noted above). Unfortunately there’s no ‘P’ related rebid issued after this point through the rest of the day that would provide me more information to understand as we can see here in the Bid Table view in ‘Bids & Offers’ Widget:
At the end of the Trading Period, by our calculation the missed Targets delivered an additional windfall gain of $14,000 in added spot market revenue (this does not include LGC revenue). I’m not including this number to imply it was a motivator in this case, but moreso so that readers can understand the scale of the numbers even in this 10 minute case of deviation from Target.
(B9f) Yarranlea Solar Farm Farm
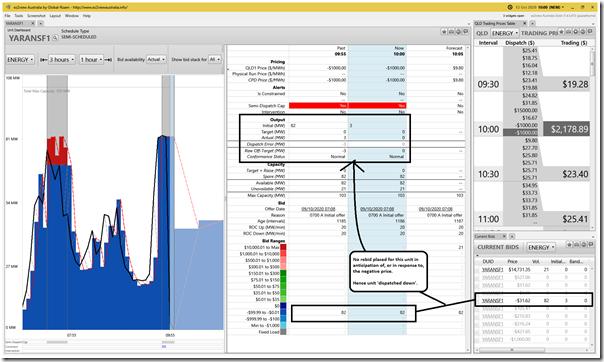
In the case of YARANSF1, the plant had its volume offered at –$31.62/MWh (i.e. around ‘Negative LGC’):
Interestingly, there was no rebid to –$1,000 either:
i. Pro-actively (between ~09:40:20 and ~09:43:40 (roughly ‘gate closure’ for 09:50 NEMDE run)), after the price spiked had been published, but before the price dropped (as was shown for OAKEY1SF above); or
ii. Reactively (after ~09:45:20), after the data update for 09:50 was published including the price drop down to –$1,000/MWh.
Whilst there may have been reasons why no rebid was made, there is the possibility here that there was ‘money left on the table’ by not rebidding here and a trading price guaranteed to be at least $2,000/MWh.
(B9g) Brigalow (i.e. Maryrorough) Solar Farm Farm
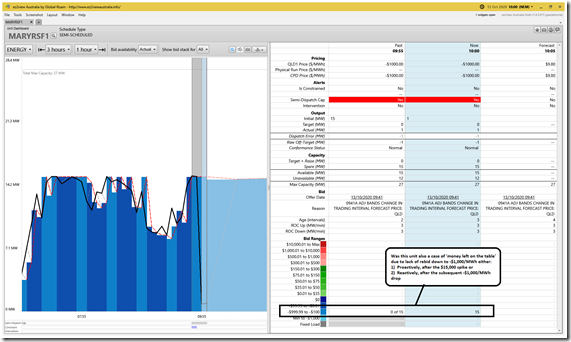
As with YARANSF1 so with MARYRSF1 there is the possibility that there was ‘money left on the table’ by not rebidding here and a trading price guaranteed to be at least $2,000/MWh:
In the case of MARYRSF1, perhaps there was no rebid given the fact that the lowest bid band they had available for the day was only down at –$998.93/MWh at the RRN:
i. In this case, even if they had shifted volume down to this price the unit would have been ‘more expensive’ than the –$1,000/MWh and so still fully dispatched down.
ii. Was it a deliberate tactic (e.g. to be just off the floor and so avoid trading periods of low negative price), or was this a mistake (such as not being updated correctly for Marginal Loss Factor updates from 1st July 2020)? I have not invested time to dig further…
(B10) ‘Surat’ Zone
Heading west out to the coal seam gas fields is the Surat zone, which appeared in Powerlink zonal diagrams a few years back with the advent of upstream (electric-driven) compression of coal seam gas for export from Curtis Island near Gladstone.
The operational units there (Condamine and Roma) were not operating at the time.
Gangarri Solar Farm is not yet operational – but we’re tracking developments there on the Asset Catalog page linked.
(B11) ‘Bulli’ Zone
This zone sits at the northern end of the QNI interconnector.
(B11a) Millmerran Coal-Fired Power Station
Millmerran unit 1 had been operating to this time with 55MW of capacity offered above $10,000/MWh at the RRN (for reasons I have not delved into):
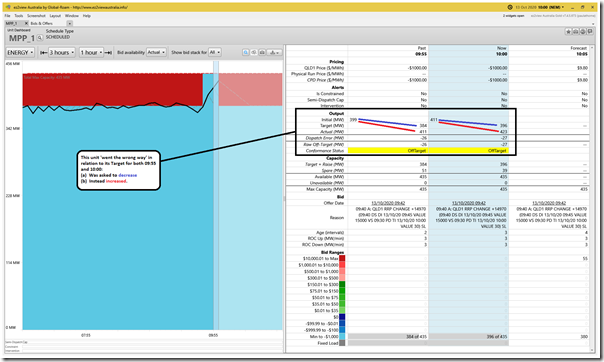
As we can see in the ‘Unit Dashboard’ above, the operator proactively rebid that volume to –$1,000/MWh at 09:40 in response to the publication of the $15,000/MWh price for the dispatch interval ending 09:45. As a result of this, the unit increased output with increased target in the 09:50 dispatch interval. So far so good.
However the price drop to –$1,000/MWh in the 09:55 came with a request to reduce output in the 09:55 dispatch interval (from 399MW to 384MW) but instead the unit continued increasing (399MW to 411MW). The re-creation of the AEMO’s ‘Conformance Status’ logic within the ‘Unit Dashboard’ widget in ez2view shows that the unit will have been deemed ‘Off-Target’ as a result.
As with OAKEY2SF and others above, this resulted in what some might refer to as a ‘windfall gain’ from exceeding target when the trading price is high – which, in this case, would be approximately $6,000.
(B11b) Kogan Creek Coal-Fired Power Station
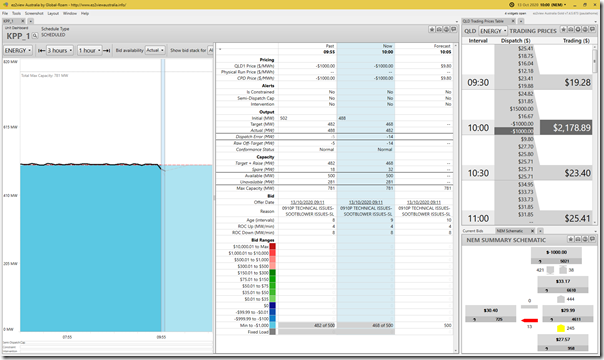
Kogan Creek had been experiencing soot-blower issues recently (see rebid at 09:11) which may have been related to the small deviation from the target shown here for the 10:00 dispatch interval:
Not that (in this case) our re-creation of the AEMO’s ‘Conformance Status’ logic within the ‘Unit Dashboard’ widget in ez2view shows that the unit will still have been deemed to be ‘Normal” in this dispatch interval.
(B11c) Darling Downs Gas-Fired CCGT
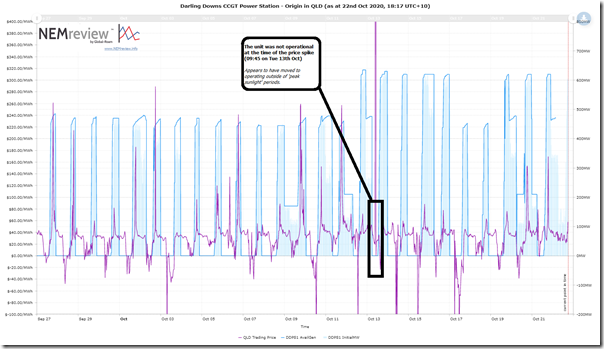
The DDPS1 was not operational through this period.
i. As Greg Jarvis noted (tagged in Asset Catalog), the unit came back from overhaul late in September.
ii. Since that time it appears (using this trend query in NEMreview) that the unit has been operated to avoid the ‘peak sunlight’ periods in QLD where the prices have been negative quite frequently.
iii. As such, it was not operational through the period of the price spike.
(B11d) Braemar A gas-fired station
Oops – hit ‘publish’ late on Thursday 22nd October a bit too soon (without adding in Braemar A, Braemar B and Darling Downs Solar). The following was added later…
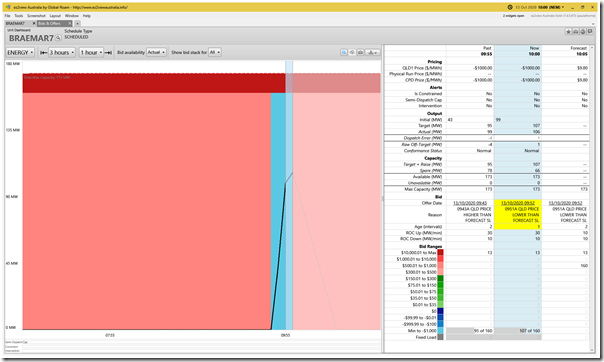
In the ‘A’ station, the units were as follows:
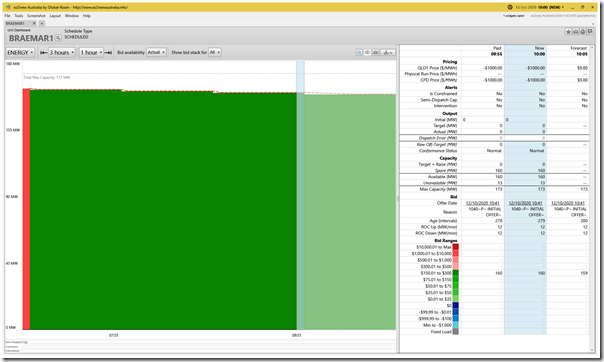
Braemar1 … did not run
For reasons I don’t have time to explore here, BRAEMAR1 did not receive a target, or run:
Braemar2 … failed to start
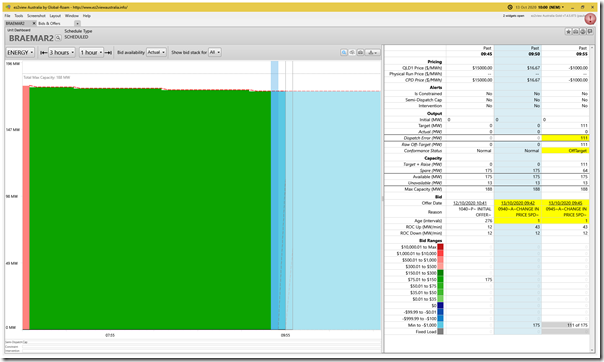
Next door, the BRAEMAR2 unit did move volume down to –$1,000/MWh for the 09:50 dispatch interval. As a result if receive a target for 09:55 and 10:00:
However on both occasions it failed to start.
There was a rebid subsequently issued, but did not take effect until 10:05 with rebid reason ‘0950~P~UNIT TRIPPED TWICE SL~’
The use of the tilde in the bid being a common pattern of a commercial bid submission system that’s not quite the space requested in the AER Rebidding Guidelines, so one of the patterns categorised as ‘Not Well Formed (Strict)’ (and also ‘Well Formed (Loose)’) in the statistical categorisation of bids for the Generator Statistical Digest 2019, and which we will update again for the GSD2020.
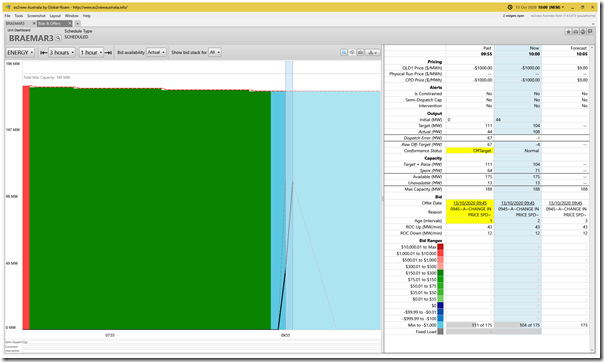
Braemar3 … started successfully
Third unit in the station, BRAEMAR3, did start successfully … albeit a little more slowly than Target in the 09:55 dispatch interval:
(B11e) Braemar B gas-fired station
Oops – hit ‘publish’ late on Thursday 22nd October a bit too soon (without adding in Braemar A, Braemar B and Darling Downs Solar). The following was added later…
Walking through each of these 3 units quickly, we can see the following:
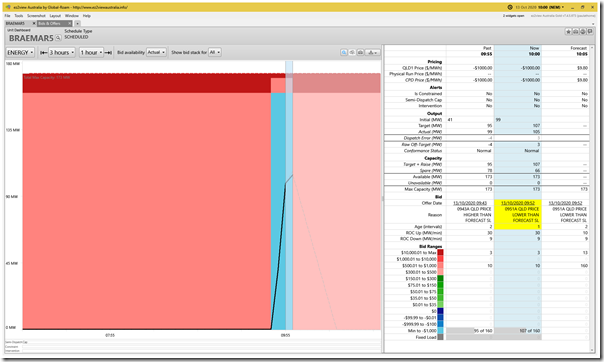
Braemar5
First unit in B Station was rebid to –$1,000/MWh to get a supply for the end of the trading period, and successfully followed Target:
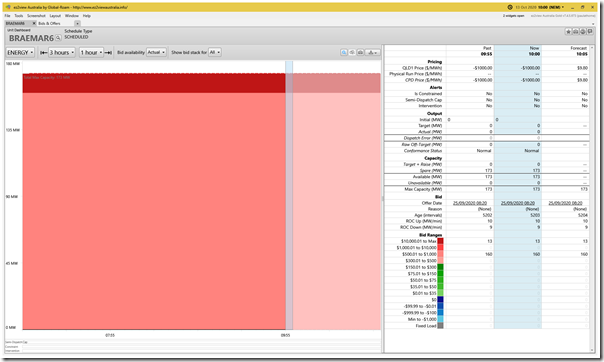
Braemar6
First second unit (BRAEMAR6) in B Station did not factor into the trading period:
Braemar7
First third unit in B Station (BRAEMAR7) also ran similarly to BRAEMAR5:
(B11f) Darling Downs Solar Farm
Oops – hit ‘publish’ late on Thursday 22nd October a bit too soon (without adding in Braemar A, Braemar B and Darling Downs Solar). The following was added later…
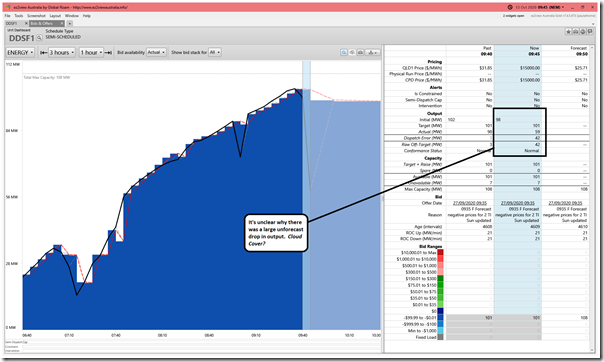
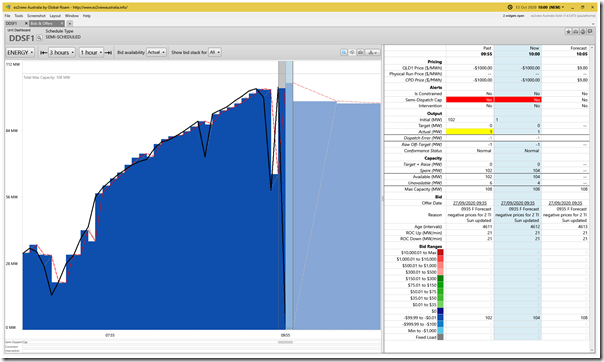
DDSF1 is particularly of interest – because (as noted on the day in Part 1) it had dropped output at 09:45 coincident with the price spike and also coincident with the other 9 x Solar Farms in northern QLD … which we could see next day were ‘constrained down’ due to System Strength. However on the day on Tue 13th October, the fact that this solar farm in southern QLD had also seen a large drop in output coincident with System Strength made me wonder what the possible simultaneous cause was for all the solar farms…
With the benefit of the larger data set now, it’s not clear why the +42MW result for ‘Raw Off-Target’ … but most likely cause would be cloud cover.
On a different note, if we wind forward to 10:00 we see that there was no rebid made in the light of the $15,000/MWh spike at 09:45 – and also none in response to the –$1,000/MWh price drop at 09:55 and 10:00. As a result of this, the unit was ‘dispatched down’ – which represents a lost revenue opportunity:
(B12) Interconnection to NSW
Worth also highlighting the two interconnectors to NSW.
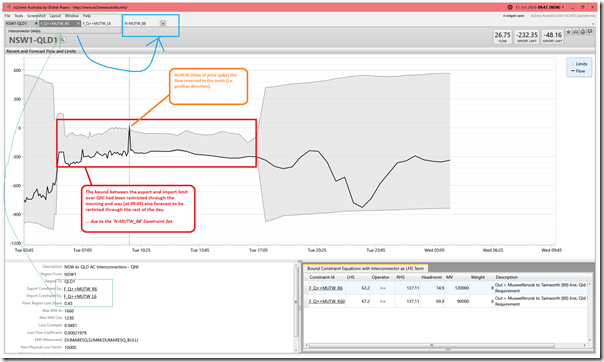
(B12a) QNI Interconnector
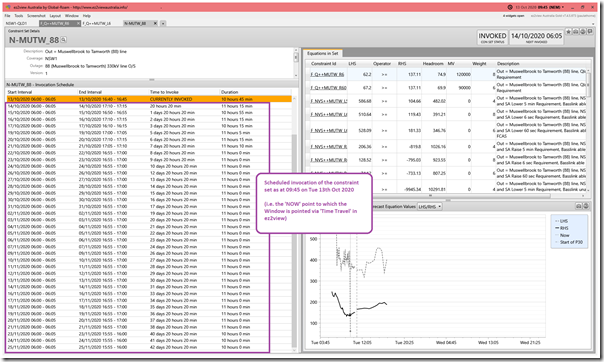
It’s worth noting both exports to QLD and imports to NSW over QNI had been restricted to QNI through the daylight period on this day as a result of the ‘N-MUTW_88’ Constraint Set:
As shown in the linkages on the image above, the limitation on the flow was due to outage on the Muswellbrook to Tamworth (88) line, which is an outage that was (on Tue 13th Oct) scheduled to proceed through to the 25th November 2020:
(B12b) Directlink (Terranora) Interconnector
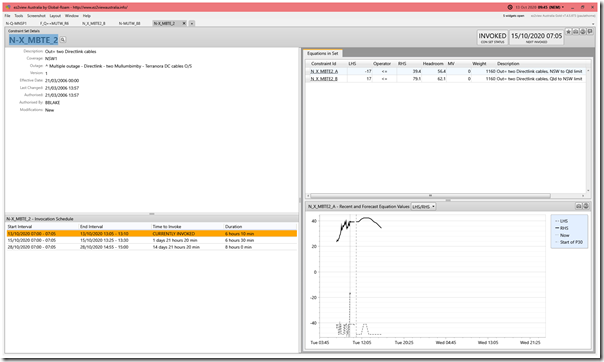
Capacity of the M-N-MNSP1 was also restricted by the same outage above … but also by the ‘N-X_MBTE_2’ constraint set (which relates to outage of two Directlink cables).
(B13) But wait, there’s probably more!
We’ve walked through much of the Queensland region to look at what was happening for the ENERGY commodity in that 10:00 Trading Period (and especially the 09:45 Dispatch Price spike).
(B13a) We’ve not considered Co-Optimisation
But let’s not forget that there are 9 separate (but linked) commodity and that the Contingency Raise (6 second price) also spiked at the same time.
Worth noting that some of the suppliers of ENERGY in QLD would have been held down from delivering ‘full’ output to provide headroom for enablement for FCAS Raise Services (either or both Regulation and/or Contingency) via NEMDE’s co-optimisation process.
Also worth noting that each of the generators noted above will have had differing exposures to the cost of FCAS … both:
i. Regulation Raise and Lower, via the ‘Causer Pays’ Method; and
ii. Contingency Raise.
(B13b) We’ve not considered contract cover
We’ve also not considered the level of hedging – and what that might have meant in terms of either (or both) behaviours in the spot market, and combined returns.
(B13c) We’ve not considered portfolio considerations
Also as noted above, we’ve not considered the net effect of any of the above outcomes for discrete units across the portfolios that contain them.
Alas, no time to delve into this here…
(C) Why are we investing our time in these Case Studies?
This is not the first Case Study we’ve prepared on WattClarity. Indeed, it’s a deliberate focus of what we do – taking interesting events and unpicking them (using our software like ez2view where we can) to see what we can see.
(C1) Stretching our (software) capabilities
Part of the reason I have invested so much time in this progressively developed Case Study is because these types of incidents are quite informative in helping us understand how our software can continue be improved, in order to make complex events more clearly and quickly understandable than they would otherwise be.
We’ve come a long way in the 10+ continuous years we’ve been investing a large amount of time and money into the ez2view software – but events like this help to remind us that we have a long way still left to go to ensure if delivers everything that we want it to.
Let us know if you know of others who can help us with that!
In this sense, what happened Tuesday (whilst quite complex and not completely visible in real time – not to mention expensive for some participants!), is proving a goldmine of information for us to wade through…
(C2) Of value to readers of WattClarity®
Keeping in mind that it’s the above objective that is the primary driver (so sometimes helps to shape the priorities we assign to different pieces of analysis we could pursue) we hope that the insights shared freely here on WattClarity will be of interest to our readers.
Please do feel free to point out where you think we have made mistakes, or misinterpretations (gratefully welcomed!).
(C3) Food for thought for ‘Deeper Insights’ Publications
On 31st May 2019 we released our Generator Report Card 2018 , developed in conjunction with GVSC and with the help of others, following an extensive period of preparation. That 530-page report was very well received across a broad swathe of the National Electricity Market, and many requests have been made for us to continue delivering value like this with periodic updates.
We’re contemplating a Generator Report Card 2020 update.
Hitting ‘pause’ on some other projects to allow enough time to prepare these Case Studies also helps us (including with reflection on the comments and feedback we receive) to think through areas worth deeper analysis and thinking in a focused way through something like the GRC2020.


Leave a comment