On Friday last week, Marcelle Gannon published some thoughts about ‘Semi-scheduled generation–what are the real issues?’ in response to a consultation being conducted by the Australian Energy Regulator (AER) about two particular issues they see emerging with semi-scheduled generators.
Marcelle has been with us now for four months, and we have greatly appreciated the way in which she has (challenged us and) enhanced the value we deliver to our clients through our software … and also through occasional articles on WattClarity like the one from last week.
———-
Today I am posting my own thoughts – driven particularly by today’s deadline for submissions to the AER’s Issues Paper, but moreso with a mind to the broader challenges we face as part of this accelerating transition to NEM 2.0.
Sadly, given the political climate, I feel the need to stress that the following pertains to the type of registration and not, specifically, to the technology type.
(A) Background
Especially in this case it might help to provide some background to what follows from (B) below.
(A1) About the AER Discussion Paper
There was a useful and well-attended information forum which the AER conducted on Thursday 2nd July which provided food for thought – both in what was officially presented, but also in the chat room dialogue that was operating in parallel.
Amongst other things I learnt of the reason why the AER was conducting this consultation, rather than just handing a rule change proposal to the AEMC (which is what I thought they might do). Turns out that, in order to activate the AEMC’s ‘fast-track’ process, the Rule Change Proponent (AER in this case) needs to demonstrate that they have already conducted a consultation process.
Perhaps I should have already known this, but it helped me clarify why the AER (and not the AEMC, which I had thought would be their role) was conducting the consultation process. Submissions on this are due Friday 24th July (i.e. today).
(A1a) What’s in the AER Discussion Paper?
The COAG Energy Council asked the AER to prepare two rule changes to submit to the Australian Energy Market Commission (AEMC) relating to the operation of semi-scheduled generation. This request was one part of the Energy Council’s interim security measures work program:
|
Rule Change #1 = That semi scheduled generators be obligated to follow their dispatch targets in a similar manner to scheduled generators |
Rule Change #2 = Semi scheduled generators being required to continually inform AEMO of any restrictions on their available capacity due to physical factors, ambient weather conditions and their market intentions. |
|
My reading of what the AER says is that there’s really two discrete aspects of this: Aspect 1) Firstly there’s a challenge in relation to a Semi-Scheduled unit (or units, collectively) being at significantly different levels at the end of the Dispatch Interval than was the expectation at the start of the Interval (i.e. in their Target): As the AER document progresses, the focus seems to narrow from a consideration of all Dispatch Intervals, to only those: On p13 of the paper, the AER notes:
Aspect 2) On top of the end-of-interval mismatch, there’s a related issued discussed in the paper with respect to some Semi-Scheduled generators not ramping linearly within the Dispatch Interval. Also in the paper, this ‘faster than anticipated ramping’ is also shown in relation to instances of the “bad behaviour”* flagged by the AER The AER posits that these actions, together, will impose extra costs on the market over time. The need for more Regulation FCAS is cited as one example of this. ————— * I first explored the type of “bad behaviour” that’s the subject of this enquiry back in mid-2018 in this article. When I wrote that article, I wondered how such behaviour would be viewed in terms of bids not being ‘false and misleading’ . However in the AER Forum it was pointed out that such behaviour is not currently disallowed in the rules – though there are a number of people (i.e. Paradigm #1) for whom it does not sit right. |
Coincidentally, I spoke at an AIE-organised event last Friday on ‘heat stress’ effects on generation plant. In doing this I revisited what I saw as the 1st Headline Event that occurred over the prior summer – an event that (I understand) provided the motivation behind this part of the rule change request. ————- This separate request from the COAG Energy Council receives less discussion inside of the discussion paper (and very little in the forum on 2nd July). This was done as it was reasoned that the logical approach to take with respect to AEMO’s awareness of restrictions on plant capability would vary depending on the approach eventually taken in Rule Change #1. Specifically: Scenario 1) were the Semi-Scheduled category be abolished (one of the possibilities identified) then the wind and solar generators would revert to the method by currently Scheduled generators to inform AEMO of such limitations – i.e. through their bids. Scenario 2) if the Semi-Scheduled category persists in some form, there might need to be changes to Rules and/or Procedures relating to the provision of data via the AEMO Intermittent Generation Portal (which operates separately to the Bid Submission process). |
.
(A1b) Marcelle’s thoughts
Marcelle’s thoughts here on WattClarity are well worth everyone considering, and there are follow-on comments popping up in a variety of different locations (such as here on LinkedIn and on RenewEconomy here). Here’s two things I would like to highlight from that article that particularly resonated with me:
1) Marcelle refers to the need to understand scalability …
‘The aggregate dispatch error due to random fluctuations of the wind or solar resources (the intermittency) across renewable generators can be studied statistically as AEMO has done in the recent Renewable Integration Study, and expectations formed on how manageable it is (including whether it is scalable in the future).’
2) Most importantly, Marcelle highlights the need to first identify the real problem, before flipping into solution mode
For me, part of the challenge in identifying ‘the problem’ is understanding what the timeframe is of the consideration. To put it another way, it seems to me we spend far too much time trying to solve yesterday’s problems and not enough time working out what tomorrow’s problems will be.
.
(A2) About the process of moving towards ‘NEM 2.0’
As I have noted before, to me it seems about 5 years too late that we’ve collectively started the process of thinking through what ‘NEM 2.0’ should look like, in order to ensure that this energy transition should actually succeed.
1) The lack of this broader view, whilst too many squabbled with just a two-dimensional view that it was all ‘just’ about carbon policy, is why I made the broad forecast of a train wreck unfolding back now 3 years ago.
2) It’s why we collaborated with Jonathon Dyson’s team at GVSC to invest our 10,000 hours in the preparation of the Generator Report Card 2018, released over a year ago now (and why we’re seeking to update this widely regarded analysis for release sometime in 2021).
3) Better late than never, we were pleased to see some movement – though through the Energy Security Board (ESB) and not the AEMC (which I found a bit strange) – towards consideration of a broader ‘NEM 2.0’ with a notional start date of 2025.
However (just as Marcelle highlighted with the AER Discussion Paper) it seemed that we all-too-quickly jumped from ‘what are the underlying problems’ mode to ‘solution mode’ with respect to NEM 2.0 as well. In the case of the deliberations by the ESB for the COAG Energy Council, we ended up with discussions about a ‘Two-Sided Market’ and ‘System Security and Ahead Markets’.
I will endeavour to post more thoughts relating to the broader NEM 2.0 challenges the next couple weeks – because the challenges facing the NEM are broader than just relevant to Semi-Scheduled generators. Here’s a starting framework for how I’m thinking of them – and where the AER Issues Paper (fits in):
|
About ‘Energy’ |
About ‘Keeping the Lights on’ Services |
|
The AER Issues Paper seems to have an almost singular focus on Energy. |
In the two papers published by the COAG Energy Council on 20th April, they used the term ‘System Services’ to describe these types of requirements. When we were writing our Generator Report Card 2018 a year beforehand, we used the term ‘Keeping the Lights On’ Services to hopefully convey that: On 9th March this year we flagged some of the discussions from the GRC2018 by highlighting how we’re concerned that ‘We’ve been killing New Entrants with kindness’ by enabling this Schism to emerge: —————– I raise this here in this article to flag that the AER Issues Paper does not directly consider any of these ‘Keeping the Lights on Services’ in the context of the discussions. Certainly aspects of a functioning electricity Market and System that will need to be considered, at a detailed technical level, to ensure that: |
Drilling further into the ‘Energy’ basket, then I find it’s sometime helpful to think in terms of the following type of mental matrix:
|
. |
ENERGY Within the dispatch interval |
ENERGY Dispatch timeframe |
ENERGY Longer timeframe |
|
Semi-Scheduled Generator (the AER Issues paper focuses only on these) |
This time-frame is discussed specifically with respect to ramp rates. |
This is the central focus of the AER Issues Paper |
Not a real focus of the AER Issues Paper, though it is relevant to Rule Change #2 nominated by the COAG Energy Council |
|
Non-Scheduled Generators |
Not considered by the AER – hence not addressed in this article. In particular, there are three particular types of ‘Generator’ which I’d see as a significant emerging challenge for balancing Supply and Demand in future – being: 1) Sizeable but Non-Scheduled Solar Farms (perhaps not even registered). In the interests of completeness I should flag that we’re involved in helping a growing number of these types of Solar Farms (perhaps just under 5MW in size) to switch off when prices are negative – all automatically done, and none of it transparent to the AEMO. 2) Sizeable Batteries of up to 4.9MW in size that are below the registration threshold currently set by the AEMO but which could, in aggregate, have a significant effect on System Security. 3) Distributed Energy Resources, particularly at a residential level. In addition to our own personal interests in this type of technology, as a company we’ve been aware of challenges in this space for some time – hence the interest in the R&D project undertaken surrounding an Energy Storage Register, in conjunction with the Smart Energy Council. |
||
|
Scheduled Generators |
Not considered by the AER – hence not addressed in this article. |
||
|
Scheduled Loads |
Not considered by the AER – hence not addressed in this article. |
||
|
Non-Scheduled (and most often not even Registered) Loads |
Not considered by the AER – hence not addressed in this article. In particular, there are several types of ‘Load’ which I’d see as a significant emerging challenge for balancing Supply and Demand in future – being: 1) Large Energy Users, spot exposed. As I noted in January 2019, we have been involved for well over a decade in working with energy users like this to facilitate a particular type of Demand Response for energy users operating in this way. There’s a benefit the energy user receives in doing this – but we’re aware it’s not without some broader costs and challenges. 2) The ‘ghost electrons’ and ‘NegaWatts’ that will be created from nothing, starting 1st October 2021: There are challenges in this approach that mean it will not scale, as discussed in June 2020, and before that in July 2019, which followed from March 2019. 3) The Load component of those sizeable batteries (up to 4.9MW) mentioned above. |
||
Finally, I’d make two other high-level observation:
1) there seems the risk that we’ll end up tripping over each other with parallelized ‘market reform’ efforts running in a variety of different places; and
2) that we may achieve a better overall outcome by considering all aspects of the above at the same time, in the same process (sort of like what I understand was done by the NGMC prior to the start of NEM 1.0) because of the risk otherwise that each stakeholders in the NEM will tend to focus specifically (i.e. narrowly) on what they stand to lose by any particular aspect of a rule change if they are being considered:
(a) Sequentially, and
(b) In isolation from each other.
… indeed, that’s what I thought (or at least hoped!) that the NEM 2.0 process being coordinated by the ESB might achieve.
(B) My take on what the ‘problems’ actually are
Keeping in mind the mental matrix above, I’ve narrowed my comments below to reflect the scope of the AER issues paper, which is:
1st Point of Narrowing = just considering Semi-Scheduled category, which is what COAG Energy Council required
2nd Point of Narrowing = only considering Energy (not directly considering ‘Keeping the Lights on’ Services)
3rd Point of Narrowing = only really considering the current Dispatch Interval, with not much discussion of the (quite separate, but just as technically complex) issues of the forward looking forecast horizons
Note that the AER seems to take a 4th Point of Narrowing in thinking particularly about negative prices (which do look set to continue increasing in prevalence), but this seems to me to be too narrow a focus, as explained below.
With that in mind, there seems two separate issues:
|
Issue #1) About perceived “bad behaviour” of some Semi-Scheduled generators in some instances … being viewed by some others as ‘not honouring their bids‘ |
In my short musical take on the Issues Paper, I noted how:
Marcelle noted in last Friday’s article with respect to:
(that…)
To me it’s clear that: To use the political lingo of the day, it seems unlikely to ‘pass the pub test’. Something needs to be changed for, if it is not (and with an increasing number of periods being subject to negative prices in all regions) the use of the behaviour will increase to unsustainable levels. Not sure I need to say more about this? |
|
Issue #2) About unpredictable changes in output. |
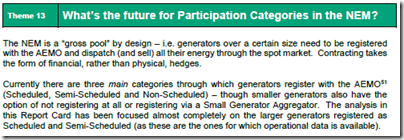
To me there are broader questions about the growing scale of this challenge that relate to every dispatch interval – not just those: 1) with negative pricing, and 2) deliberate behaviour that’s inverse to what might be implied from dispatch targets. The issue of whether the Semi-Scheduled category can scale successfully into the future is one that I have been puzzling about for some time. For instance: 1) It was, for instance, something we questioned in the Generator Report Card 2018 – specifically in Theme 13 within Part 2 of the 180-page analytical component within the GRC2018: 2) On 5th May 2020 I posted ‘Balancing Supply and Demand …. in the fast approaching ‘NEM 2.0’ world’, in which I explored this question a little further. This followed from a number of specific Case Studies I’d prepared on particularly interesting series of dispatch intervals. It’s this particular challenge I would like to focus on in this article. |
|
Issue #3) About the rate of change in output |
Don’t have anything specifically to add on this issue today. |
.
(C) Analysing ‘Aggregate Raw Off-Target’ for all Semi-Scheduled plant
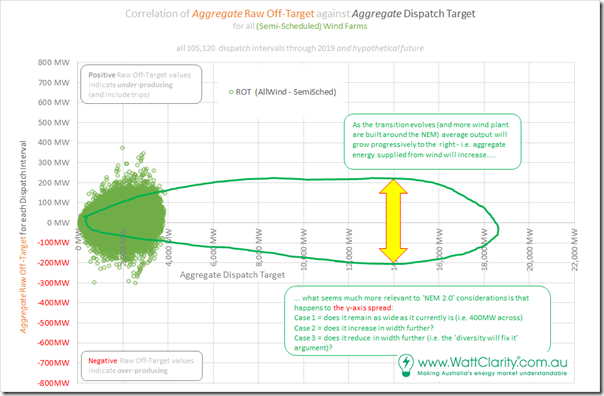
So in this article we’re going to extend on our analysis which I presented in this article in May. In that article, I pondered what would happen in the years ahead to the distribution of outcomes in the following correlation view of aggregate Raw Off-Target against aggregate Dispatch Target – the question sketched into the following diagram:
The key question in terms of scalability is not so much about the x-axis spread (which is just a ‘simple’ function of installed capacity, ultimately) but moreso what would happen to the y-axis spread. The broader the spread of the y-axis:
1) The larger the ranges of ‘unexpected outcome’ the AEMO would have to manage with ‘keeping the lights on’ Services in those years ahead; and
2) The more difficult this would be – potentially involving more risk than the NEM currently sees; and
3) The higher the cost in management. If the shape of ‘unexpected outcome’ the AEMO might see were to be substantially larger, as a minimum the AEMO would need to procure a larger volume of Regulation FCAS – and perhaps Contingency FCAS as well.
(C1) Taking the question forward
Naturally, no-one can ‘know’ what the future has in store for us, but it seemed certain to me that we would be taking a step towards seeing a clearer picture if we took two key steps:
Step 1 = if we prepared a different aggregation – this time of ‘Raw Off-Target for all Semi-Scheduled Plant’ (i.e. all Wind and also all Solar); and also
Step 2 = analyzed of the entire time range over which that the Semi-Scheduled plant have been active:
2a) This stretched as far back to April 2009 – so providing over 10 years of progressive data
2b) We reasoned that, whilst we can’t see the future, at least we could gain some hints to what might be in store by looking at patterns that have emerged over the past 10 years
… assuming nothing significant changes with the Semi-Scheduled category (which is, of course, what the COAG Energy Council has asked the AER to consider, and which we’re all being consulted on as a result).
(C2) Detailed Analysis
The analytically minded readers can read through more of what I’ve done in this related article which will be coming soon LINK TO COME WHEN I GET THE ARTICLE UP!.
(D) Headline results
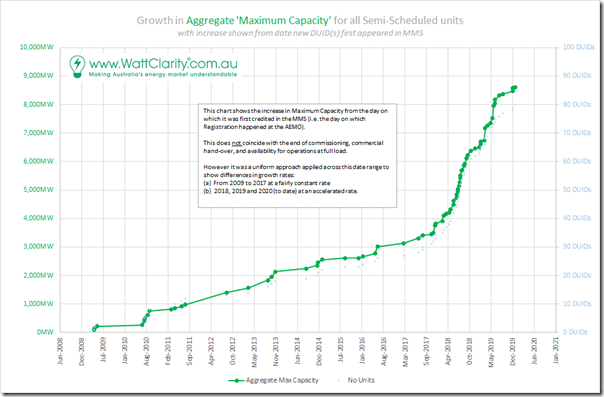
As shown in the following trend, the NEM currently has 80 DUIDs (i.e. notional units) representing a total ‘Maximum Capacity’ registered with AEMO that is approaching 9,000MW. These are a mix of wind farm units and solar farm units, with slightly more wind farm units (though solar will catch and overtake this in the next year or two):
Observation #1) There’s clearly been an accelerated pace of new developments reaching ‘Registered’ status with the AEMO in the past 3 years.
It’s worth reminding our readers that on 28th January 2020, in conjunction with the release of the GSD2019, I posted this article ‘Review of extremes in Raw Off Target performance through 2019, with the Generator Statistical Digest 2019’ which included a view of the extremes in ‘Raw Off-Target’ outcome seen for each of these units through CAL 2019.
In terms of the broader supply/demand balance consideration, however, it’s more important to look at their aggregate performance, however.
In the scatter plot above (for the ‘all Wind’ aggregation) keep in mind that there are 105,120 data points shown in the correlation – which is how many dispatch intervals there were in 2009 (all years except leap years).
1) Given we have over 10 years of data to consider we now have over 1,000,000 data points; and
2) We’re interested in the trends of distributions.
… hence we needed to do some thinking about the best ways of representing this data.
(D1) The trend of ‘Worst’ Outcomes
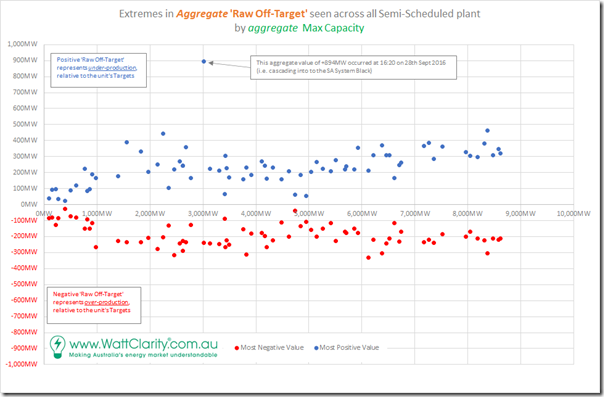
So to start with, here is a simple correlation plot of the ‘worst’ outcomes in either direction (for aggregate Raw Off-Target) plotted against the level of the aggregate Maximum Capacity at the time.
Whilst there are 80 DUIDs registered as Semi-Scheduled, there are only 73 pairs of Red+Blue points. This happens because on some occasions multiple DUIDs were registered on the same day.
Also be very clear that:
1) the x-axis is not equivalent to a date axis (though there is a correlation between increase in Max Capacity and increase in Date); and
2) because the elapsed time between different increments in Maximum Capacity are different (i.e. shorter as we move to the right, as we can see from the growth in capacity chart) this meant less time at that level of Max Capacity for those extreme events to register.
2a) Restating Observation #1 numerically, there was roughly 7 times the amount of elapsed time between 0MW and 4000MW than there was between 4000MW and over 8000MW.
2b) Hence, in looking at the spread shown, keep in mind that the dots on the right-hand end had much less time to experience conditions that might lead to ‘worst’ outcomes.
Hence, we can make some follow-on observations
Observation #2) It is clear that the ‘worst’ outcomes for positive aggregate Raw Off-Target (i.e. blue dots) are larger than the ‘worst’ outcomes for negative aggregate Raw Off-Target (i.e. red dots):
#2a) The blue dots represent dispatch intervals where collectively the Semi-Scheduled generators under-performed, compared to the aggregate Target.
#2b) The red dots represent dispatch intervals where collectively the Semi-Scheduled generators over-performed, compared to the aggregate Target.
#2c) It is quite understandable that under-performance would show larger extremes than over-performance for a variety of different reasons:
(i) Unanticipated curtailment at times of negative pricing would contribute (though would seem to be a very small share of these instances – which is not to dismiss the seriousness of that issue, especially if that pattern of behaviour were to be reinforced as a result of this rule change deliberation);
(ii) A larger contributor would be the way in which the Target acts as a cap during periods where the Semi-Dispatch Cap flag is on (i.e. providing the incentive for generators to be under, not over, the Target); and
(iii) My suspicion is that some of this is also the outcome of other quirks in the way in which the Target is determined for intervals where the SDC is not in play.
#2d) Whatever the reason, the fact that there are large instances of aggregate Raw Off-Target with installed capacity still just below 9,000MW seems to me to represent a challenge moving forward as the installed capacity of Semi-Scheduled plant grows.
Observation #3) Looking left to right, there is a trend for increase in the ‘worst’ outcomes as more Capacity is added – though there is a noticeable degree of randomness involved.
(D2) The changing spread of outcomes
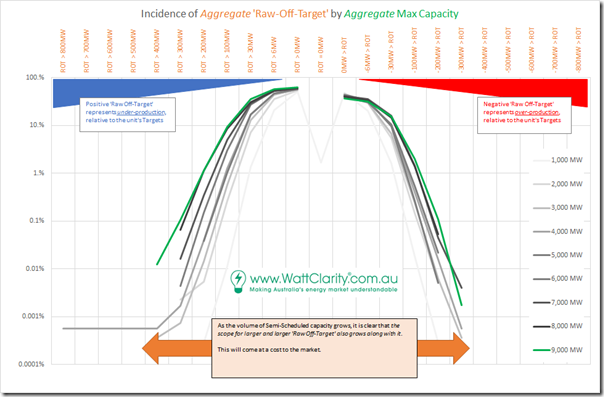
With >105,000 data points per year I thought I would start with the spread of outcomes, which I have done in the following chart (click on any of these charts to open in larger view):
To create this trended distribution, what I did was as follows:
Step 1 = I mapped the aggregate Raw Off-Target figure in every dispatch interval to the aggregate Maximum Capacity in that same dispatch interval;
Step 2 = then rounded up the aggregate Maximum Capacity to the nearest 1000MW in order to produce 9 groups of outcomes:
Note that this created 9 groups each with a different number of entries. Because the growth in capacity has accelerated more recently, the 8000MW ‘bucket’ has far fewer entries than the 2000MW bucket (for instance).
Step 3 = with each of these 9 groups, I individually distributed the outcomes in the buckets shown in the x-axis of the chart above. It is the deviations shown furthest from the middle of the chart that are the largest (in MW) but also the least frequent (in count of Dispatch Intervals).
Step 4 = to normalise these 9 groups, I then divided the incidence in a sub-bucket (i.e. # DIs) by the total number of DIs in that MaxCap Range and showed that as a percentage.
Step 5 = I plotted as this chart with a log scale on the y-axis to make the small percentage numbers (low absolute number, but still quite significant) still visible.
Step 6 = I have also included this data is also shown in tabular form later in the article.
Observation #4) We see higher incidence on the left-hand side of the chart (i.e. under-generation) than on the right (i.e. over-generation).
#4a) In other words, under-generation is more common than over-generation, in aggregate across all Semi-Scheduled units;
#4b) This pattern is the same in every MaxCap Range.
Observation #5) We see that the distribution of outcomes is diverging as the installed capacity is growing.
#5a) To be clear, this happened through 2019 even though we now have 80 separate wind and solar DUIDs collectively feeding into the grid.
#5a) Hence there will be an increasing number of ‘extreme’ outcomes as the installed capacity grows.
#5b) This is a key finding, which hints at my questions earlier about the scalability of the Semi-Scheduled category, the way it currently .
(D3) Tabular Results
The data behind the distribution chart above is presented in the following table, for those more numerically inclined:
(Click on the image for a larger view)
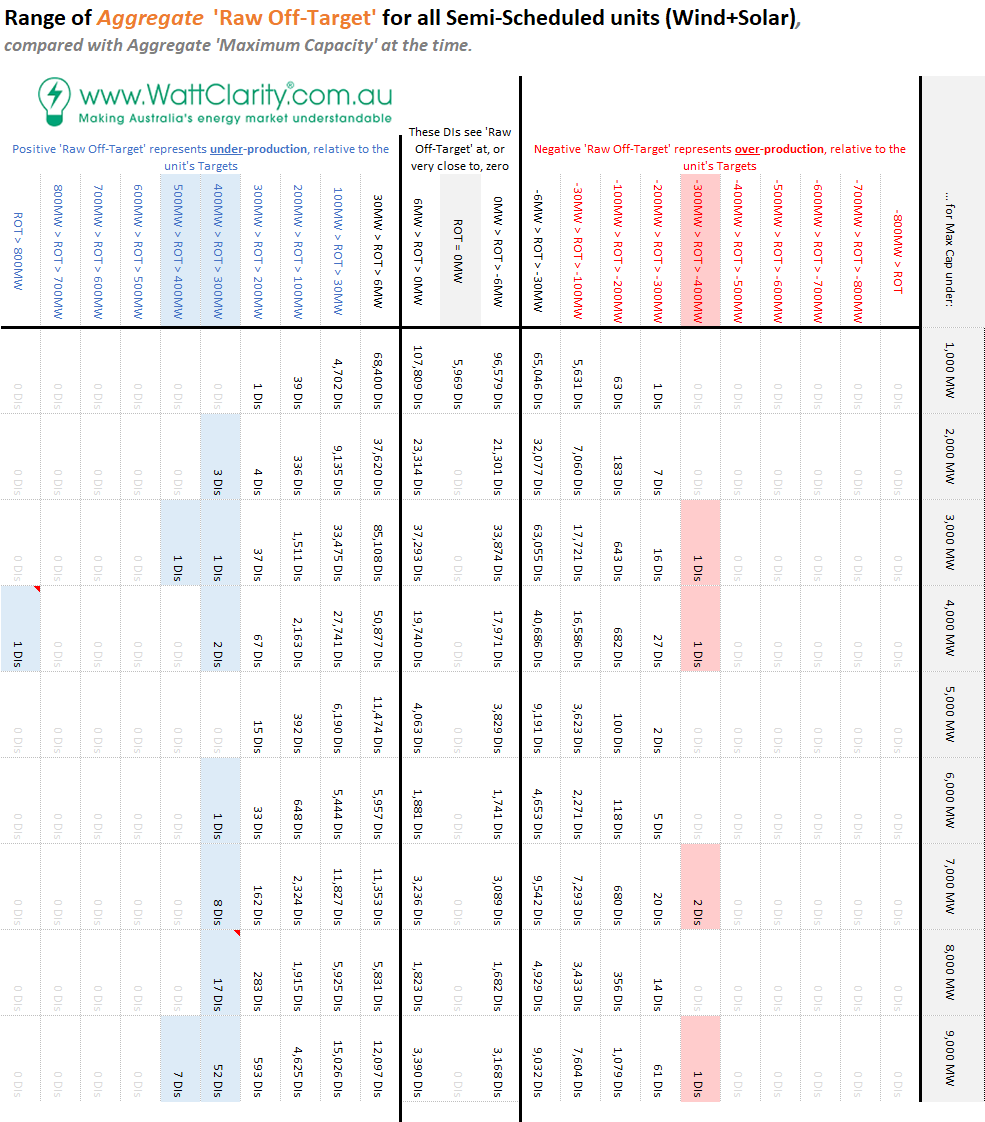
Seeing the numbers is useful in understanding the scale of the challenge – and that it seems to be growing year-on-year, as more Semi-Scheduled capacity is installed. In this related article (LINK TO COME WHEN I GET THE ARTICLE UP!) I’ve delved into more detail of the ‘extreme’ cases.
(E) Relevance to the AER Issues Paper?
To me there is an emerging challenge within a growing number of 5-minute Dispatch Intervals where the aggregate output of units (registered as Semi-Scheduled mode) is significantly away from the expected output for a dispatch interval. Unless something changes, this escalation of ‘extreme’ outcomes seems set to continue growing into the future.
For me, it seems important to delve more into the detail to understand both:
Q1) What the underlying causes of this increased divergence?
As Marcelle already noted in her article, it seems unlikely that most of these instances of under-production are related to responses during periods of negative prices.
Q2) What are the implications of this increased divergence?
2a) It would probably mean the need for procurement of greater volumes of Regulation FCAS, hence presumably higher aggregate cost.
2b) What other implications?
This is what we’ll be seeking to do in articles that follow – probably involving some detailed Case Studies making particular use of the powerful Time-Travel functionality in ez2view to perform forensic analysis of particular Dispatch Intervals we’ve identified.
(F) Do you know of others who can help us?
There are a number of reasons why are keen to engage in thinking like this about topics like this. I’ve previously noted two of them here – but one other reason (I hope it’s obvious) is that we also genuinely want the energy transition to succeed.
It’s a very big step from the challenges we face being solvable (with major effort) … to the challenges being solved.
Too often it seems some others link the two parts of the statement too closely together, and hence (in my view) make it less likely.
Having Marcelle join our team has given us a valued boost in our capability – and we’re also looking forward to having another new team member join in a little over 3 weeks now. We’re interested to hear from you if you know of people who can help us in our efforts?
—————–
PS on Monday 27th July 2020
Late on Monday I was able to post more details of the analysis performed, thus far, with ‘Extrapolating from the trend of ‘Aggregated Raw Off-Target’ results, to yield some clues to what the future might hold … and one challenge for NEM 2.0’ here.


Leave a comment