A quick note about today in QLD as a Case Study we might be coming back to at some point in the future.
The future’s rapidly approaching in this energy transition, and we’re all grappling with keeping up. Here’s a few quick pointers in a brief article today – needs to be revisited later, as time permits:
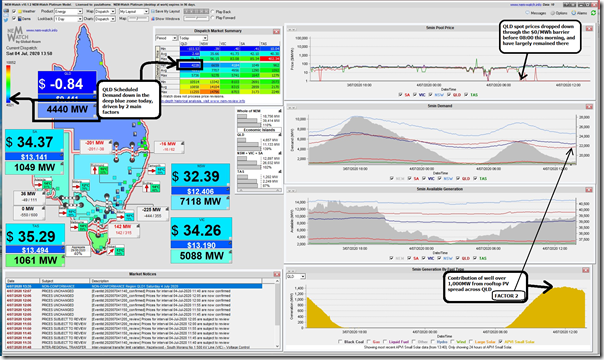
Here’s a snapshot from NEMwatch v10 our popular entry-level dashboard that provides a great overview of the high-level considerations that have converged on today’s action in the QLD region.
Observation #1) I’ve highlighted how prices persisted being down below $0/MW from before 08:00 through for much of the daylight hours (13:50 dispatch interval shown here – but even later, to the time the article was published).
Observation #2) I’ve noted that Scheduled Demand was down in the deep blue zone on NEMwatch, where colour coding extends from deep blue (historical minimum levels) to bright red (historic maximum levels). In the ‘old days’ demand would be at minimum levels in the early stages of the morning period – around 04:00 used to be the lowest. However this low level of demand during the middle of the day has occurred for a number of reasons, including:
Factor 1 = beautiful* winter daytime temperatures across QLD today, meaning not so hot as to require air cooling and not so cold as to require air heating;
* as the QLD branding lingo goes…
Factor 2 = also, in a double-whammy, APVI estimates show easily more than 1,000MW of contribution from rooftop solar PV including my own home power station which is definitely oblivious to the spot prices (and definitely no fog today, unlike Friday morning). This eats away from modest Underlying Demand to make Scheduled Demand even lower (i.e. Underlying Demand above 5,600MW at this time, but Scheduled Demand >20% lower at 4,440MW)
Factor 3+ = these other factors will also have contributed.
Observation #3) The price outcome is ultimately the intersection between Available Supply and Demand, and NEMwatch reminds us (in ‘Available Generation’) that QLD has oodles of spare generation capacity – especially on a day like today, where demand is depressed so much.
————–
Every DUID has its own story, each worthy of its own consideration – this is so much the case that we released our inaugural Generator Statistical Digest 2019 earlier this year to contain two whole pages of stats for every individual DUID that was operational through 2019 (including stats you I’m pretty sure you can’t access anywhere else). We’re aiming to update this every year from now, with each update released in January of the following year – so stay tuned for the Generator Statistical Digest 2020….
However today I’d just like to highlight two in particular from the Queensland Region that jumped out at me:
Case 1) Whitsunday Solar Farm, as an example of bidding challenges (incl when automated)
It was a lively discussion on Thursday at the AER’s discussion forum relating to their Issues Paper on Semi-Scheduled generators.
I will have more thoughts posted in other articles on WattClarity in the coming weeks, but thought I should note that there’s a distinction between two different types of automated processes that are progressively making their way into the NEM:
Automated Process #1 = the AER Issues Paper is concerned with with the use, under certain circumstances (i.e. negative prices, such as we saw lots of today in QLD), of automated dispatch software. In simple terms this is software that will automatically switch off solar and/or wind farm output in response to some external trigger:
1a) This external trigger might be the dispatch target from the AEMO; and/or
1b) This external trigger might be the spot price within the region.
i. It’s this particular trigger (if it is adverse to the dispatch target) which the AER is concerned about.
ii. Note that our company is involved, in partnership with others, in auto-dispatching smaller solar farms which are Non-Scheduled (indeed not even registered with AEMO), so they can switch off on days like these where the prices drop below $0/MWh, or their particular trigger points. These smaller solar farms are also not the focus of the AER’s issue paper – though I can see that challenges in balancing supply and demand are likely to grow if we’re successful in helping a growing number to operate in this way…
Automated Process #2 = the AER Issues Paper is not concerned with the use of automated re-bidding software (so long as it adheres to the AER’s own rebidding guidelines which are quite detailed in terms of what are required, including that rebid reasons be ‘a brief, verifiable and specific reason’).
There are a growing number of various forms of these ‘re-bidders’ in use in the NEM – including for wind and solar assets. It just so happens that (I believe – noting bid data for today is not available till tomorrow) the actions of one of these featured in something I noted happening at Whitsunday Solar Farm.
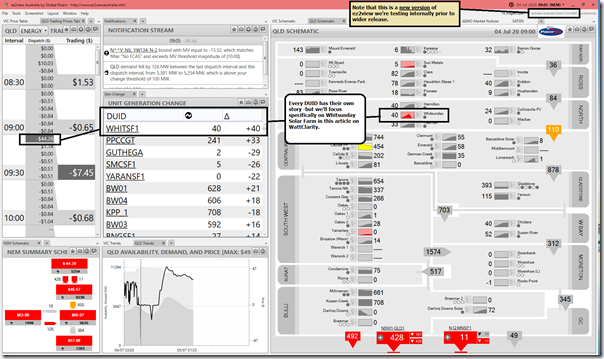
The second image here comes from a new version of ez2view (v7.4.5.664) which our team has put together to address some specific needs – and which we are testing out (hot off the press) before pushing out more broadly to our growing client base. If she has time during the coming week, Marcelle might post more here to illustrate some of the enhancements in this version of the software.
I’ve Time-Travelled the application back to the 09:05 dispatch interval this morning (i.e. so almost 5 hours earlier than the NEMwatch snapshot above) in order that we can more clearly see what was happening at the time (but keep in mind that the ‘next day public’ data sets are not visible at this time – including all the DUID bids for the current day).
Observation #4) In this dispatch interval (first in the 09:30 trading period) we see that the dispatch price drops further from -$0.84/MWh at 09:00 to be –$44.28/MWh at 09:05.
4a) This means that the ‘estimated trading price for the current half-hour’ was –$7.45/MWh
4b) Our analysis in the earlier Generator Report Card 2018 revealed that a number of Semi-Scheduled generators bid to avoid operating when prices are negative – which is understandable (though note that not all of them do, and that the trading strategies also vary over time).
4c) An advantage of the ‘Time-Travel’ functionality baked into ez2view is that the software will show the market as it appeared at the time when you time-travel back to that historic dispatch interval – including the AEMO’s ‘old’ predispatch forecasts which were visible at the time.
Observation #5) Despite the fact that the price dropped from 09:00 to 09:05 we see that the Whitsunday Solar Farm ramped back up by 40MW.
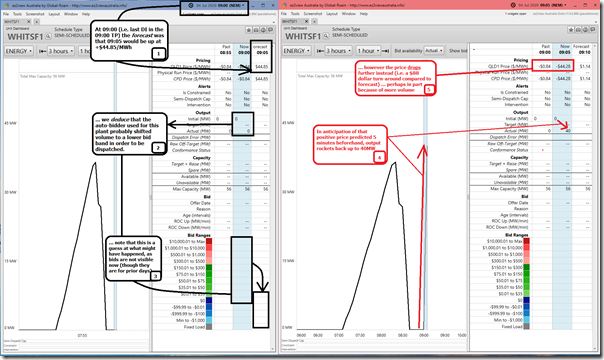
Observation #6) This does not immediately seem to make sense… but thankfully ez2view also makes this easier to understand why – as seen in this collage of the ‘Unit Dashboard’ widget for WHITSF1 at both 09:00 and 09:05 dispatch intervals:
6a) At 09:00 we see the forecast price for 09:05 was that it would be +$44.85/MWh (i.e. well above zero, so presumably indicating a positive revenue outcome for generation).
6b) Yet in the 09:05 dispatch interval, the actual price is instead -$44.28/MWh – which represents a significant turn-around of more than $88/MWh compared to forecast.
6c) This type of cyclic operations around $0/MWh illustrates the growing challenge that many operators will need to grapple with for their assets – whether using automated bidding algorithms or relying on more manual intervention.
I expect the automated bidding algorithms will continue to advance rapidly – thought there are still questions in my mind about what the ultimate end point will be, as we have more and more plant deployed that is ultimately very similar in cost structure, automated tools and approaches… More about this later.
Case 2) Susan River Solar Farm, as an example of Non-Conformance
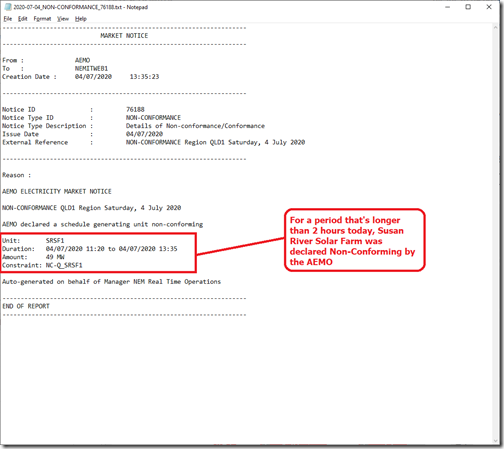
Also worth noting that the Non-Conformance for SRSF1 flagged in the Market Notice window in the NEMwatch snapshot from 13:50 also jumped out at me:
There’s a page in the WattClarity Glossary that explains more about Non-Conformance.
Observation #7) This one pertained to one of the other solar farms in QLD (the Susan River Solar Farm) and suggests something went awry today in their monitoring of AEMO dispatch instructions.
PS on Wed 8th July.
Given I’m adding the note below, should also add in that the sister site at Childers Solar Farm (CHILDSF1) had Non-Conformance issues later that afternoon. Something broader gone awry?
Observation #8) Given the way dispatch targets work for Semi-Scheduled plant, I presume that:
8a) they had bid above $0/MWh; and
8b) as a result of the massive oversupply – hence negative prices – had been dispatched down to 0MW as a result of the negative dispatch periods.
8c) However (something going awry) these targets were not followed:
(i) Production stayed high (i.e. up where it would have been if prices had been positive)
(ii) Hence the eventual Non-Conformance Notice.
For the avoidance of doubt, with respect to the recent AER Issues Paper.
Thanks for the suggestion, by a keen reader of WattClarity, to include a note here to ensure that all other readers are quite clear that:
(i) whilst what happened at SRSF1 was not desirable (in that they exceeded their target for a considerable period of time).
(ii) it’s NOT the particular type of behaviour that the AER notes it is particularly focused on in this Issues Paper (which in that case is being significantly under target when prices are negative, despite what some participants would interpret as their intention to continue generating in their bids).
From my concern I try to start from the principle that the numbers need to add up (i.e. Supply = Demand) and so will have more to say on the AER Issues Paper and broader considerations of the Two-Sided Market when I have a chance. A couple events to prepare for, first!
This is just another reminder of the complex, 24×7 nature that is operating in the National Electricity Market (reminding me of some of the discussions on Thursday 21st May 2020). Today gives us some clues to what the future might hold.


Paul, Welcome to our world. You may do well to have a look at what is happening in Western Australia, a relatively small isolated system now operating with over 1200MW of installed behind the meter PV and no storage. A read of the recently published AEMO Statement of Opportunities (SOO) for WA delves into this in great detail. Now WA you would recall is a capacity / energy market. However we have now reached the point where WAs largest generating unit (350MW) is regularly shut down over weekends simply because it is too big with insufficient turn down to be managed within the residual demand left after Rooftop PV and the ever growing wind capacity (Driven by the tail end bubble of the RET). WA now only has about 1600MW of coal capacity in 7 units and this will shrink by 400 MW over the next 4 years as older units are rendered uneconomic – simply capital reinvestment cannot be justified with their declining capacity factors. But hey, this is what the RET was all about. So fortunately the balance of conventional generation is mainly gas turbines and open cycle at that. And with a capacity market that will fund more there is some chance of keeping the lights on. Apply the same PV / renewables outcome to the energy only market dominated by relatively inflexible coal fired units in the NEM and you are going to have a serious problem. Zero / negative pricing is simply the first symptoms. Worse still, burn the financial viability of the incumbents and expect them to come back and put capital into new (probably GT based) capacity will be an interesting ask, particularly when profit seems to be a dirty word in the electricity industry generally and the expectations of cheaper electricity in the future still seem to abound. I watch with interest. Suffice to say I have a small generator in the shed….because I don’t drink warm beer in the dark for anyone!