The initial / final conundrum
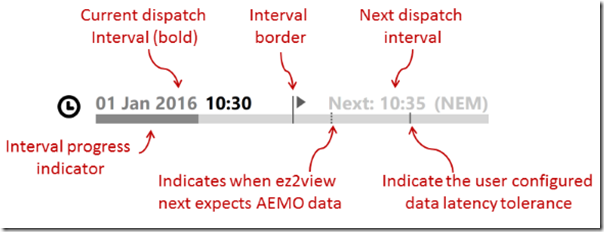
Recently Paul posted about negative price events in QLD on Saturday 4 July 2020 where low demand and lots of sunshine pushed prices below zero for much of the daytime. In this article I’m looking further at this day using Monday’s “bleeding-edge” release of ez2view v7.4.5.665 (licensed clients can download it here), which addresses a long-standing confusion many users found between displayed MW generation quantities at the start and end of a dispatch interval. This was most evident in time-travel mode in the schematic widgets. For the uninitiated, a dispatch (5-minute) or trading (30-minute) interval is referred to by its “ending” time – so 10:10 means the 5-minute period between 10:05 and 10:10, where the 10:10 dispatch instruction is published by AEMO at around 10:05. The 10:30 trading interval is 10:00 to 10:30, including the 10:05 to 10:30 dispatch intervals. Sometimes this is referred to as “HHE” for half-hour-ending. The diagram below shows how ez2view moves through a dispatch interval.
Not all data is available in real-time for each dispatch interval. The total MW dispatched across regions, the target interconnector flows and the dispatch prices are all available, as these are calculated by the dispatch process on a forecast for the end of the 5 minute period, but the actual generation and metered interconnector flows aren’t available – as they haven’t happened yet! The best we can do in ez2view is provide the “initial” value – which is a snapshot of the measured value at the very end of the previous interval.
ez2view also has a “time-travel” mode that takes the data (forecasts included) back to a point in time. There’s more detail on that here. When travelling back in time to dig into what really went on, providing the “initial” value like this for the generation quantity can be confusing, as usually we’d want to know what happened during that interval, with reference to the prices for that interval, not what happened during the one before.
Version v7.4.5.665 of ez2view addresses this by providing the most up-to-date information available. In the Schematics widgets in real-time mode it now displays the “initial” value for generation, and when time-travelled the “final” value, which is the generation snapshot at the end of the interval. The “initial” value is shown in grey to indicate it’s preliminary, while the “final” value is displayed in black. In the tooltips (the detail that pops up when hovering over a data point) the generation data is further labelled with “(start)” or “(end)” to indicate which value it is. This approach then spills over into the Generation-Change widget (listing the most significant movements of generators), and the notifications on generation change, so that these widgets show what changed during the interval.
In addition, we’re making more interconnector information available. Throughout ez2view (and in AEMO’s MMS database), the interconnector target flow (i.e. what the dispatch process would like the interconnector to do) is referred to as “Flow”. However, this often isn’t what actually happened, as generation and demand across the regions can turn out not quite as dispatched. The metered MW data (the actual flow) for interconnectors is now available in ez2view through the tooltips in the schematic widgets. This metered MW data has the same initial / final issue as the generation data, and so is also shown with “(start)” or “(end)” next to it.
As always we’re keen for feedback from users on how this helps you and any other improvements you’d like to see. We’re aware that there’s still more work to do to in this area, particularly in improving the display of interconnector data on the schematics and in the interconnector widgets, and in showing the aggregate demand and generation figures with consistent and meaningful timing alignment across all the widgets including the NEM Map.
Some go up, some go down!
Now, let’s have a look at what happened last Saturday in QLD. I’ve picked the 10:05 dispatch interval here. To recap – this is the period 10:00 to 10:05, and the dispatch instruction is published just after 10:00. This is also the first dispatch interval in the new half-hour (trading interval ending 10:30).
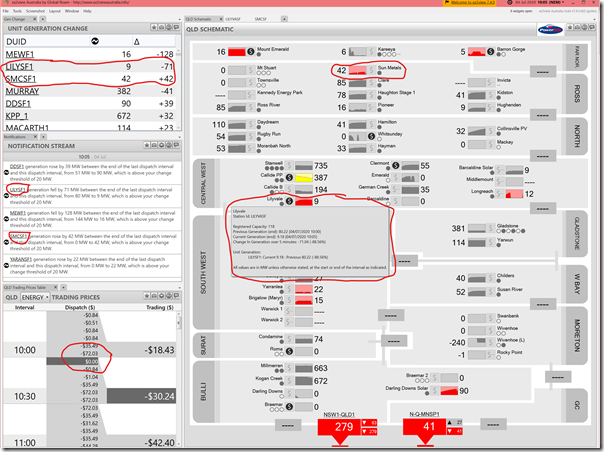
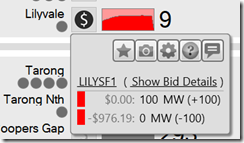
Here’s the result of time-travelling ez2view to the 10:05 dispatch interval. While a number of generators moved during this dispatch interval (as shown in the notification stream widget), I’ve highlighted two solar farms of interest – one that went up (SMCSF1 – Sun Metals), and one that went down (LILYSF1 – Lilyvale). In the tooltip pop-up for LILYSF1 note the generation for the “(end)” of the interval is provided – the new feature in v7.4.5.665.
Note that the dispatch price has changed from –$72.03 (at 10:00) to $0.00 (at 10:05), but the 10:30 trading interval is forecast to end up at –$30.24. In time-travel mode ez2view shows prices as they were forecast – so on the QLD Energy Trading Prices widget in the screenshot below, the 10:05 price of $0.00 is actual, but those below are the forecast as at the 10:05 dispatch run.
Let’s look in more detail at these two solar farms to understand how their bids gave these very different outcomes. I’m using the “Station Details” widget here (also appearing with the same information as the “Unit Dashboard” for individual DUIDs in a station), which we’re continuing to upgrade based on feedback from our clients during the summer of 2019-20.
SMCSF1 – Sun Metals Solar Farm
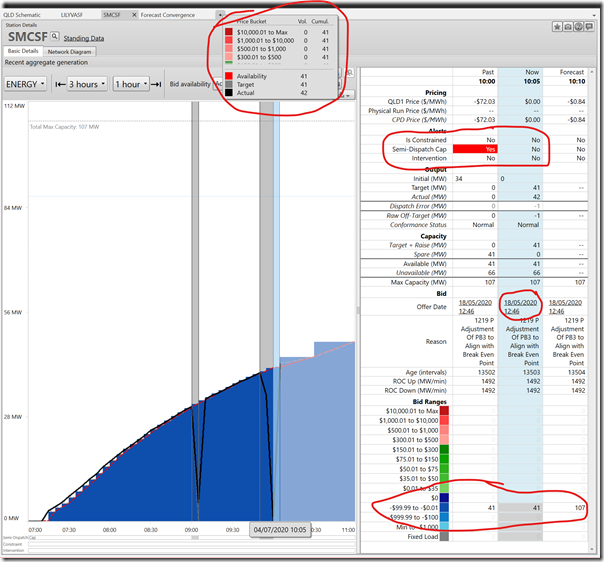
Clicking on the “Sun Metals” name on the schematic brings up the widget below. This shows:
– In the 10:00 dispatch interval, the semi-dispatch cap was on (the red highlighted “Yes”), and the target (shown just below) was 0 MW. The actual generation (at the end of that interval) was 0 MW.
– In the 10:05 dispatch interval, the semi-dispatch cap was off and the target was 41 MW. The actual generation was 42 MW, as was also shown on the schematic.
– Looking at the bids, the bid that applied to this interval was made at 12:46 on May 18, and was in the range –$99.99 to –$0.01.
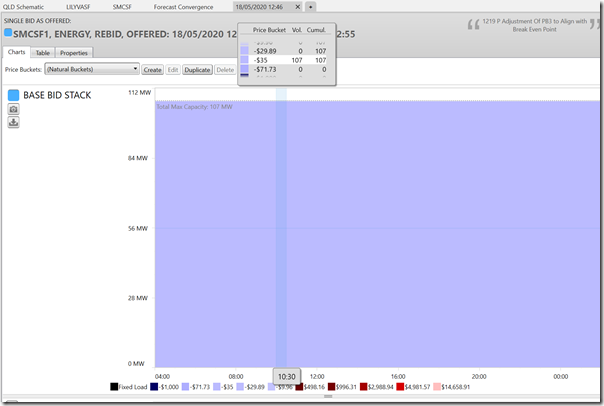
So why was SMCSF1 dispatched to 0 MW in the 10:00 interval but 41 MW in the 10:05? Looking further at the bids will explain – by clicking through on the time-stamp of the bid in the SMCSF widget:
The widget display above isn’t all that interesting in this case as the bids don’t change, but it does let us look in detail at the contents of the bid. This detailed look reveals that solar farm’s capacity is bid at –$35/MWh across the day. So, for the 10:00 dispatch interval (price –$72.03) it was dispatched off, and for the 10:05 dispatch interval (price $0.00) is was dispatched on.
LILYSF1 – Lilyvale Solar Farm
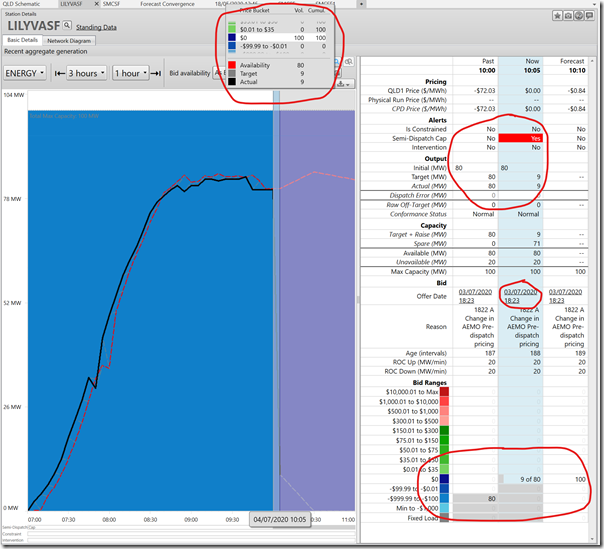
In contrast, Lilyvale Solar Farm was dispatched off in the 10:05 interval. What caused this different behaviour? The first hint is in the $ sign in the schematic next to the Lilyvale name. This shows not that there was a rebid made during that interval, but that bid capacity moved in that interval compared to the previous.
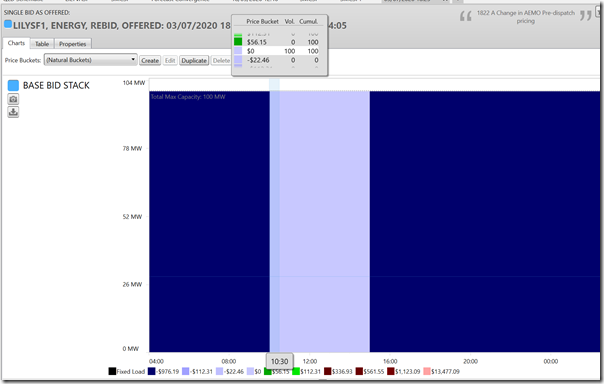
Clicking through to the Station Details widget and then to the bids shows that Lilyvale had put all its capacity in the $0.00 band for the middle of the day from the 10:30 trading interval, compared to the very low price bid for the 10:00 interval and others. The outcome is that Lilyvale was dispatched off for the 10:05 dispatch interval.
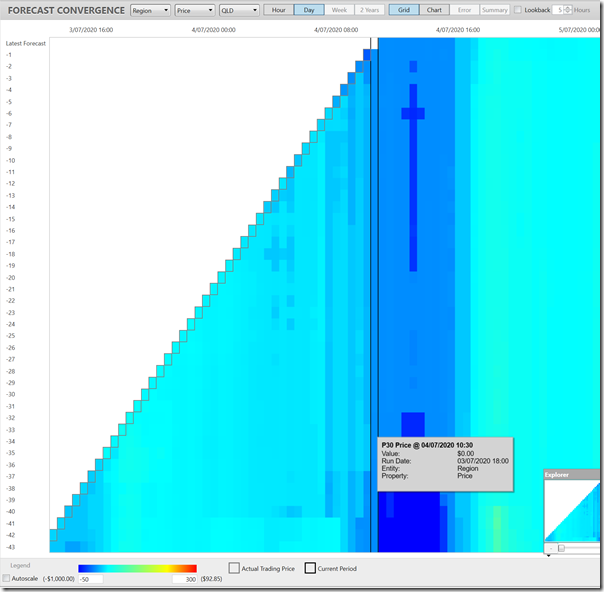
A further question arises here – what happened at 18:22 the day before to prompt the rebid? The forecast convergence tool is helpful here, given that the rebid reason refers to AEMO pre-dispatch forecasts.
We can see from this that at 18:00 the day before the forecast price for the 10:30 interval (and many after it) was at $0.00.
More detailed analysis on negative price response
There’s growing interest in how each solar farm responds to negative prices. This was assessed for every solar farm that existed in 2018 in the GRC2018, and then detailed stats provided in the GSD2019 – with some insights shared:
By Allan – https://wattclarity.com.au/articles/2020/01/gsd2019-allan-howgoodissolarfarming/
By Ben – https://wattclarity.com.au/articles/2020/01/gsd2019-benwillacy-lessonsfrom2019/
What about the interconnectors?
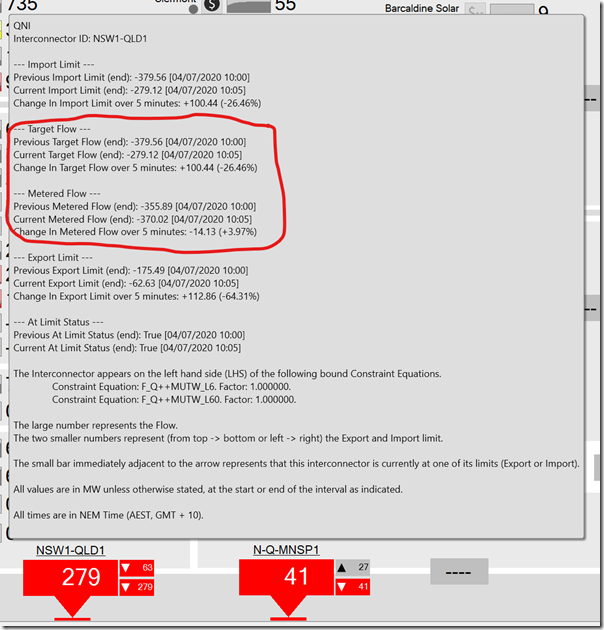
Sometimes the interconnectors don’t end up carrying exactly the flow that was expected. I won’t look into why this happened in this case, but will show the new data now available in ez2view v7.4.5.665, which shows here that the metered flow (i.e. what actually happened) on QNI at the end of the 10:05 interval was –370 MW, compared to the –279 MW target flow.
The team is growing!
Frequent readers might recall that I’m a recent addition to the Global-Roam team. I’ve enjoyed recently getting stuck into the detail of the ez2view code to improve this particular aspect of ez2view.
I’m looking forward to the next addition to Global-Roam’s Melbourne contingent (starting in 6 weeks’ time), especially as it’s someone I’ve enjoyed working with before. We’re still on the lookout for others who’d fit into the team – let us know if this is you or someone you know.
ez2view continues to evolve
The small upgrade described here, accessible in v7.4.5.665, is part of the larger move of ez2view to version 8. Current clients will have received a lengthy email from Paul on Wednesday June 24th (contact us if you can’t find it) outlining current features and the improvements planned for v8. Clients may also have recently noticed some changes to the Trends Engine online, which is part of the v8 upgrade. We’re upgrading many of the help files online in the move to v8 – so please contact us if you have specific requests for better help file information.


Leave a comment