Yesterday (Friday 17th) I spoke alongside Judith Landsberg* from the BOM in a session organised by the Australian Institute of Energy titled ‘Energy Technology – performing under (heat) stress’.
* Judith is also the Project Coordinator of the Energy-Sector Climate information (ESCI) project, which is a project very directly related to the topic. The ESCI Project was borne out of the Finkel Review and is discussed in a variety of places such as:
1) Here on the Government’s website … at least currently
2) Here on the AEMO website.
(A) Headlines of what happened through summer 2019-20
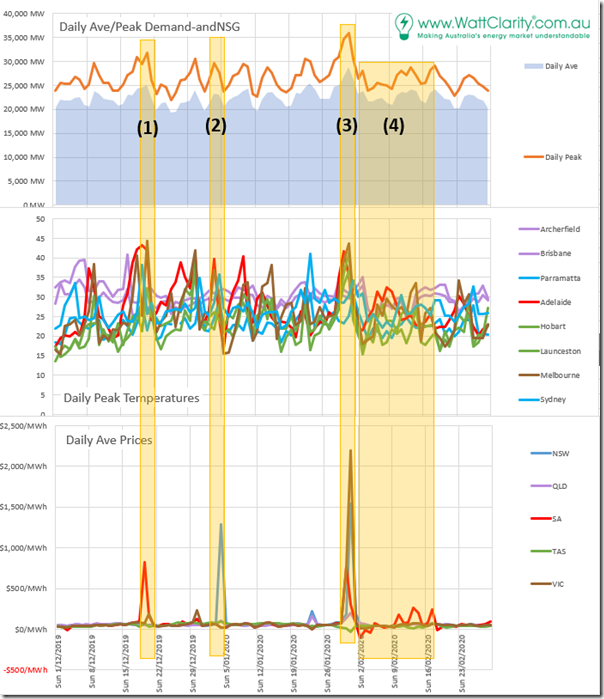
To set the scene for a discussion of the technology limitations, I used the following image to picture some of the results that were seen through summer 2019-20, and in particular four key headline events:
For those on the call, I promised to make this available for future reference, so here it is. In particular, I highlighted what I see are the four headline events that combined to make summer 2019-20 a very stressful one … one with a great many lessons to be learnt.
|
1st Headline event |
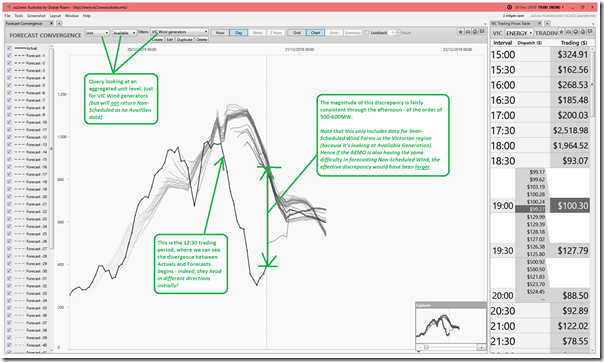
On Thursday 19th December we see from the chart above that the daily time-weighted average spot price in South Australia reached a massive $822.85/MWh. In this article the next day, I pieced together some of what had happened in this ‘Not-So-Quick review of price spike in South Australian region yesterday (Thu 19th Dec) evening’ article. Extremes in temperature were a major factor, with Adelaide peaking at 43.2 °C during the day (on the same day Sydney temperature also peaked at 38.1 °C). On Friday 20th December the hot blast made its way through Victoria, leading to some quite scary moments in terms of balancing supply and demand (the official term is ‘Security of Supply’). The following day I had pieced together ‘What happened yesterday (Fri 20th Dec 2019) in the Victorian Region? A first look…’ as a starting point for understanding. One of the startling propositions that day was how a large volume of forecast wind output across Victoria simply disappeared in the heat, as I showed in this image from ‘Forecast Convergence’ in ez2view: On this day, Adelaide peaking at 41.9 °C during the day (whilst Melbourne hit 44.3 °C). It was following from the shock of this event (on Monday 23rd December) that I was stunned to see Market Notice 72015 published, as a direct attempt by AEMO to remind some operators of Semi-Scheduled generators to inform AEMO of the high-temperature limitations of their (Wind and Large Solar) plant. Three months later we were pleased to have Marcelle Gannon joined our team. In her first article on 3rd April, Marcelle shared some suggestions for how to improve forecasts for semi-scheduled plant, including in relation to submission of these high-temperature limitations. |
|
2nd Headline event |
At 15:10 (NEM time) on Saturday 4th January 2020 the Victoria and New South Wales regions separated at Murray and Lower Tumut Substation as a result of the bushfires raging through the south-east of Australia (and, in particular, under some key transmission lines connecting NSW to Victoria). This led to islanding of the mainland NEM into two different frequency zones. This event we discussed through a number of successive articles on WattClarity®: 1st article on Saturday afternoon I noted ‘Bushfires under interconnectors through Snowy Mountains cause separation of NSW from VIC region’; 2nd article later on Saturday where I noted ‘More details on the bushfire-driven extremes in the NSW Region of the NEM on Saturday 4th January’; 3rd article on Thursday 9th January written by Allan O’Neil where he discussed ‘Operating under siege’. |
|
3rd Headline event |
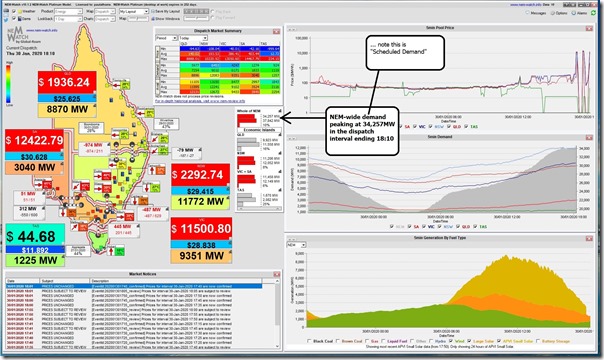
If Friday did not happen, then Thursday 30th January 2020 would have been remarkable in itself: 1) Late on Thursday I wrote about how ‘Thursday 30th January 2020 sees demand reach 34,257MW and LOR2 notice issued for both VIC and SA’ – as captured here in NEMwatch v10 at 18:10 on the day: 2) Our excellent guest author, Allan O’Neil followed up on Friday with ‘A further look at Thursday Jan 30th’. ——— However Friday 31st January proved to be significantly worse, in so many different ways… 1) On the Wednesday evening beforehand (29th January) I had sent a tweet warning that the NEM-wide demand might exceed 34,000MW, which we updated in this article on Thursday 30th Jan. 2) Published midday Friday, we warned ‘Buckle in folks, Friday afternoon/evening might be a bit bumpy’. 3) Well, ‘a bit bumpy’ turned out to be the understatement of the day, with it turning into ‘White knuckle ride across the NEM on Friday 31st January 2020 (extreme NEM-wide demand)’ 4) Indeed, I subsequently noted here that the NEM probably saw the highest ever level of ‘Underlying Consumption’ of electricity on 31st January 2020. ——— Oh, and on top off this ‘white knuckle ride’, a major wind event destroyed the main interconnection into South Australia. |
|
4th Headline event |
As noted above, Friday was a bad day in so many different ways … but the damage to the Heywood interconnector created a separate headline event in and of itself… 1) I wrote about ‘13 headline questions and observations…’ here, but would particularly like to highlight how this thrust South Australia to be an ‘accelerated accidental experiment’ as a result of the Heywood outage. 2) We explored ‘What happened to System Frequency…?’, … 3) … and wondered just how close to a knives edge was the South Australian region from going fully black again (not 4 years after the SA System Black in September 2016). 4) Thankfully, it was beneficial that rooftop solar PV systems did trip in South Australia, but not in Victoria. 5) In the weeks that followed immediately we The lessons are still occurring, but we have heard of many different types of participants being burnt by extreme FCAS costs (including, for instance, Energy Users pushed to provide FCAS services via Demand Response unbeknownst that they would come out worse off as a result!) 6) Other relevant articles are all grouped here under this Category. 7) However what’s perhaps not made explicit enough is very evident in the chart at the above was that South Australia really ‘dodged a bullet’ by luck We see in the chart above the miraculous coincidence that temperatures dropped immediately after those storms … That’s not to disparage the great efforts of many who worked in various organisations to help us all pull through. … but to just pat ourselves on the back and move on without really learning the lessons of this time would seem to be a huge opportunity wasted. ——— Note, for those who have not been following closely, that this is still not entirely repaired, with the organisations involved pushing to be fully back online prior to summer 2020-21. Hence there might still be a few bumps in this journey to come … again in part due to the weather. . |
As noted in a number of the articles linked above, what happened through summer 2019-20 reminded us a number of times of what we wrote in the Generator Report Card 2018:
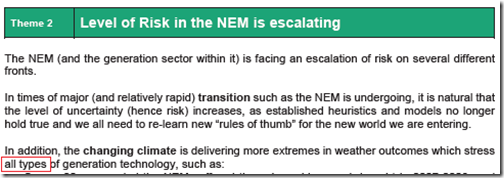
In Theme 2 within Part 2 of the 180-page analytical component we wrote how ‘the Level of Risk in the NEM is escalating’. Just one particular aspect of increasing risk is in relation to the many different dimensions through which “weather” affects our electricity supply and consumption processes:
We explored that in Theme 6 within Part 2 of the GRC2018, and summer 2019-20 provided us a number of reminders (extreme temperatures driving demand and generation limitations, bushfires threatening a variety of key infrastructure, wild wind storms downing transmission and so on…).
(B) Preparing for summer 2020-21
We’ve learnt many things through summer 2019-20 that we are busy applying to upgrades to our software (particular the ez2view high-end market dashboard). Some of this will be ready for summer 2020-21, and we’ll look forward to sharing some of that with WattClarity readers as the coming summer unfolds….
(C) Do you know of others who can help us?
As noted before, there’s two big reasons why we engage in forensic analysis like what we’re doing with respect to this event (including utilising external resources and data sources wherever we can).
1) I’ve noted above how we have been very happy to have Marcelle join our team back in March, and we have another industry expert joining our team in another 4 weeks or so;
2) We continue to be on the lookout of others who can help us to continue to improve.
Do you know of people who can help us?
(D) A reminder that temperature extremes impact on the vast majority of generation technology
Drawing on the number crunching we’d already performed in conjunction with Jonathon Dyson (and his team at Greenview Strategic Consulting) for the Generator Report Card 2018 and the follow-on Generator Statistical Digest 2019 I walked through a number of the different generation technology types to draw attention to the
Readers of WattClarity here are reminded of what was previously published on 11th February 2020 in the article:
‘Extreme temperature effects on generation supply technology’.
We’ll look forward to taking this exploration further in the next editions of both:
1) the Generator Statistical Digest 2020 (which we will release in January 2021); and
2) the Generator Report Card 2020 (which we are looking to complete and release early in Q2 2021).


Leave a comment