With the Sydney Test having reached its down-to-the-wire conclusion yesterday, it’s a fitting time to reflect that we’re now in the period where demand traditionally starts ramping back upwards as businesses shake off the summer slumber and then schools return.
This summer 2021-22 (significantly affected by La Nina to this point) has seen nowhere near the level of drama that unfolded in summer 2019-20 (which was very El Nino affected, in comparison – driving many outcomes, including these Four Headline Challenges). That does not mean that the pricing has been totally flat, however….
(A) Price volatility in South Australia on Monday 10th January 2022
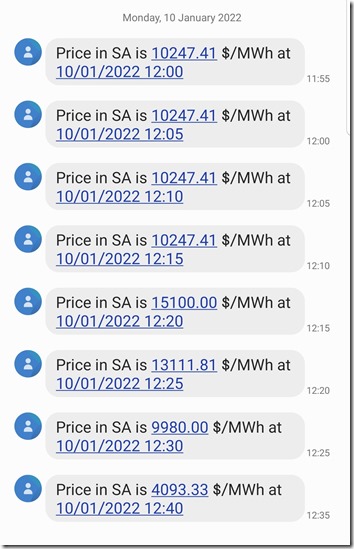
Through the middle of today, for instance, my phone buzzed a number of times with this run of price volatility in South Australia at midday:
(SMS alerts can be configured by our clients in a number of our products – ez2view, deSide® and NEMwatch)
We’ll firstly do a quick review of what we can see … remembering that this is within the current day, so ‘Next Day Public’ data is not visible currently.
(A1) What is visible, at a high level?
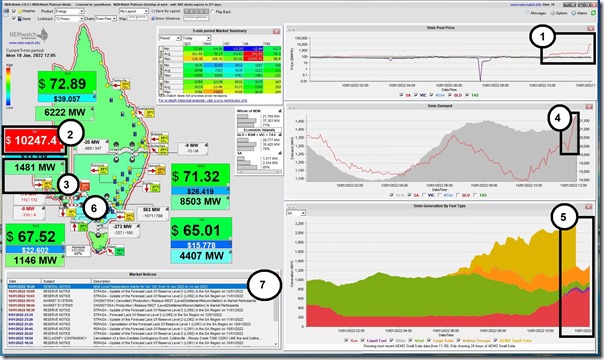
Here’s the second of the 5-minute intervals in which the price was up at $10,247.41/MWh – the 12:05 dispatch/trading interval (NEM time) captured in the NEMwatch dashboard:
With respect to the annotations on the image, a few quick points:
1) We see the prices had separated in South Australia from the other regions as early as 10:20 this morning…
2) … before spiking well into the ‘red zone’ from 12:00.
3) The temperature in Adelaide was only a relatively moderate 31 degC and demand only in the ‘green zone’ …
4) … but (as discussed in some detail through GenInsights21 – particularly in Appendix 15) it’s the ramp rate that often matters more.
5) This ramp in ‘Market Demand’ coincided with the decline of contribution from wind farms across South Australia, and we see liquid-fuelled peakers running for a period of time prior to the major spike at 12:00.
6) Once again, interconnector limits are playing a significant role.
7) We’ll come back to note (7) below…
.
(A2) Another ‘Tipping Point’ illustration
On some occasions price spikes (appear to) occur completely ‘out of the blue’ … such as what happen on 29th December 2021 as a result of unforecast cloud cover.
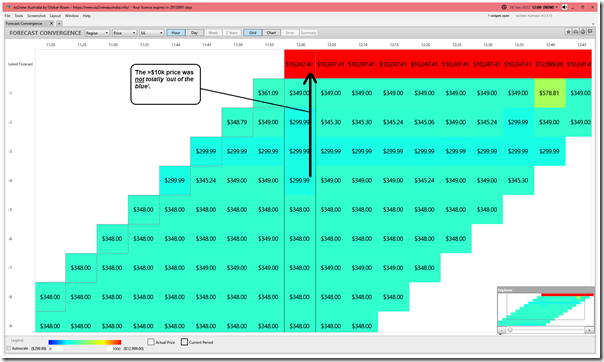
Today’s example is not so clear-cut, as prices had already been elevated for some time, as shown in the ‘Forecast Convergence’ widget inside of ez2view Time-Travelled back to 12:00 today:
(remember to look up a vertical to see how AEMO’s forecasts progressively converged on the actual price).
In David Leitch’s review of GenInsights21 on 23rd December, he complimented the authors on the inclusion of the long-range, aggregate-level summary of bidding behaviour over the history of the NEM. It’s explored in some detail in GenInsights21 itself (look for ‘percentage in green’), but a key point that can be gleaned from these trends is how the NEM is increasingly operating at a tipping point, because of:
1) The nature of technology being deployed in comparison with what’s retiring; and
2) At what price, and at what times, the new (and old) capacity is being offered into the market.
Hence it should be less-and-less-of-a-surprise when the price jumps from $361/MWh to well above $10,000/MWh. The roller-coaster ride is ramping up!
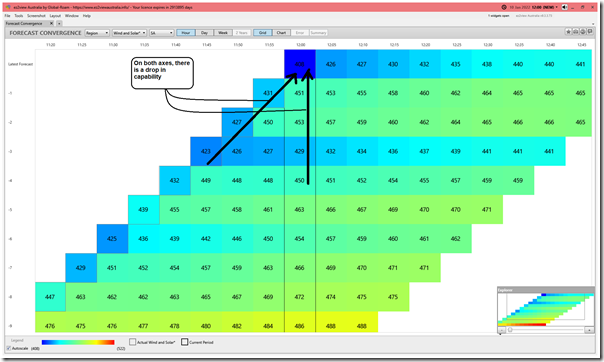
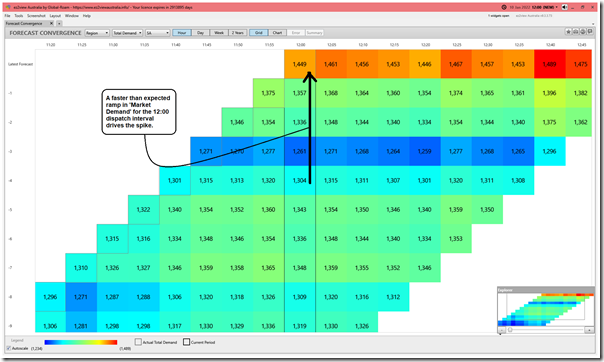
We flip the ‘Forecast Convergence’ widget to look at the aggregate level of Unconstrained Intermittent Generation Forecast (UIGF) to see how AEMO continued to update expectations for production from Wind and Solar and we see this dropping faster than expected, and hence contributing to the price blast-off:
This drop in capability from (larger scale) Wind and Solar was coupled with a faster-than-expected ramp in ‘Market Demand’ (which may have been because of a drop in rooftop PV, for instance)
For those who want to understand this phenomenon more (as it’s going to be increasingly important into the future) we strongly recommend you read Appendix 15 and then Appendix 16 inside of GenInsights21!
(B) Warnings for Monday 10th (today), Tuesday 11th and Wednesday 12th January
Noted at number 7 on the NEMwatch snapshot above was the high-temperature warning AEMO published as a Market Notice at 10:20 this morning – it says:
——————————————————————-
MARKET NOTICE
——————————————————————-
From : AEMO
To : NEMITWEB1
Creation Date : 10/01/2022 10:20:35
——————————————————————-
Notice ID : 93749
Notice Type ID : GENERAL NOTICE
Notice Type Description : Subjects not covered in specific notices
Issue Date : 10/01/2022
External Reference : NEM Local Temperature Alerts for SA, VIC from 10 Jan 2022 to 14 Jan 2022
——————————————————————-
Reason :
AEMO ELECTRICITY MARKET NOTICE
AEMO’s weather service provider has issued forecast temperatures equal to or greater than the NEM Local Temperature Alert Levels for listed weather stations below.
SA
Adelaide West Terrace (39+ Deg C): 11th Jan
Port Augusta Ap (39+ Deg C): 10th Jan, 11th Jan, 12th Jan
VIC
Mildura Ap (39+ Deg C): 10th Jan, 11th Jan, 12th Jan
The NEM Local Temperature Alert Levels are:
Launceston Ti Tree Bend: 33 Deg C, Dalby Airport: 37 Deg C, for all other selected weather stations: 39 Deg C.
AEMO requests Market Participants to:
1. review the weather forecast in the local area where their generating units / MNSP converter stations are located and,
2. if required, update the available capacity in their dispatch offers or availability submissions consistent with the forecast temperatures.
Further information is available at:
AEMO Operations Planning
——————————————————————-
END OF REPORT
——————————————————————-
Remembering that all technology types are affected by extremes in temperature, we’ll have to watch this unfold.


Be the first to comment on "Midday price volatility in South Australia on Monday 10th January 2022"