AEMO forecasted that this might happen days ago (as noted here on Monday this week), so we’ve been keeping some of our dashboard screens focused on Queensland today whilst focusing our main attention on the KPI formulation, number crunching and analysis required to provide for the completion of our Generator Report Card 2018.
——————
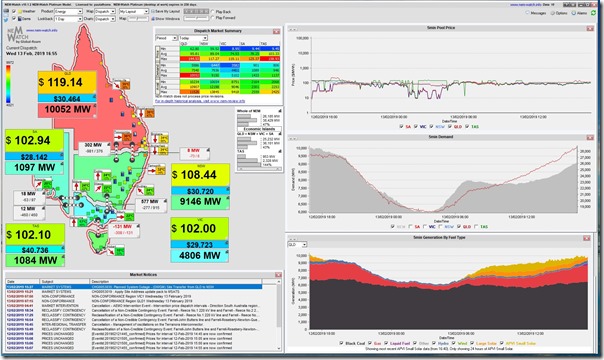
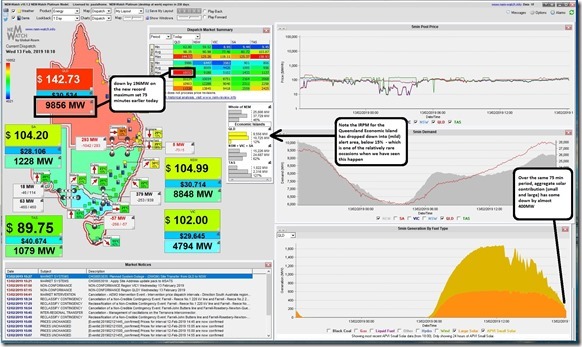
Queenslanders did not disappoint, turning up their air-conditioners late in the afternoon in parallel with the ramp-down of solar PV injections to push demand past the prior peak (which was 9,924MW on a dispatch target basis for Scheduled Demand almost exactly a year ago), up past the 10,000MW mark to land at a new all-time maximum demand level of 10,052MW in the 16:55 dispatch interval – which was captured here in this snapshot from NEMwatch v10:
Here’s a few quick notes this evening that might be of interest:
(A) The different measures of electricity demand
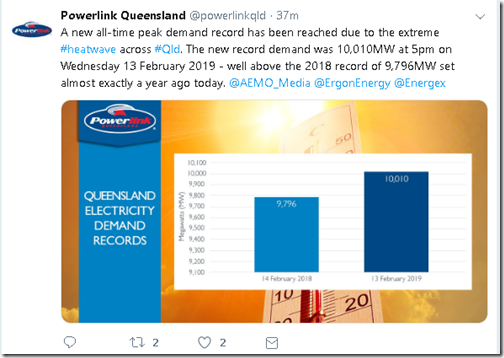
I could not help but notice that both AEMO and Powerlink were on social media, also noting about the new record in peak demand for the Queensland region. What I particularly noted was that the specific numbers quoted (and times) were a little different:
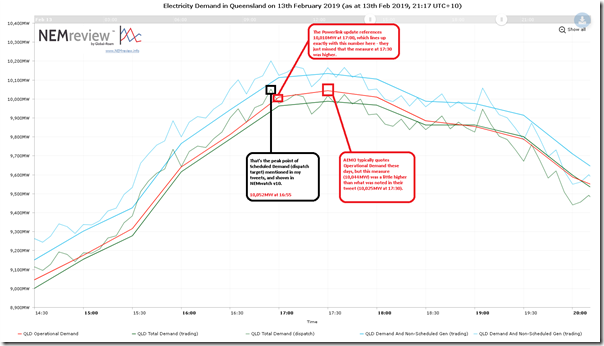
On top of that was what I posted via Twitter and LinkedIn – plus presumably others as well. Also different!
Welcome to the world of electricity sector metrics… It’s a dream sector for the numerically-inclined engineers and economists (we’ll be counting further tomorrow, but I think we’re now well over 60 discrete metrics we’re slicing and dicing for our our Generator Report Card 2018, for instance).
A concept as seemingly simple as electricity demand has given birth to numerous different Demand metrics (as explained in some detail here), each useful in their own way but none of them perfect. Taking a look at a number of them together through our NEMreview v7 online data query tool, we see the following review of today.
No matter which way you cut these numbers, a new record in peak demand for Queensland.
(B) How did AEMO’s forecasts for the demand peak converge on reality?
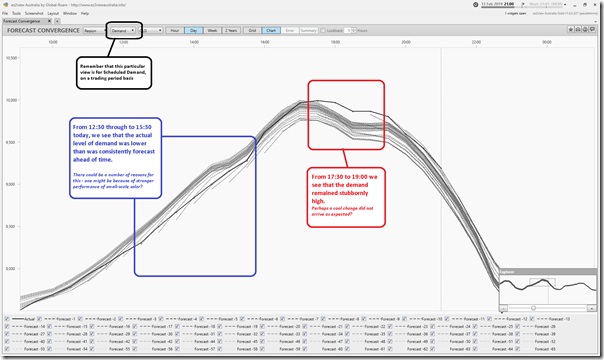
In my note on Monday this week, I included a snapshot of the “Forecast Convergence” widget within ez2view focused on AEMO’s forecasts for Scheduled Demand in Queensland for this evening (i.e. TOTAL DEMAND, in the NEMreview chart above). At the time these forecasts were in the ST PASA time horizon.
Here’s an updated view from this evening, focusing on the nearer-term (P30 predispatch) forecasts for the same metric, and a tracking of how the Scheduled Demand actually proceeded on a trading period (i.e. half-hourly) basis:
I’ve annotated a couple parts of the charts to highlight the type of complexity that the AEMO forecasting team have to grapple with day-in-day-out (with it just being noticed a bit more externally, perhaps, on key note days like today?)
These challenges look set to grow more complex in future…
(C) How did solar contribute?
As noted in my post on Monday, there’s plenty of interest in how solar PV injections will have contributed to managing the supply/demand balance in the Queensland region today:
Interest Area #1) Some people will be particularly interested from the point of view of the emissions reduction component.
Interest Area #2) Others will be more financially invested in the revenue earned (or costs defrayed) from their own solar PV injections
Interest Area #3) Still others will be interested from the perspective of what they might learn today (where solar is still a relatively small share of the energy mix) that might be carried forward in insights that can be applied to understand what might be the case in 5-10 years time as the transition has progressed when the contribution rate is much higher, and grid (and market) will need to be sustainably managing these injections.
Each is valid, and important – though it’s also important to understand that each person’s interests will be slightly different.
(C1) My solar at home
I’ve previously posted these initial thoughts about our own personal experiences as a (admittedly smaller scale) solar powered generator at home. I continue to have a keen interest in what’s going on in that space as well and am grateful for the visibility provided by Solar Analytics in conjunction with WattWatchers.
Accessing my account this afternoon, I am pleased to see a fairly smooth curve of solar harvest through the day, meaning good revenue generation at my very generous net FIT (44c/kWh from the government plus the retailer add-on):
However I am also concerned about what seems to be a lost revenue opportunity in the day, as annotated on the chart. My system is a 5kW system, but the peak output (on a very sunny summer’s day) was down at 3.77kW down at 12:15 today.
In the larger-scale generator space, we’re working through the levels of de-rating seen for large-scale solar farms (and also wind, gas, coal, hydro and other) that are resulting from high temperatures seen as summers get warmer – all to be discussed in our Generator Report Card 2018.
At the much smaller scale (though also much more directly related to us) I wonder about the reasons for our own generator de-rating at home. I speculate whether it might be because of some combination of the following:
Factor #1 – voltage on the local network on our street, and some form of limitation on output imposed by the inverter (i.e. following on from these other thoughts about local voltage in the street where I live);
Factor #2 – some form of temperature limitation on the panels (it would be pretty hot on our roof currently) that is limiting production capability; and/or
Factor #3 – a degradation in capability due to age of the asset.
Factor #4 – my panels need a clean (i.e. other than just assuming that rain will do the job).
Factor #5 – not ideal incidence of the sun in the sky – but it is still summer, and my panels face north on a relatively flat roof with no shading issues?
Factor #6 – something I’m not aware of in the list above.
If any of our more learned readers can help me out in that respect, I would be very interested! Please either:
1) Leave a comment below, if you want them to be public; or
2) Just with us, via this feedback form; or
3) Give me a call on +61 7 3368 4064.
Many thanks, in advance!
(C2) Solar on the grid
Here’s a snapshot from 18:10 today showing that Queensland Scheduled Demand had moderated by almost exactly 200MW over the 75 minutes since the new record had been set:
Also highlighted (bottom-right) was how injections from solar PV (small-scale and large-scale) had dropped by about 400MW over the same period. We see, at a more macro level, how they peaked at over 1,600MW** during the middle hours of the day, with a few perturbations seen in the afternoon as a result of cloud cover.
** Caution should be used in taking this number for aggregate solar and combining it with the demand figures above to try to derive % of demand supplied by solar, as it’s not an apples-to-apples comparison – because of some of the solar being unseen by AEMO in real time (hence netting off demand) whilst some is seen by AEMO and nets off demand.
Finally, I’ve noted on the NEMwatch snapshot how the IRPM** for the QLD Economic Island is down at 12%, which is a relatively low level – hence the colour alert.
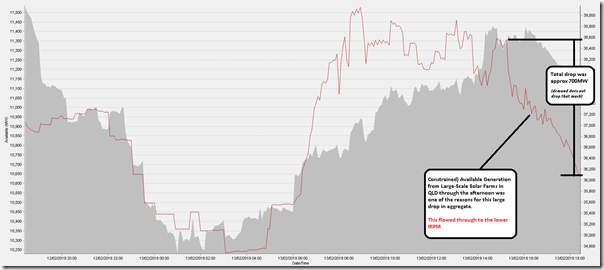
** IRPM = Instantaneous Reserve Plant Margin, is the excess of available supply over demand. It’s a very useful non-price indicator of the balance between supply and demand and provides good correlation with elevated prices (when IRPM drops below 15%). The fact that the price was only $142.73 and the number of competing generators in the region had reduced sharply with the fading out of large-scale solar is an indicator that the government-mandated pricing constraints on their (soon to be reshuffled again) GOCs is still alive and well.
One of the reasons that IRPM has dropped down so much at this time was because of the fading out of solar, which had a large bearing on the decline in (Energy-Constrained) Available Generation capacity for the region, shown in this NEMwatch chart at the time:
No time for more analysis at this point, and back to the Generator Report Card tomorrow – but will watch & listen for your thoughts and comments with some keen interest.




Good info. Could any updates please include a quick look at:
– interconnector activity, including any generation change in NSW that would have affected QLD loads
– coal and gas performance during elevated temperatures i.e. any derating occurring
– which gas peakers stepped in and any abnormal activity there i.e. fail to start
The system seemed to work well and coped with both high ambient temperature and high demand, with technical and economic components operating as required.
To answer your question at C1, the loss could easily be due to temperature derating. If the effective cell temperature of the solar panel is 60ºC the derating factor could be around 0.82 so your 5kW output is derated to 4.1kW On really hot days the cell temperature could even be up to 70ºC which would derate even further.
Does all this mean that Queensland,particularly South East Queensland, should switch to daylight saving in the summer,thereby shifting the demand an hour earlier and make more use of the solar generation?