With the temperature climbing well past comfortable levels outside in Brisbane today, we’re hunkered down in the cool with multiple dashboards up to track whether Queensland will hit a new all-time record level for electricity demand later today.
| Editor’s Note Queensland did reach an all-time record demand on this day, as noted here. |
——————-
However our main focus is the ongoing number crunching and analysis leading into the completion of our Generator Report Card 2018 in another month or two. Thanks for the continually growing number of pre-orders, by the way.
Today we’ve been delving into one part of the analysis of bidding (and in particular rebidding) we’re conducting as part of this analysis. Whilst stressing that what follows is very preliminary analysis that needs to be checked thoroughly before inclusion in the Generator Report Card, I thought readers might be interested in the following two trends:
(A) Number of Rebids for Wind Farms has started to climb
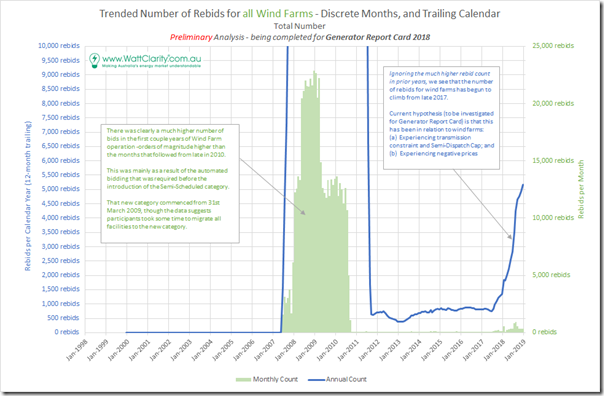
In the chart below I have trended the number of discrete rebids counted each month for all wind farms across the NEM:
There’s obviously a discontinuity between the bids in the period 2007-2010 and the period from mid 2010 through until now. We believe (though this is to be double-checked) that this is all due to the way in which the wind farms used to deploy automated bidding systems back when they were required to register as (fully) Scheduled, prior to the creation of the Semi-Scheduled category (i.e. at which point NEMMCO, and now AEMO, assumed responsibility for some aspects of the generator’s bidding processes for those in the Semi-Scheduled category).
Leaving that aside for the moment, I’d like to also flag the increase in the number of bids seen in the latter months of 2017 and into 2018. This is shown in the blue trend, which is a 12-month trailing aggregate.
Our hypothesis (though this will be confirmed for inclusion in the report) is that this primarily relates to wind farmer’s reactions against either or both:
1) Being constrained down (or sometimes up) through particular constraint equations applied in conjunction with the Semi-Dispatch Cap; and/or
2) Reactions against negative pricing events.
Because these are both (at this point) most prevalent in South Australia (particularly with the System Strength constraint), and as many of the wind farms are in South Australia, we expect a high concentration there – however we will know further as we work through the analysis for every individual power station as part of the compilation of our Generator Report Card 2018.
Here’s one example we delved into a few months ago about how one particular Wind Farmer in South Australia reacted to both (unexpected negative prices, and the impositions of constraints – in that case asking them to wind up output). The rebidding process appeared totally understandable, though we would not recommend what appeared to be the controlled tripping of output immediately prior to the rebid.
(B) Percentage of bids “Not Well Formed” is quite high – using a strict interpretation.
In February 2017 the AER published this revised version of the “Rebidding and Technical Parameters Guideline” to replace the previous (December 2009) version. This became effective 28th February 2017 and re-iterated a required form of rebid that was of the form:
HHMM {space} Category {space} DDD…D
Where:
HHMM is the time, in 24-hour format, of the event(s) or other occurrence(s) adduced by the relevant participant as the reason for the rebid occurred.
Category is either P for a plant or physical change, A for a AEMO forecast or dispatch change, F for a financial or commercial change or E for a rebid to address an error.
DDD…D is a verifiable description of the events or occurrences that explain the rebid.
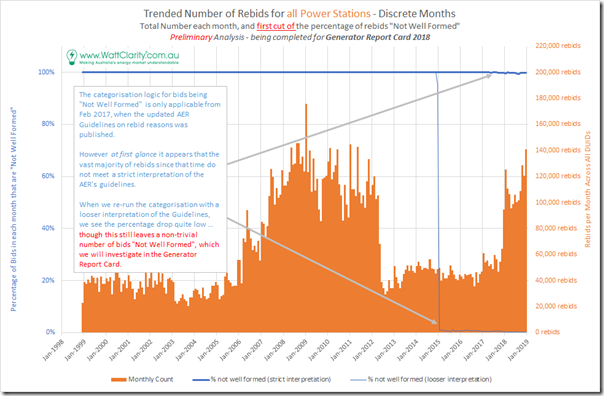
As one of a number of queries we have run on all rebids for the history of the NEM (for every DUID – including for the scheduled load components of batteries and pumped hydro) using a strict interpretation of these guidelines.
Whilst it was not surprising at all that the percentage of “Not Well Formed” bids was 100% in the early years of the NEM (i.e. because the guidelines did not apply then) we were quite staggered to see that with this strict interpretation codified in a filter, almost all bids are continue to be “Not Well Formed”. You can see this here:
In starting to sift through all rebids (there are quite a few, as you can see) we have uncovered a number of consistent patterns that some portfolios seem to use. Whilst not strictly adhering to the AER’s guidelines (if you wanted to interpret them strictly) they do seem to follow the general intent of the guidelines, in terms of being
Some examples of these “Well Formed, if we use a looser interpretation” include:
0118~P~explanationtext
01:18 P explanationtext
01:18:30 P explanationtext with full time including seconds
0118P explanationtext without space between time and reason type
We re-run the query and produce the second trend of percentage and see that it drops well below 100% from January 2015 onwards – which is more what we had been expecting.
Readers should understand that, even with this looser filtering, there remain something like 3,000-4,000 rebids a year that appear Not Well Formed at all. We have not yet had time to delve into the detail, to see if there are patterns we can see about them coming from certain portfolios, and/or for certain DUIDs.
——————-
Again, reiterating that this is a very early cut of this part of the analysis, we are looking forward to delving into considerable detail here as part of the mammoth project underway in compilation of our Generator Report Card 2018.
Comments more than welcome:
1) Below, if you want them to be public; or
2) Just with us, via this feedback form; or
3) Give us a call on +61 7 3368 4064.


Leave a comment