This evening I am posting three related ‘after the fact’ articles about what went on in the QLD region earlier in the evening of Tuesday 8th March 2022, and these will be followed up later (time permitting) by some more detailed analysis. Each of these articles is separately published, so separately addressable.
These articles follow what I posted around 17:00 NEM time, at which point the QLD ‘Market Demand’ had had reached 10,000MW … only 52MW below the previous all-time record.
(A) New all-time demand record in QLD
This is the first article of the three.
It probably does not actually matter which way you measure it (for some of the gory details of the many ways in which ‘demand’ can be measured, see here) … by any metric we look at, QLD saw a new all-time record for demand this evening:
(A1) Looking specifically at ‘Market Demand’
On WattClarity and in our software we commonly speak about ‘Market Demand’, as that is the term that most pertains to outcomes in the market.
1) It’s what the AEMO publishes as ‘TOTALDEMAND’ in the MMS.
(a) Now (despite NEMMCO’s old name for it in the MMS) it’s definitely not total demand (in a grid sense)
(b) It’s also important to note that it’s AEMO’s forecast at the start of the dispatch interval of what will need to be met at the end…
2) … but that does not ultimately matter to the market, as it is the number that is actually used as a prime inputs into NEMDE, and hence:
(a) what dispatchable generators are dispatched to meet; and hence
(b) plays a central role in how (and at what level) the price is set.
(c) … which combine together to produce their spot revenue, and hence return.
3) In that sense, it’s the prime number dispatchable generators care about most
… anything that operates outside of the market (the Non-Scheduled and Invisible Generators, for instance) are things they can’t compete against, because they are outside of ‘the market’ dispatch process.
4) For that reason, we (and others) are increasingly referring to it as ‘Market Demand’.
Hope the above provides some context to why we use that measure … and why we refer to it as ‘Market Demand’.
(A1a) When (and at what level) was the prior ‘record maximum’ level?
As noted earlier this evening (on the Market Demand measure) the previous record was set back on 13th February 2019 … at 10,052MW.
Though we have also noted earlier that this prior level would probably have been eclipsed during the heatwave conditions of 1st and 2nd February 2022 if not for early action of Reserve Trader, and also some fortuitous turns of weather.
(A1b) Where did we land this evening?
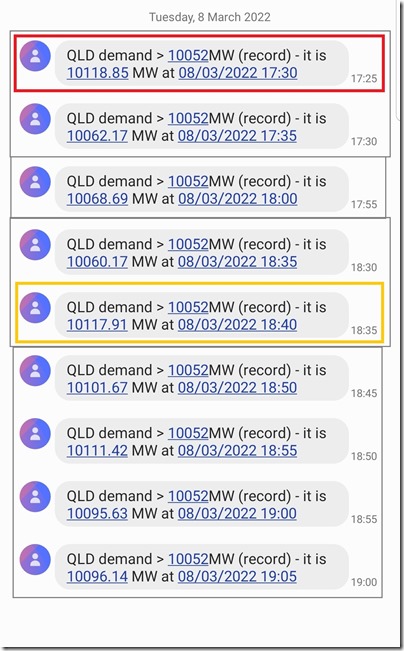
Via some pre-set SMS alerting capability that’s available in a number of our software applications, I was peppered with SMS alerts this evening on a range of different parameters. here’s a snapshot of the series of alerts I received this evening … on each of the 9 occasions, the level of ‘Market Demand’ seen was higher than the prior all-time record
I’ve highlighted the 17:30 dispatch interval, where we see the highest demand point this evening, with Market Demand up at 10,119MW … so 67MW higher than the previous 13th Feb 2019 record. It’s important to note that:
1) The 18:40 dispatch interval (i.e. a full 70 minutes later) was lower than that by <1MW
2) More generally, we see that the demand was intermittently higher than the prior record over 9 separate DIs, spanning 95 minutes … which is a long span of time for a ‘peak’ event exceeding the prior all-time-record!
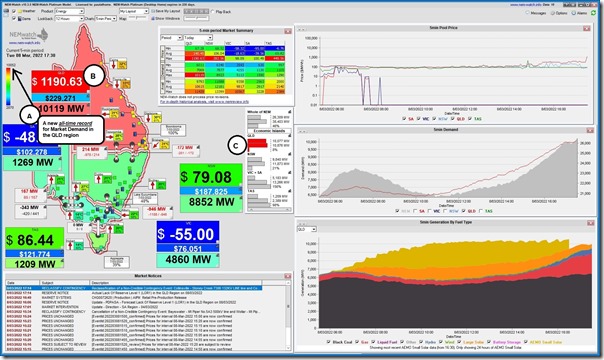
Here’s this 17:30 dispatch interval, captured in this NEMwatch snapshot:
(A2) Looking separately at ‘Operational Demand’
Because the AEMO’s job also entails ‘keeping the lights on’ (i.e. in addition to ‘operating the market’ according to the rules), the AEMO is increasingly referring to demand as what they describe as ‘Operational Demand’ … which you might think of as what they can easily see in real time in the grid (hence the term ‘Grid Demand’).
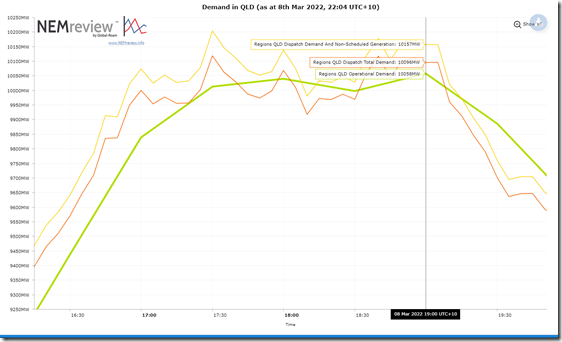
Referencing what the AEMO publishes as ‘Operational Demand’ in a hastily prepared trend in NEMreview v7, we see that the peak Operational Demand figure this evening was for the half hour ending 19:00 and was at 10,058MW:
In a quick scan this evening, the previous highest point for ‘Operational Demand’ I could find was from back in February 2019 at 10,044MW … which would mean that this evening’s peak ‘Operational Demand’ would be a new all-time max … but by only 14MW!
I assume that AEMO and/or Powerlink will be along tomorrow to confirm officially?!
(A3) What about ‘Underlying Demand’?
You might also have heard of the term ‘Underlying Demand’, which is a term used to represent (conceptually at least) the aggregate rate* of withdrawals from the interconnected network at any given point in time … no matter where in the network these withdrawals are made (and no matter what the source of injections to supply the withdrawals).
* i.e. remembering a megawatt is a rate of ‘flow’ … analogous to a Litre per second of fluid flowing.
The total level of ‘Underlying Demand’ is invisible … because there are various supply sources that can’t be practically measured and aggregated in real time (particularly rooftop PV, which has been discussed several times here before).
(B) A run of price volatility
Looking at the NEMwatch snapshot above, point ‘B’ highlights the extreme pricing that was experienced at 17:30 … but it was a long run of price volatility that we addressed in this linked article.
(C) Very tight supply-demand balance
Also in the NEMwatch snapshot above is a (C) marker highlighting the low Instantaneous Reserve Plant Margin shown for the 17:30 dispatch interval … down at only 8% for the QLD ‘Economic Island’.
But the level dropped even lower later than this … as covered in this third linked article.
(D) Other articles
Time permitting, other articles might come later…


Leave a comment