Turning attention a few thousand kilometres north of Loy Yang A power station, this afternoon I could not help but notice* that the Queensland region has been bumping around in the red zone this afternoon (Tuesday 21st January 2020), with Scheduled Demand** exceeding 9,650MW – which is the highest level so far reached this summer.
* Dashboards are good at delivering this situational awareness without you even really being conscious of it – something we have noted here for our NEMwatch v10 entry-level dashboard.
** For a detailed explanation of what ‘Scheduled Demand’ is, and how this differs from ‘Operational Demand’ please refer to this earlier article on WattClarity. AEMO is increasingly referring to Operational Demand (as it also incorporates some of the demand supplied ‘behind the market’) but there is not a comprehensive history of this data supplied for this back to the start of the NEM, so we’re unable to present longer-term trends for this like we do for Scheduled Demand below.
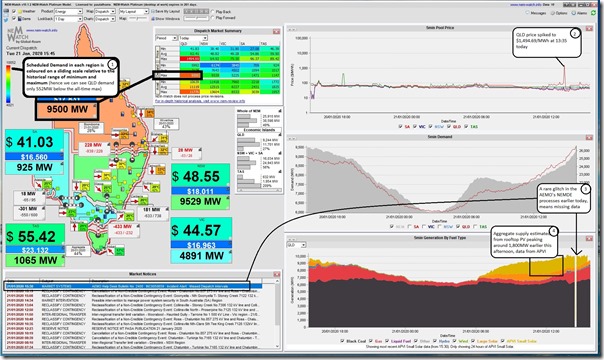
At 15:45 this afternoon we captured this snapshot from NEMwatch v10 showing the Scheduled Demand reaching of 9,500MW (a nice round number):

Click on the image for a larger view.
I’ve annotated the image with four key points from today:
1) At this point in time, we saw Scheduled Demand at 9,500MW (so 552MW below the all-time maximum level set in the previous summer), which was the highest point the QLD Scheduled Demand had reached at the time.
2) I’ve also highlighted the early-afternoon spike to $1,494.69/MWh earlier this afternoon (spike occurred for reasons not explored in this article).
3) We see a record of the rare glitch that the AEMO experienced this afternoon on its NEMDE and MarketNet systems, resulting in data being missing for the 14:45 and 14:50 dispatch intervals – as noted in Market Notice 72822
4) Also noted is how estimated injections from rooftop PV systems across the QLD region peaked earlier today at around 1,800MW level:
4a) This will have substantially ‘eaten into’ Native Consumption and hence reduced Scheduled Demand;
4b) The estimated contribution is based on an estimate supplied to us by APVI
4c) Note (with respect to these questions raised earlier) that this APVI data feed has now been upgraded to use a newer methodology that more closely matches – though still not perfectly (but they are ‘estimates’!) the estimates produced by AEMO. Will try to find some time to explore and explain this more later – but first need to finish and release the Generator Statistical Digest 2019.
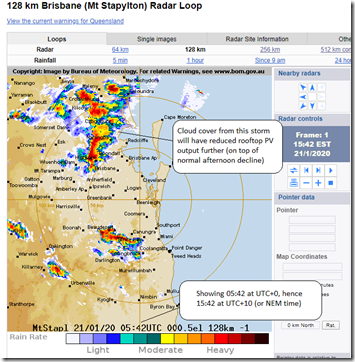
4d) This early-afternoon peak (highest at 12:10-12:15) in rooftop PV has declined significantly at the time of the snapshot – down to 834MW (so 1,000MW lower – but still a substantial contribution) due to the natural path of the sun through the day, but also because of the afternoon thunderstorm that swept through south-east Queensland this afternoon as seen in the snapshot from 15:42 from the Mt Stapylton Radar at the BOM:
As it turned out, the Scheduled Demand crept a little higher (to reach 9,657MW at 16:10 – so less than 400MW off the all-time record, and also the highest level experienced thus far this summer).
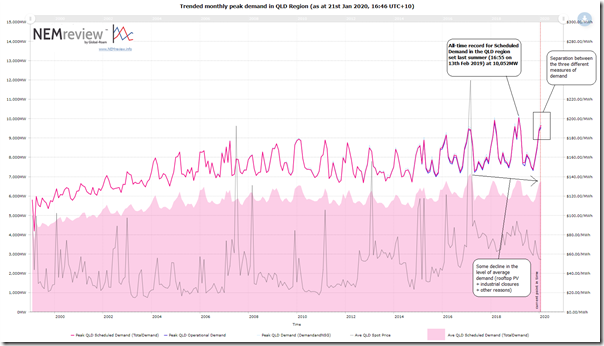
Using this trend generated from NEMreview v7, we quickly look at the trend in monthly peak for each of the three main demand numbers published by AEMO:
We can clearly see that the demand level experienced this afternoon in Queensland is the highest level that has been experienced since the prior summer – and is higher than the levels experienced in all prior summers (excepting the most recent two – 17/18 and 18/19). With schools back next week and businesses more fully cranked up, we will watch to see what the coincidence of hot/humid weather, late afternoon cloud cover, and working weekdays delivers***.
*** An illustration of the importance of these two was noted when the all-time record was reached at 16:55 on Wednesday 13th February 2019. Time will tell if we experience similar conditions in the coming month.
———————
Note that the Queensland region, in particular, increasingly exhibits a “two hump” shape for demand during summer – with the second hump occurring when solar has gone to bed, on days when temperature and humidity remain high. It’s too early to see what will happen today, though that storm has knocked a few degrees of the temperature in south-east Queensland (at least for now).


Be the first to comment on "Queensland Scheduled Demand exceeds 9650MW today – within 400MW of the all-time record!"