
The AEMO’s Electricity Statement Of Opportunities (ESOO) provides us with a detailed but nuanced look at demand, generation, and reliability projections for the decade ahead.
With the 2024 edition scheduled to be published next week, I’ve undertaken a small project over the last two days to review the full history of the report. I’ve done this to share some insights into what has changed over the years, and what hasn’t.
What has changed: the methodology and the purpose
The ESOO has been published annually since the start of the NEM in 1998. Its original purpose was to inform market stakeholders about the adequacy of supply to meet demand in coming years – hence the ‘statement of opportunities’ moniker.
Electronic versions from 2010 onwards can be found in the AEMO archives. We have a dusty collection of older physical copies on our bookshelves in the Global-Roam office. And conveniently, these older editions included a CD-ROM (which still work!) containing the spreadsheet model used for the reliability outlook projections.
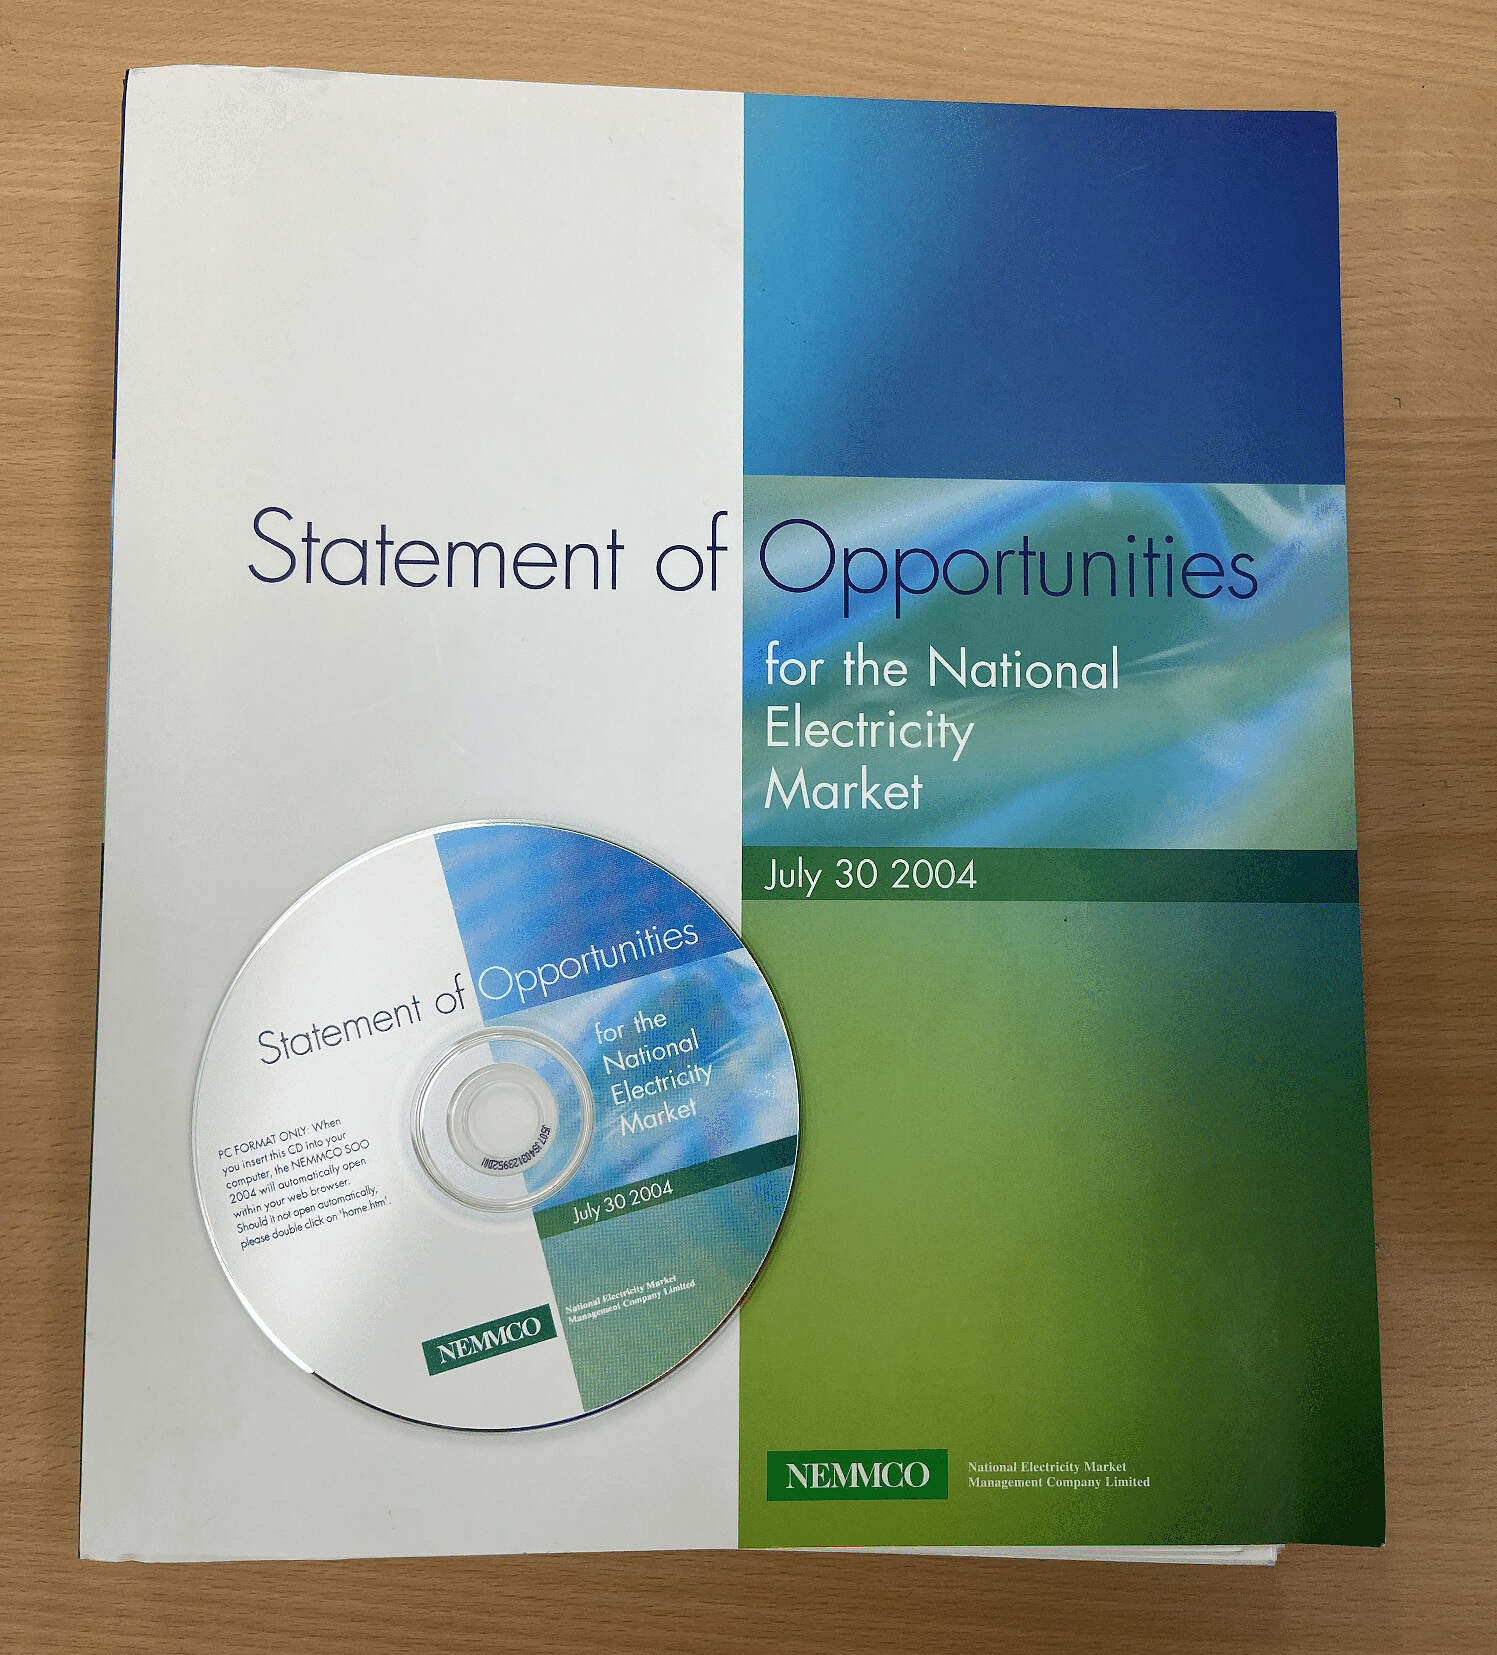
Top: The 2004 ESOO (then known as the SOO), back when it was packaged with a CD-ROM.
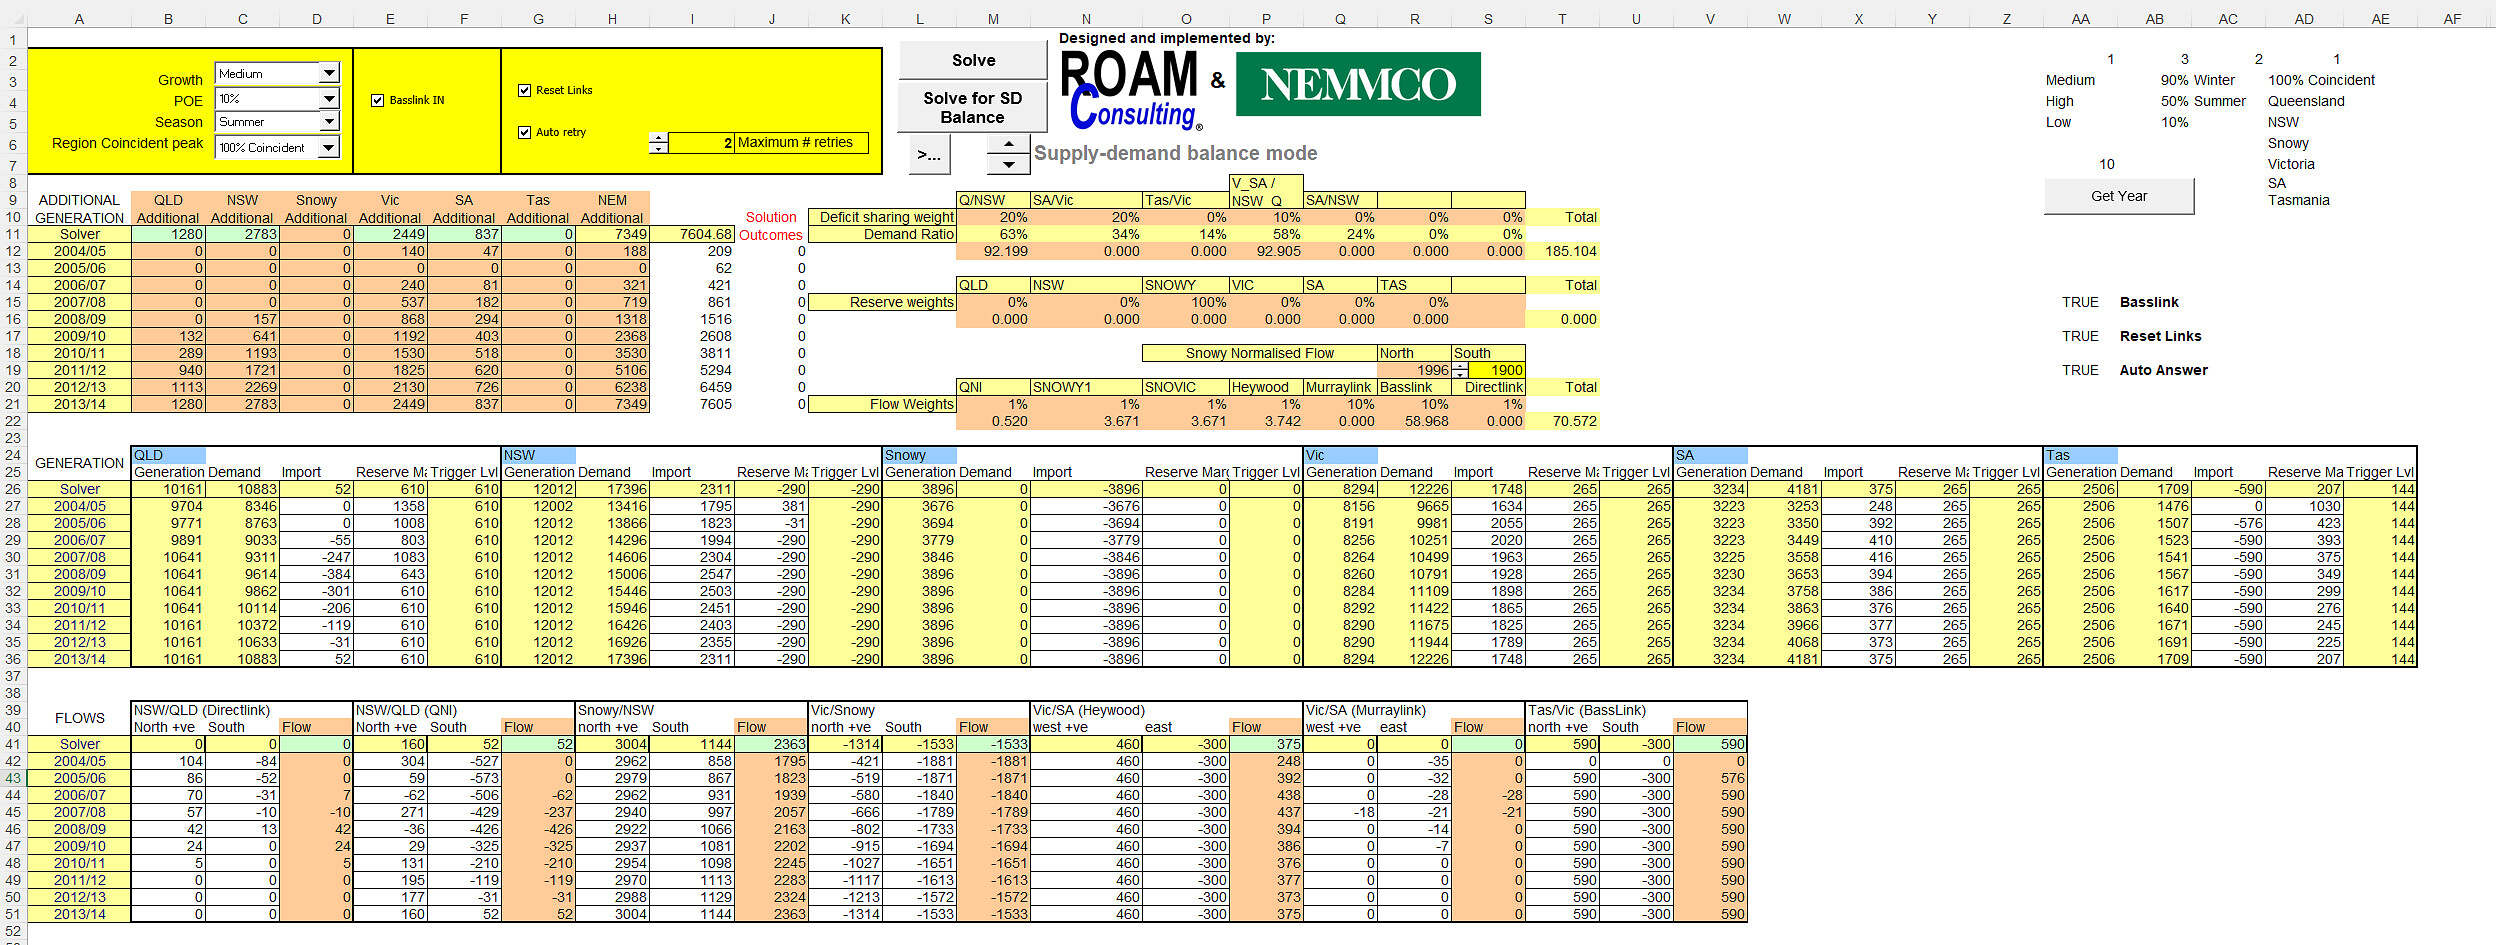
Bottom: The 2004 ESOO supply-demand balance calculator spreadsheet.
Source: Statement of Opportunities 2004, NEMMCO/AEMO.
As you would expect, the ESOO modelling methodology has come a long way in twenty years.
Amongst other complexities, the energy transition has necessitated the electricity system to: 1) have a greater dependency on weather, and 2) be designed to handle a wider range of contingency events. These new realities forced the AEMO to move from deterministic modelling, towards probabilistic methods in the mid-2010s.
The current methodology is based on time-sequential modelling over each financial year at a 1-hour granularity, using Monte Carlo simulations of security-constrained optimal dispatch. The results from these simulations are probability-weighted and assessed against the reliability standard.
The reliability standard in the NEM has always been 99.998%. Simply stated, this means that only 0.002% of demand should be allowed to be unserved by supply each financial year (the equivalent of roughly 10.5 minutes of outages for the average consumer).
However, two policy developments in the late-2010s moved the goalposts, and muddied the purpose of the ESOO:
- In October 2018, the since-disbanded COAG agreed to implement the Retailer Reliability Obligation (RRO). Read Ben Skinner’s excellent summary here if you want to understand all of the gory details of what it is, how it came to be, and the compliance obligations it entails.
- In November 2019, the since-disbanded Energy Security Board recommended energy ministers introduce the Interim Reliability Measure (IRM) – a much stricter threshold for unserved energy, of 0.0006%. This then became a trigger for the RRO in place of the original reliability standard.
These two changes meant that the results from the reliability outlook became even more sensitive, and began to act as an initiator for real-world compliance obligations.
And finally, it’s also worth noting the increasing use of the RERT mechanism over a similar timeframe. Last year we saw RERT tenders initiated almost immediately after the release of the ESOO.
What hasn’t changed: mis-forecasts and modelled supply shortfalls
There are a few common threads that have become apparent to me from skimming through 20+ editions of the ESOO over the last couple of days.
Firstly, it is clear that demand has been significantly over-forecasted in some historical instances and (albeit less frequently) under-forecasted in others.
I would argue that these prior mis-forecasts are less to do with a lack model sophistication, and more to do with the input assumptions regarding the underlying drivers, made up of:
- Under-predicted factors (i.e. not always anticipated, but did eventuate) – such as the uptake of rooftop solar, increasing energy efficiency, an LNG industry in Queensland, the timing of Hazelwood’s closure, etc.
- Over-predicted factors (i.e. anticipated, but did not eventuate) – such as policy continuity, a long-term emissions trading scheme, the timing of Eraring’s closure, etc.
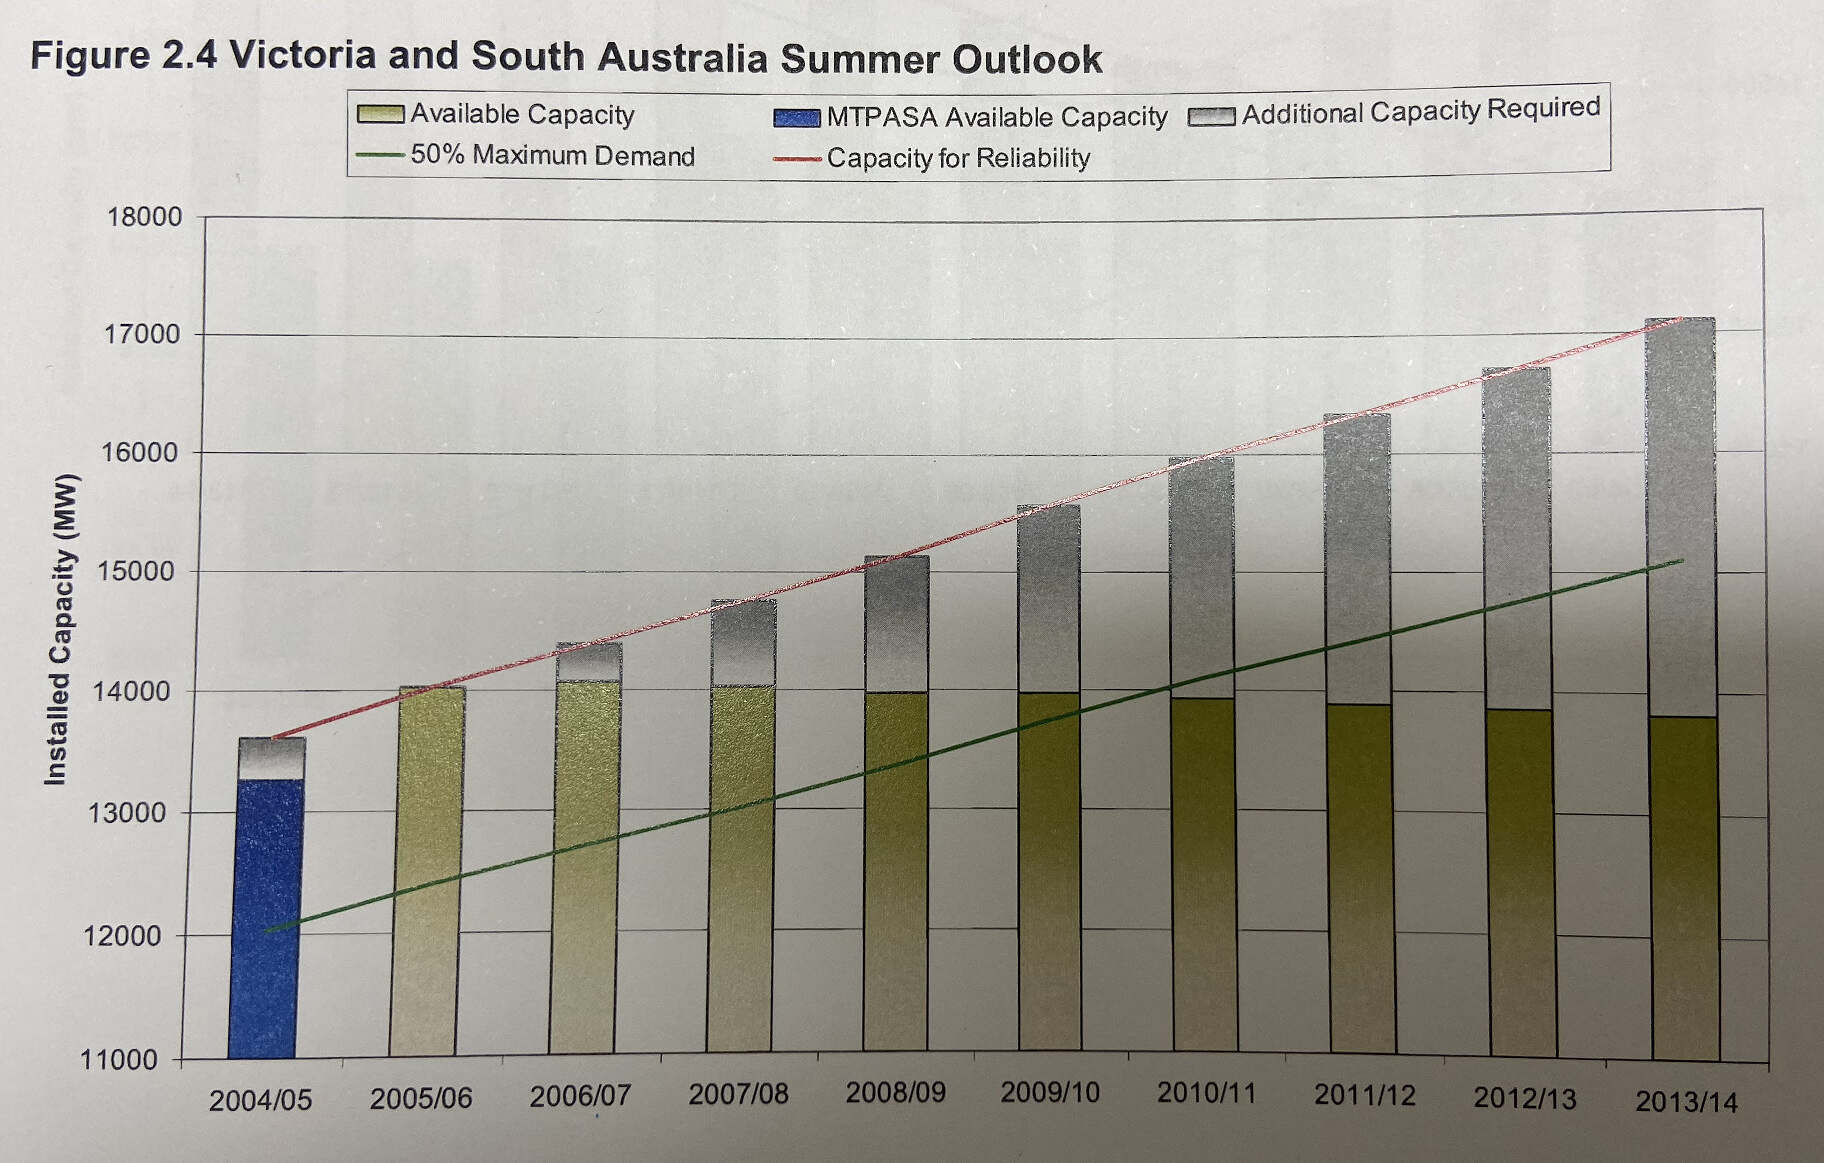
SA and VIC were modelled as one region in the 2004 ESOO, with the reliability outlook showing supply shortfalls for 9 of the 10 years ahead.
Source: Statement of Opportunities 2004, NEMMCO/AEMO.
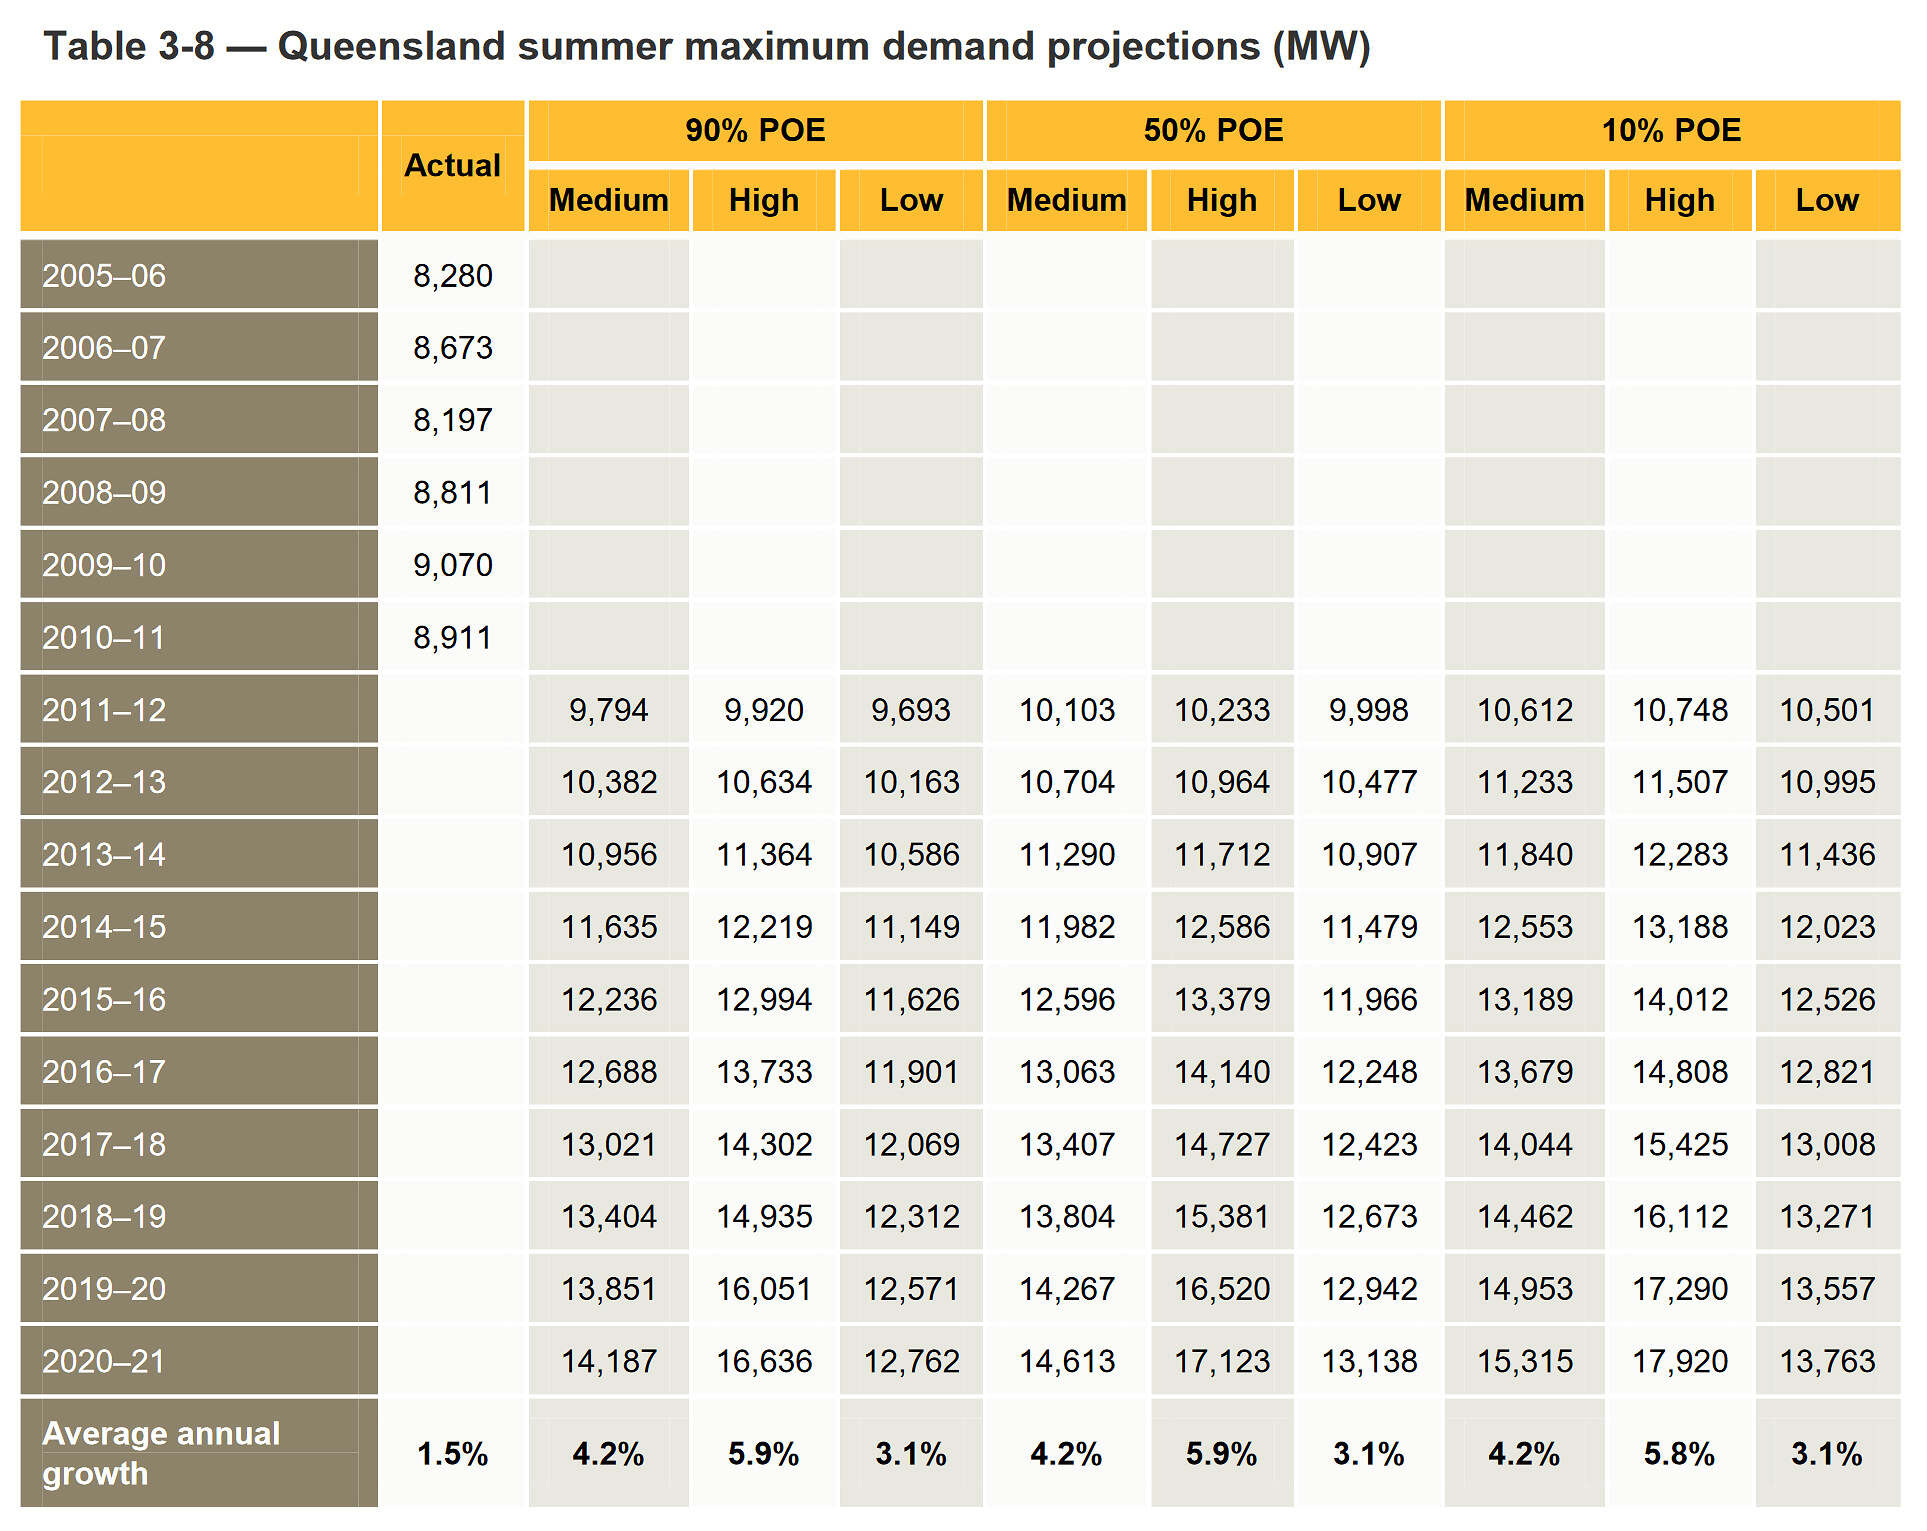
With the benefit of hindsight, the demand forecast for QLD from the 2011 ESOO overshot the mark. The QLD maximum demand record was most recently broken in January 2024, landing closer to 11,000 MW.
Source: Statement of Opportunities 2011, AEMO.
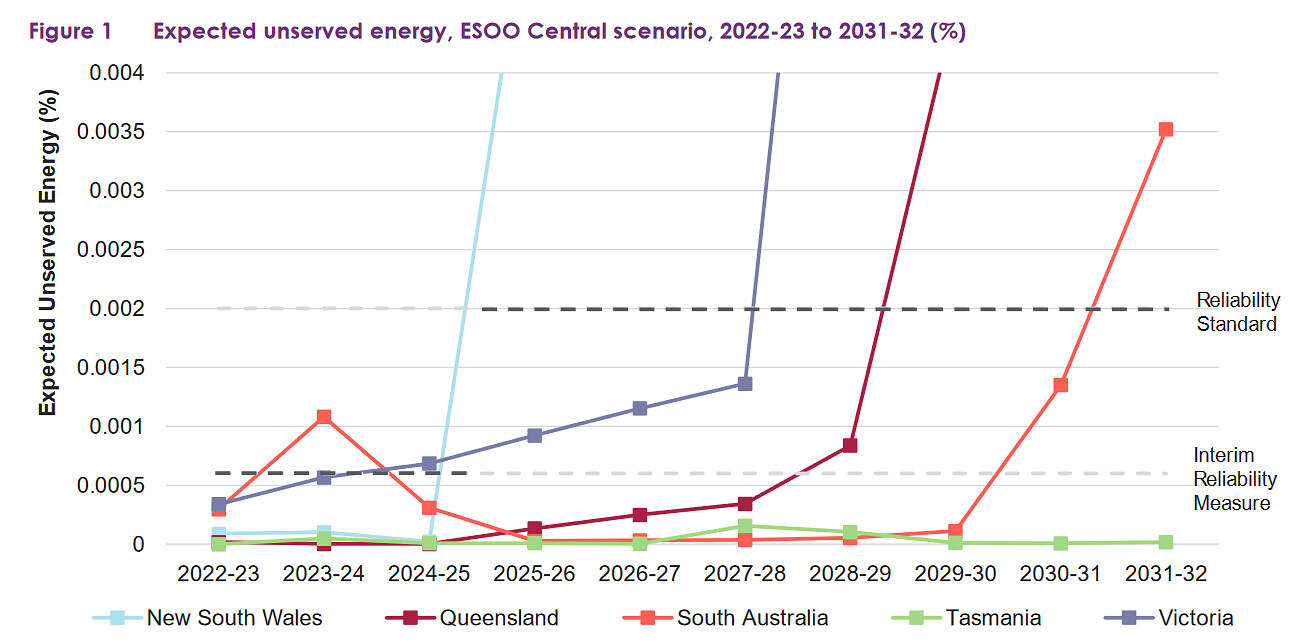
The 2022 ESOO’s reliability outlook raised some alarm bells, and was prior to the announcement of Eraring’s extension.
Source: Electricity Statement of Opportunities 2022, AEMO.
So all models are wrong, but some are useful… that’s probably not particularly enlightening for long-time readers of our blog.
My second and more important observation is that the ESOO has a long history of projecting supply shortfalls. The first image in the series of three above illustrates that this was true even two decades ago. And despite these projections, the NEM has, largely, maintained high levels of reliability since inception.
So does that mean that the AEMO are really awful at forecasting, and always have been?
No.
The report is meant to inform the market, so it is an intentional feedback loop. If it does that, then it has achieved its primary purpose – even if that means that what then unfolds is different than the forecast.
This in itself therefore almost guarantees that the reliability outlook will be ‘inaccurate’.
So then, how has the ESOO faired as a blackout barometer?
Somehow the release of the ESOO has triggered an annual tradition of journalists and social media commentators misinterpreting its results as a ‘blackout predictor’ of sorts. It is a tradition that is almost as old as the ESOO itself.
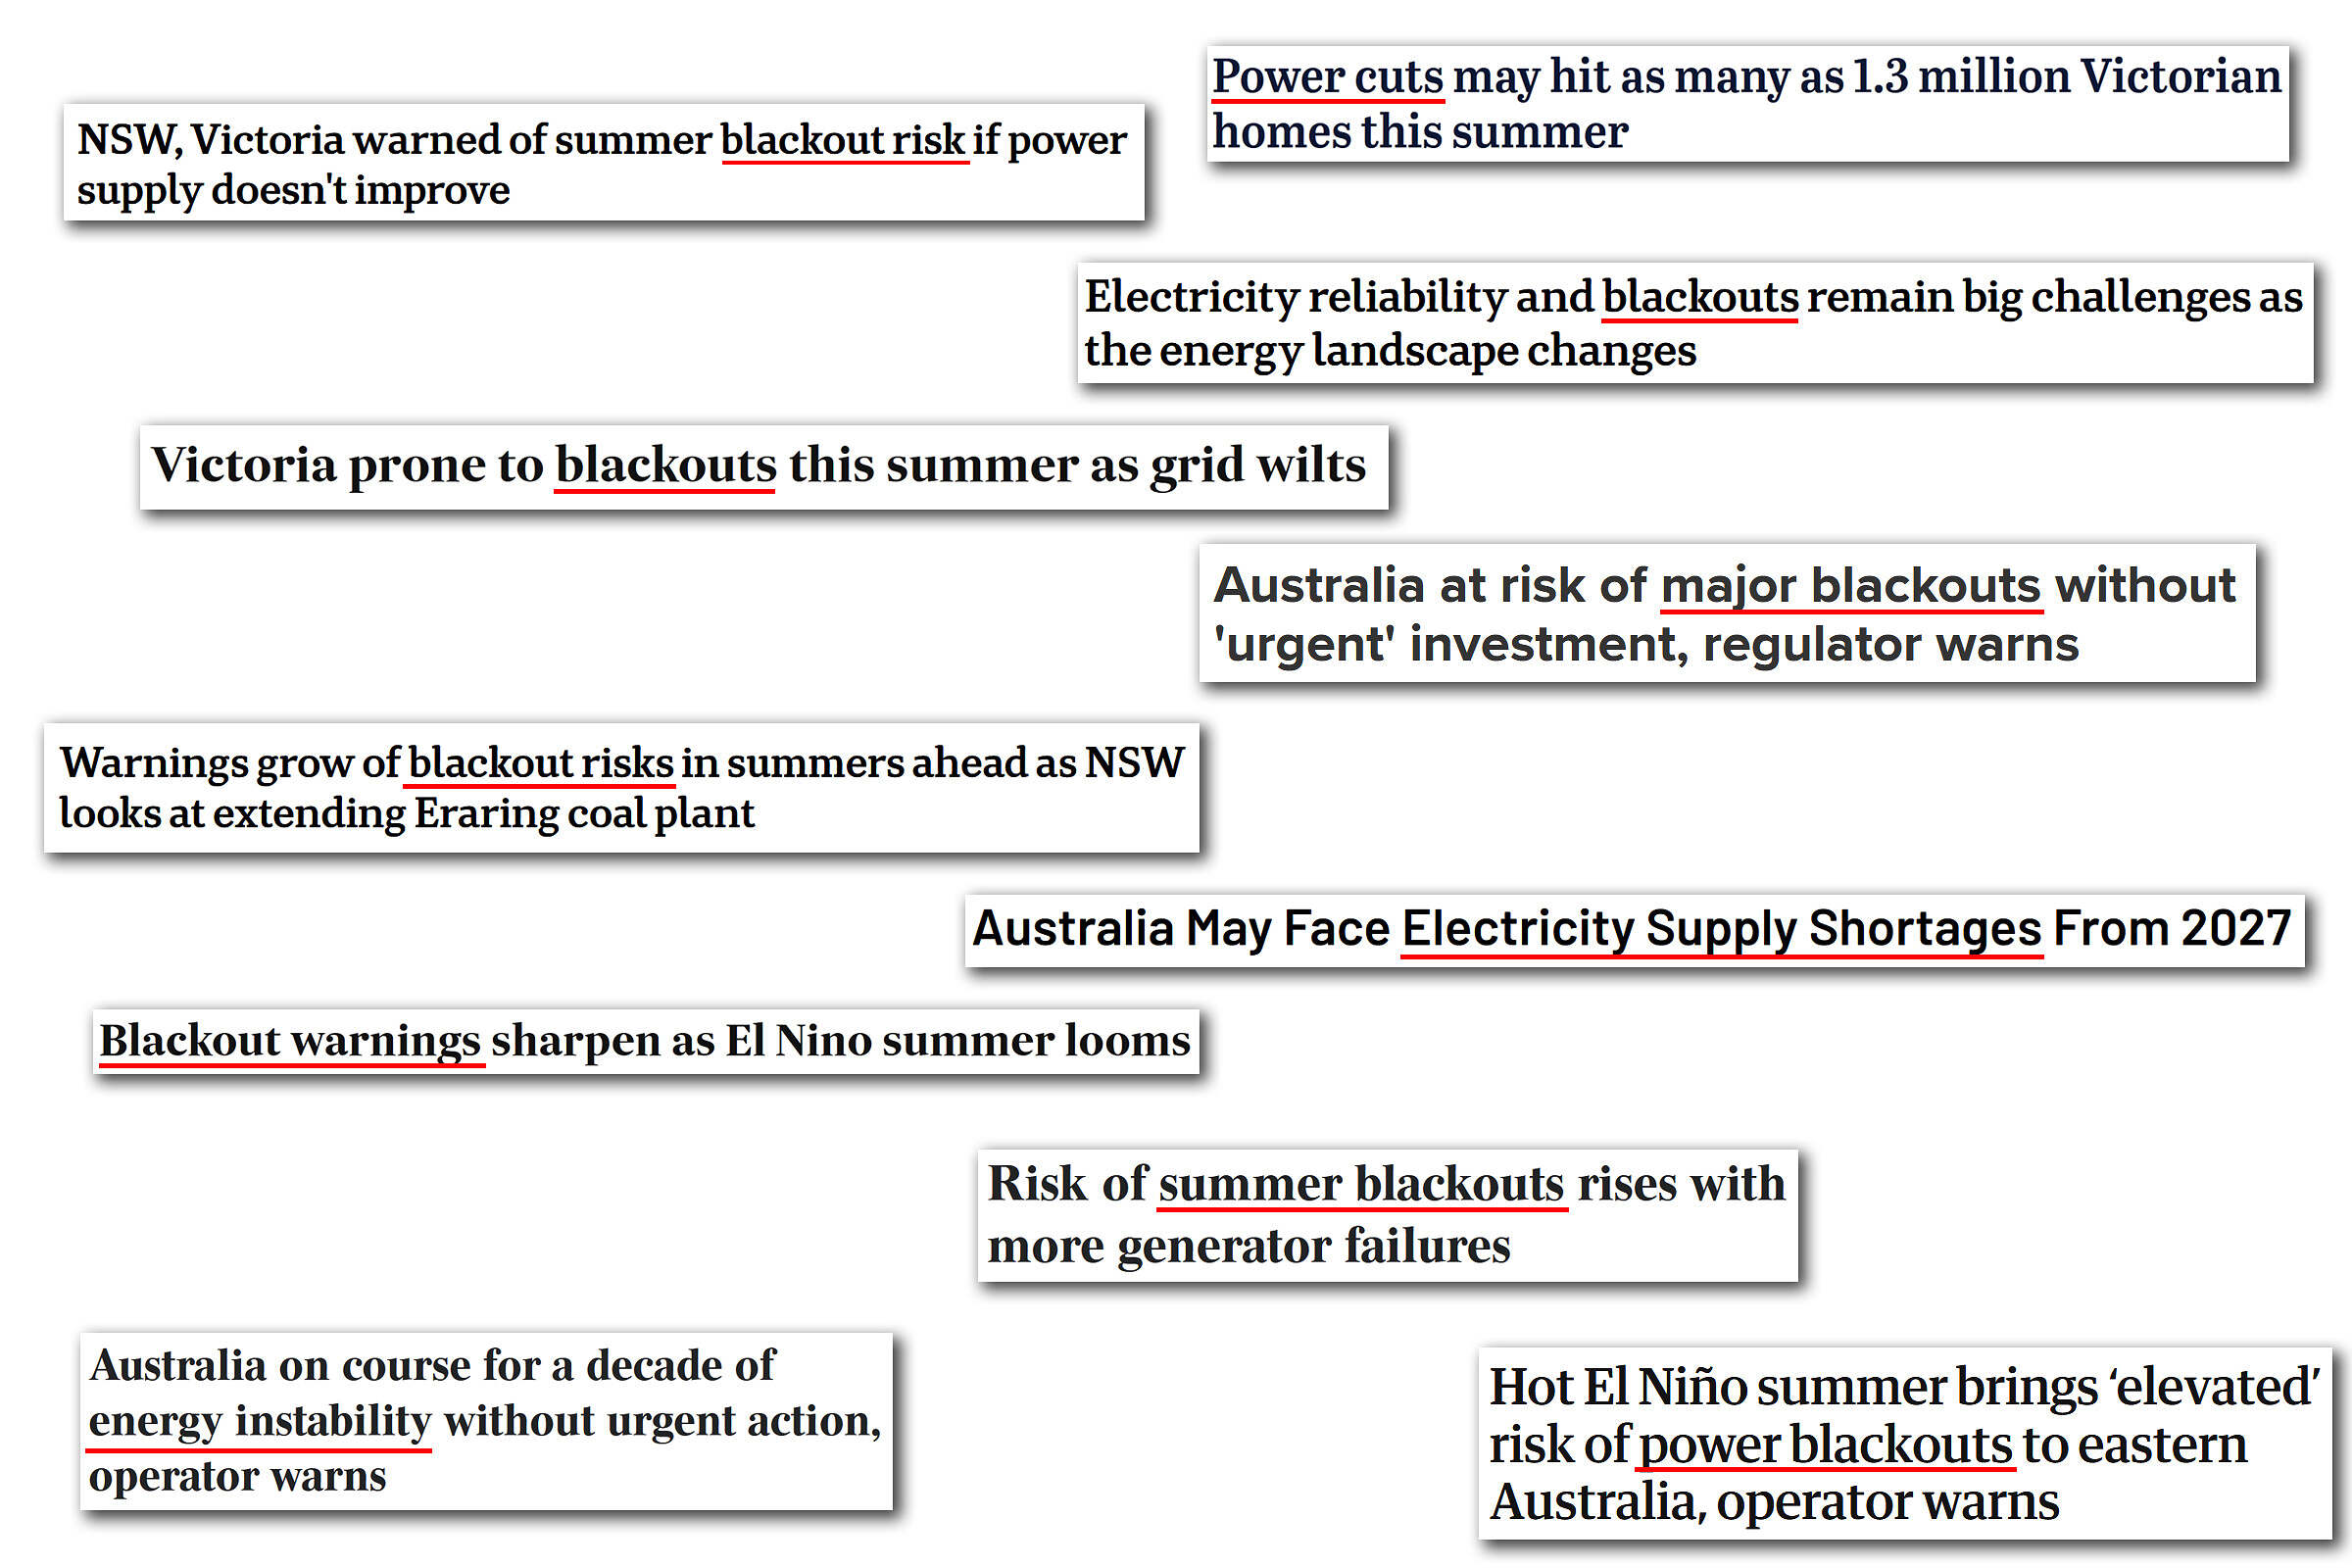
A collage of headlines about the ESOO that we’ve seen in recent years.
Sources: ABC, Financial Review, The Guardian, The Australian, Sydney Morning Herald.
If you were to believe that modelled supply shortfalls = incoming blackouts, then you might have already burned through your candle supply waiting in vain.
In the next five charts I display the number of years until a supply shortfall for each region – based on the central/neutral/medium reliability outlook in each ESOO over the past twenty years.
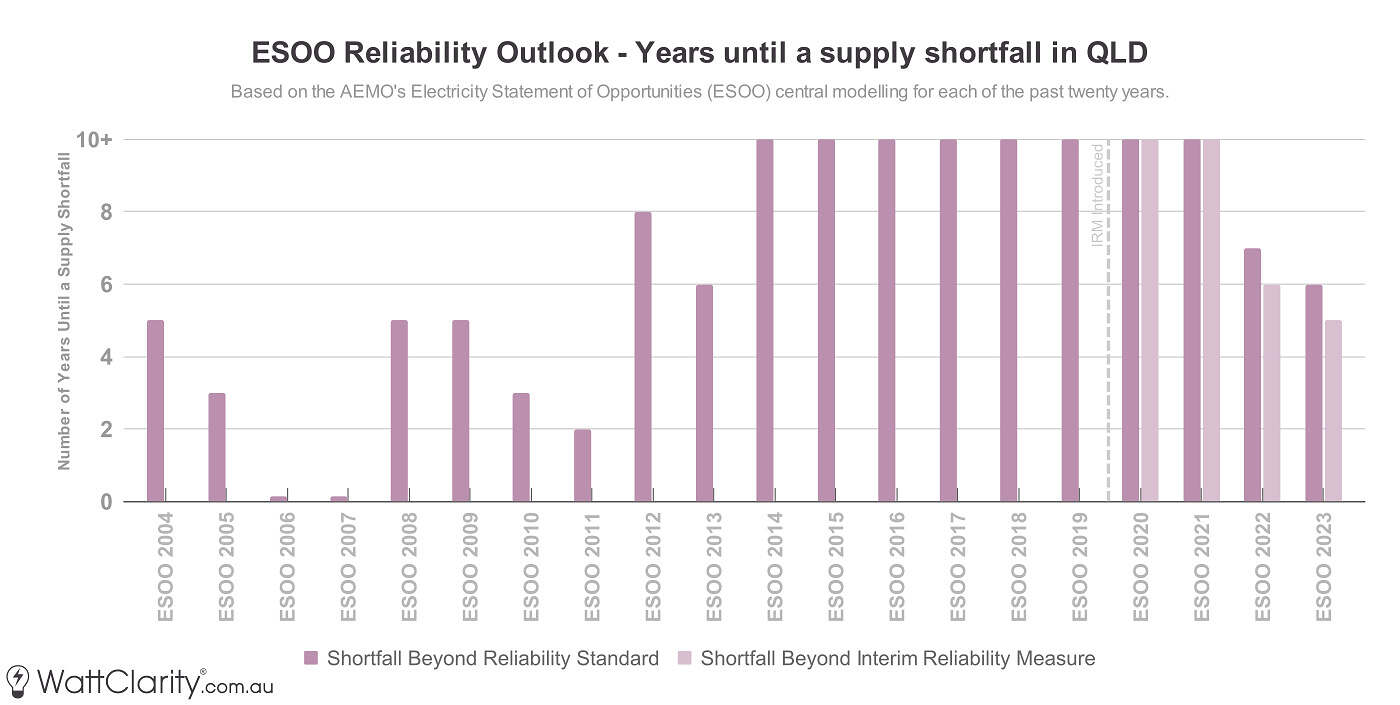
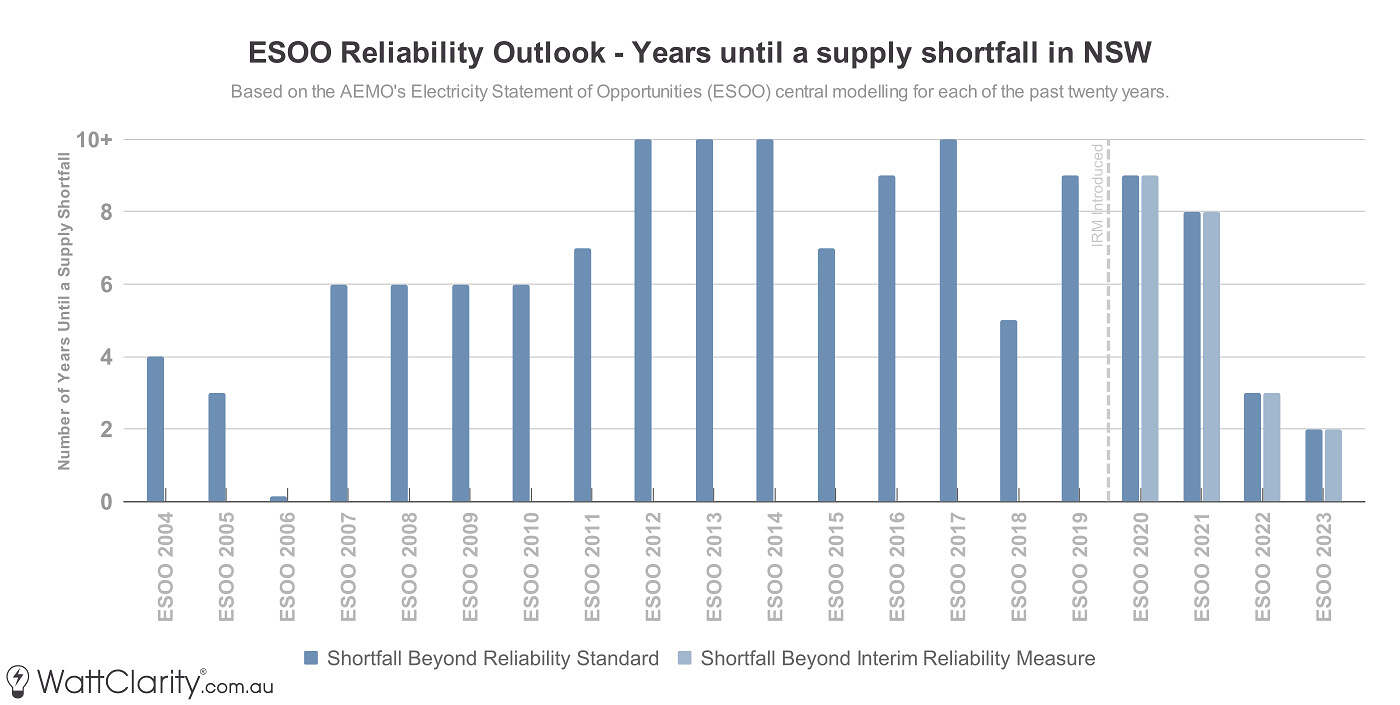
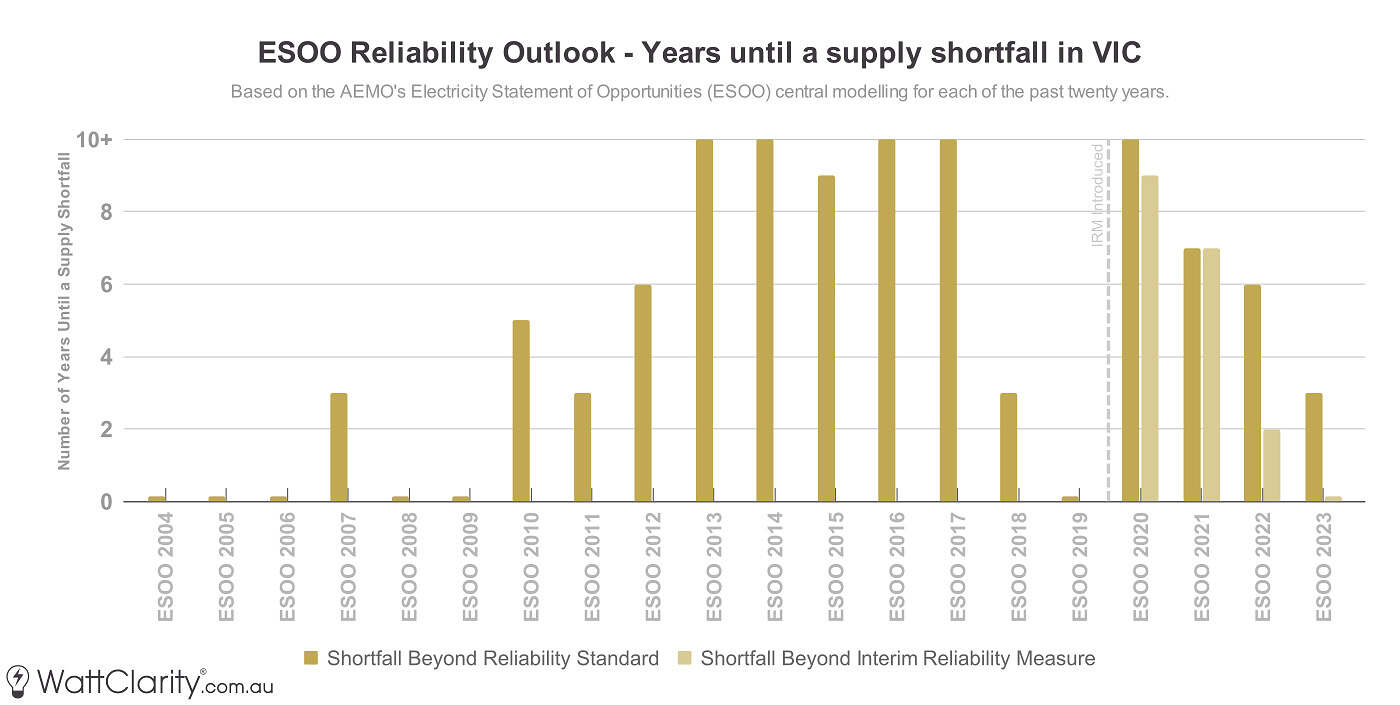
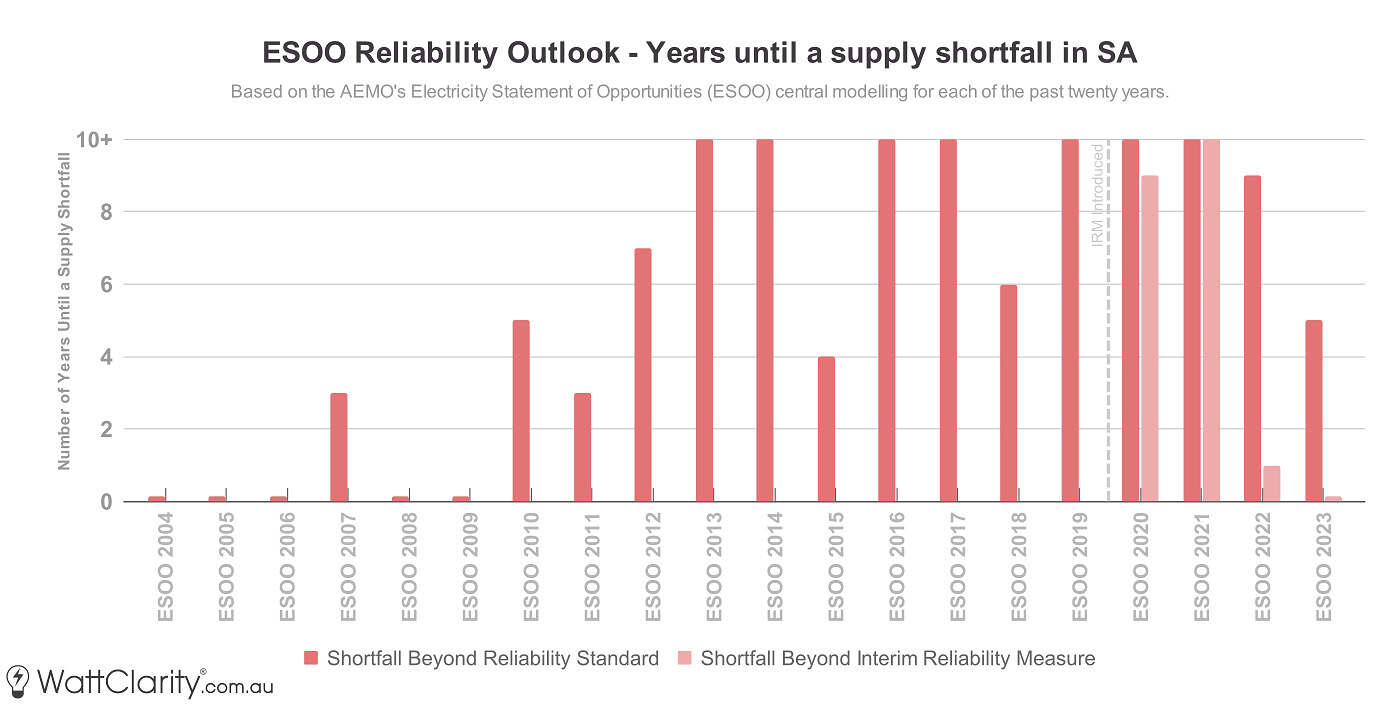
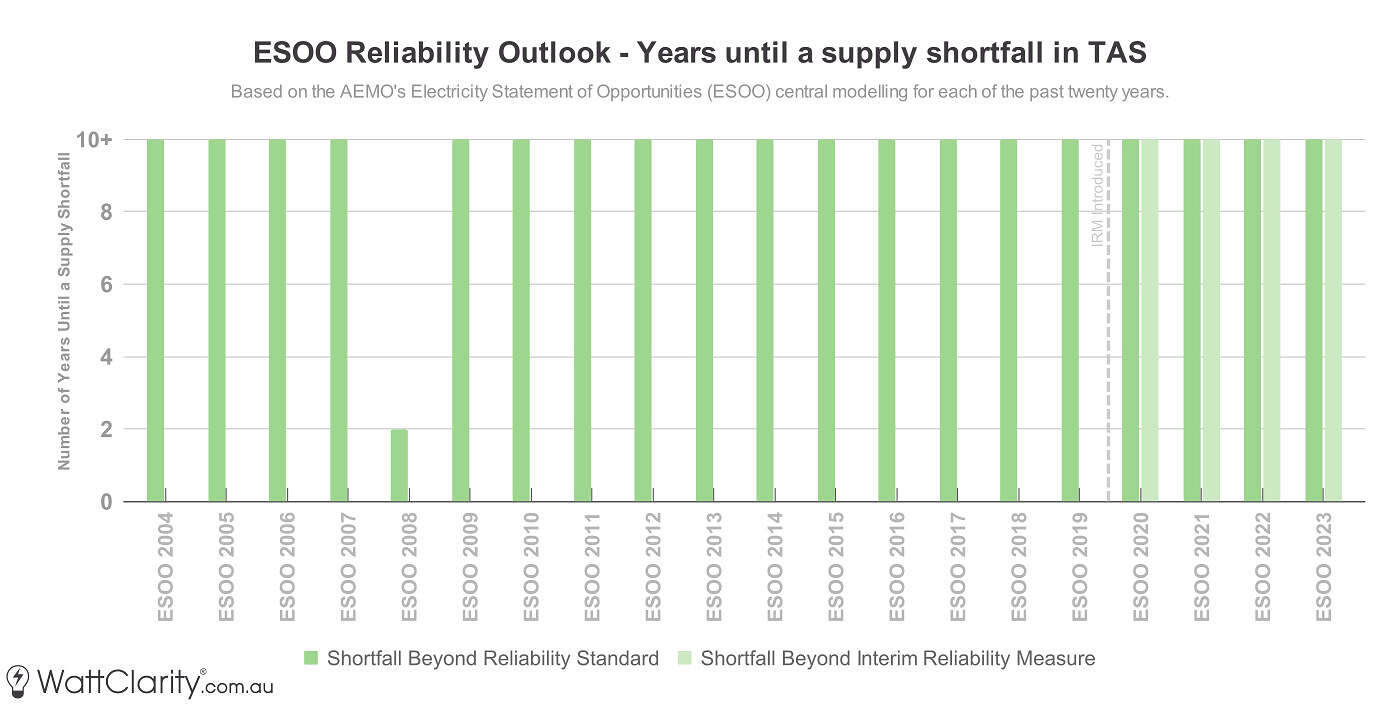
Years until a modelled supply shortfall in each of the ESOO’s reliability outlooks over the past two decades.
Source: NEMMCO/AEMO
And now for reference, below is the most recent data that I could find showing actual unserved energy levels in the NEM over a similar time range.
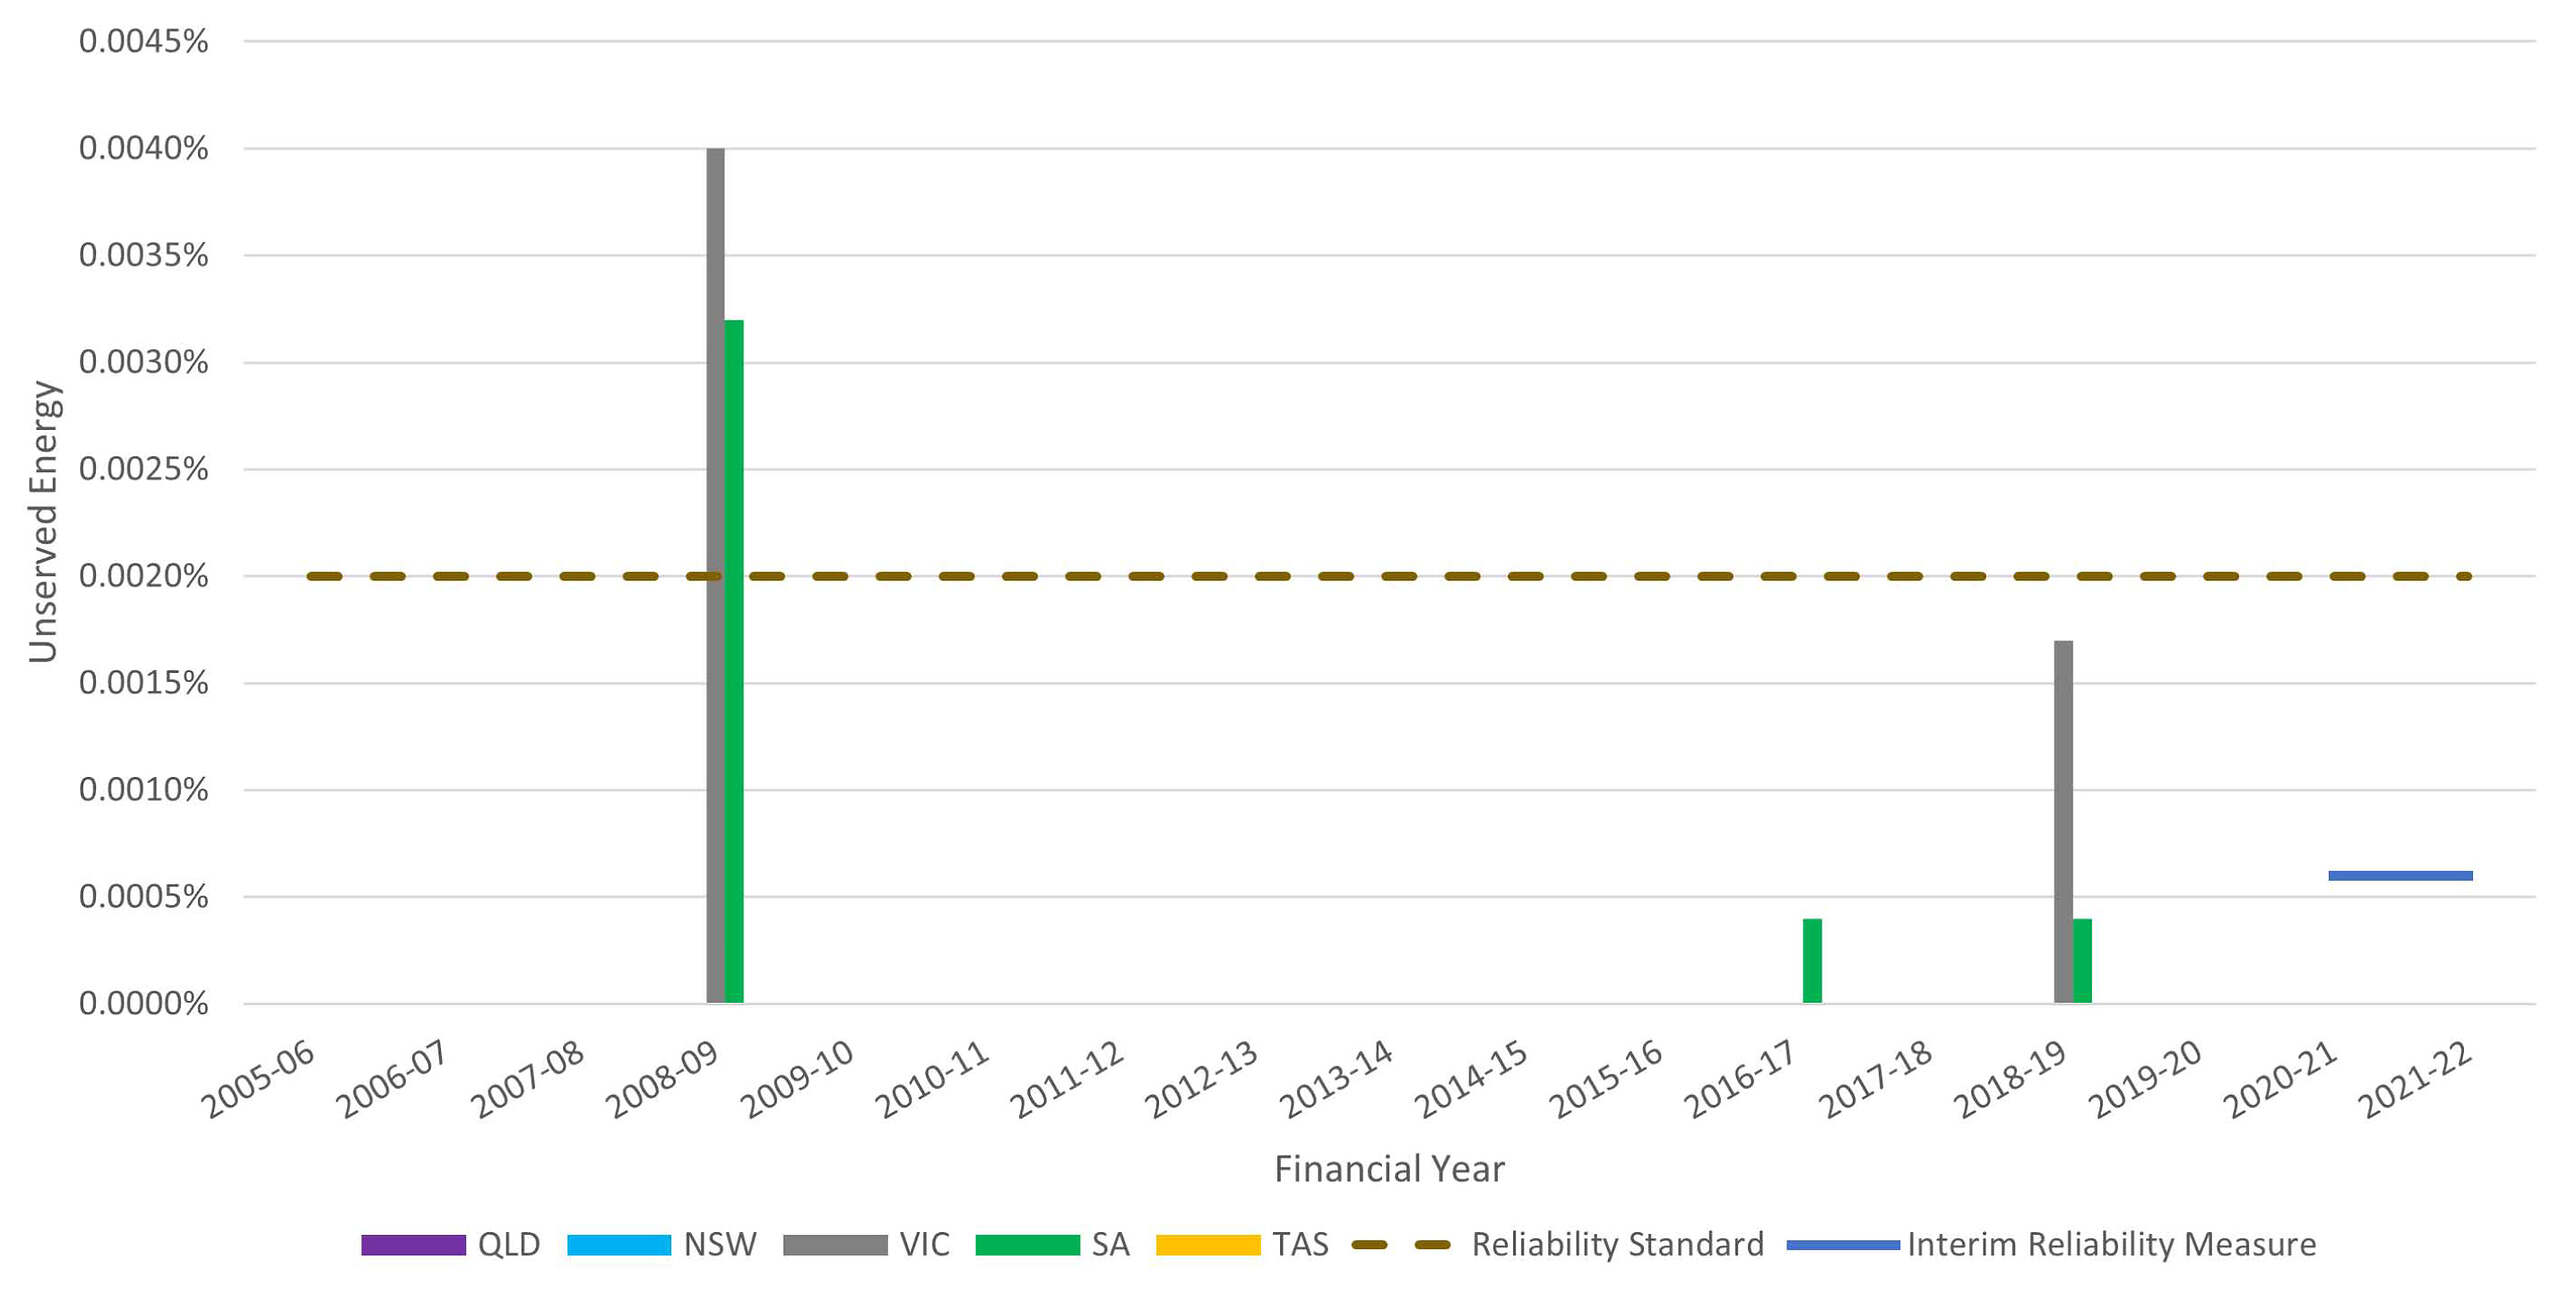
Actual Unserved Energy between FY 2006 and 2022.
Source: Reliability Panel Annual Market Performance Review, March 2023
The caveat to keep in mind here though is that the ESOO is not the only lever that the AEMO can pull to manage reliability.
In any case, the link between blackouts and the NEM’s reliability standard being breached is a bit of a silly oversimplification in the first place. As others such as Dylan McConnell have written about, distribution-level outages are a much greater source of blackout incidences for the everyday electricity consumer.
Key Takeaways
It is not a recent phenomenon that the ESOO has projected supply shortfalls, and yet we’ve seen very few historically. There should be some lessons from this, so I’ll finish with two key points:
- Like many of the AEMO’s forecasts, the reliability outlook is intended to elicit a market response. The accuracy of a rain forecast is independent of whether you decide to bring an umbrella when you leave the house. Forecasts like the reliability outlook in the ESOO are not divorced from the outcome in such a way. This is an important reason why we always need to think about that other dimension of time.
- And further, it’s in the AEMO’s self-interest to avoid a supply shortfall. That’s one of the main reasons why the AEMO exists – and you can bet good money that they will shoulder the blame if a supply shortfall eventuates. To quote a former NSW premier “Always back the horse called self-interest, because you’ll at least know it’s always trying”.
My intention here is not to downplay the urgent and obvious need for new supply, but rather to highlight that the ESOO holds up as a very poor leading indicator of blackouts… despite what the mainstream media and social media commentators might try to imply.
Great read thanks Dan.
On umbrella/rain independence – whilst I accept the theory, it doesn’t matched my lived experience. 🙂
The 1,500 reactors’ll explode in case of an unprevented long blackout/war/chaos https://GlobalBlackoutPrevention.wordpress.com
CD-ROM for the win!