
As an average Victorian electricity customer, you’ve seen some headlines about imminent blackouts because it’s going to be a hot summer, the sun doesn’t always shine, the wind doesn’t always blow, and some of those generators in the Latrobe Valley are getting a bit long in the tooth and less reliable than your uncle’s ancient Kingswood. Instant experts have appeared from the woodwork declaring that the outlook is disastrous and we should start stocking up on candles and small nuclear reactors. You’re getting a bit concerned and thinking about a trip to Bunnings.
I’ve got worse news for you – although your local electricity distribution (poles and wires) company probably didn’t get a mention in the headlines, problems in the local network that happen all the time might have you burning through 30 times the quantity of candles and barbecue fuel relative to the stocks you might need – on average – to cover the possible shortfalls in overall supply you’ve just been reading about!
How’s that? Well, here’s part of a convenient infographic from the Australian Energy Regulator on distribution network reliability:
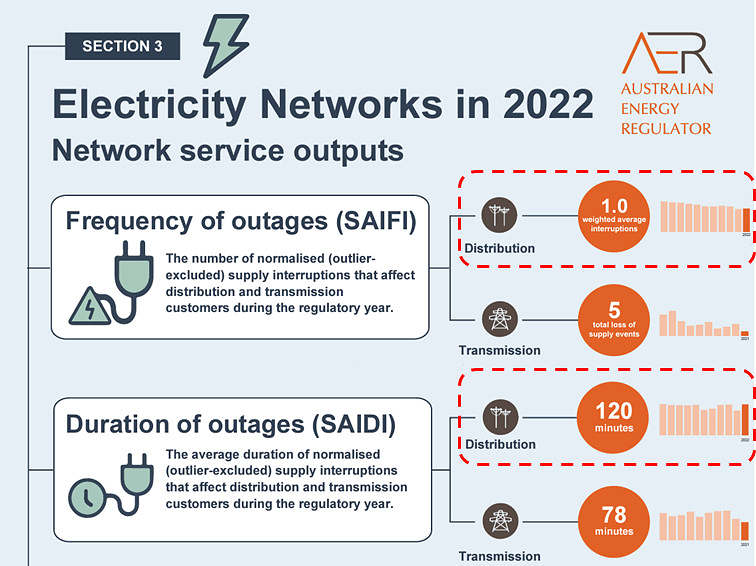
On average, a distribution-level customer (almost all users) might have their supply interrupted once per year, for a duration of two hours. There are 8,760 hours per year, so those figures would roughly correspond to 2 / 8670 = 0.023% of a customer’s average usage being interrupted. Those are just averages, so plenty of customers will see better outcomes, perhaps no outages at all, while a few unfortunate others might lose supply much more often and / or for much longer.
What about the supply shortfall risks behind last week’s blackout headlines? Well in Victoria over the coming year, AEMO puts the corresponding percentage of usage that might be interrupted – system-wide and on average – due to not having enough generation, or transmission to carry it, at about 0.0008% – 0.0009%: about one thirtieth of the annual quantity of interruption that customers can expect – on average – because of local problems like a tree falling on a powerline or an unlucky possum’s shortcut turning into a short circuit.
Thought bubbles
Just as individual customers might see wide ranges of local interruption outcomes from year to year, individual scenarios for grid-level supply reliability over the coming year show a variety of possibilities depending on just what the weather does, how well our generators perform and whether transmission networks hold up under various conditions.
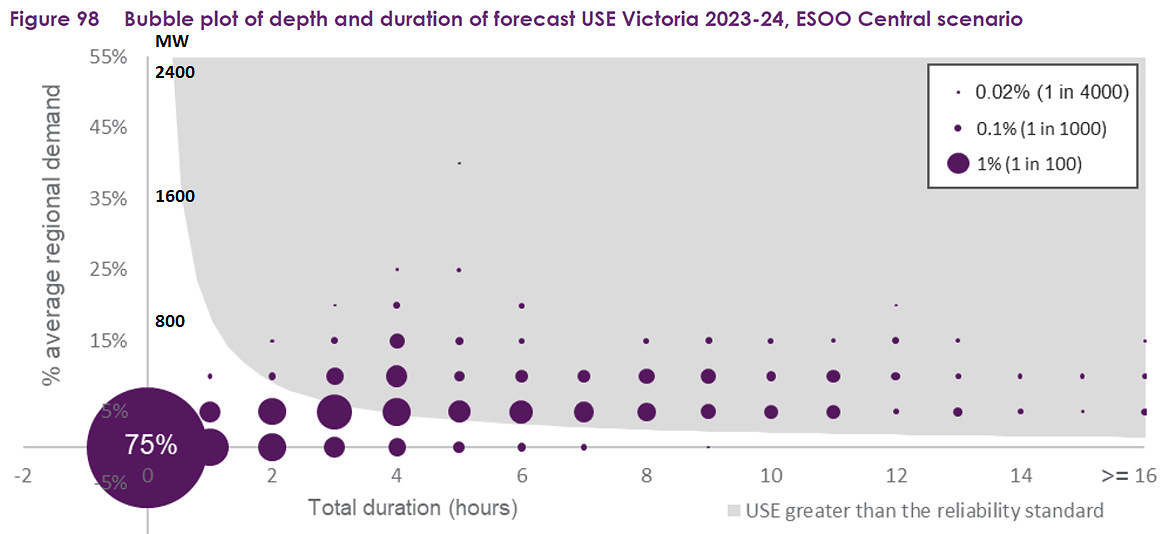
In AEMO’s 2023 ESOO, the graphic that best captures this range is the “bubble chart” (new in this year’s ESOO edition – see Figure 98 in Appendix A5 – on p160/175) that groups together supply shortfall results from something like 4,000 individual scenarios run for each year and region. Each scenario represents a different combination of weather outcomes, random generator outages, renewable output levels and so on. All these individual outcomes ultimately get probability-weighted and averaged together into a single “expected unserved energy (USE)” value for each region and year – in the case of Victoria for 2023/24, that 0.0008%-0.0009% figure mentioned earlier.
The value of the bubble chart is that it captures the distribution of individual scenarios feeding that single high-level average, showing:
- Shortage duration in hours
- Shortage “depth” – shortfall in modelled supply (AEMO show this as a percentage of average system load on the vertical axis – I’ve overlaid approximate equivalents in megawatts based on average Victorian load of 4,500 MW)
- Probabilities for each combination of duration and depth (the proportion of individual scenarios yielding that outcome, shown via the size of each bubble)
While individual distribution customers each year experience a wide range of local outage outcomes which get wrapped up into an industry-wide historical figure in the AER infographic, just one supply reliability scenario will eventuate, lying somewhere (we hope) in the space of thousands modelled by AEMO. The AER values are averages of actual outcomes across customers and networks; the AEMO reliability measure is an average across modelled future scenarios.
The first obvious result in the AEMO chart is that the largest number of scenarios – corresponding to a probability of 75% – see no supply shortfalls. In other words, the modelled “loss of load probability” (LoLP) for 2023/24 is one in four for Victoria.
As AEMO observes, amongst the 25% of scenarios that do see supply shortfalls, the majority might land somewhere between 1 and 11 hours in duration (at the long end, these are probably scenarios with shortfalls on multiple days arising from heatwaves and extended generator breakdowns) and with shortfall amounts of up to around 500 MW (about 11% of average system demand). Elsewhere AEMO unsurprisingly note that these shortfall scenarios are much more likely if this summer turns out hotter than usual: under one in ten year conditions for summer maximum demand, the LoLP rises from 25% to nearly 75%.
But how might any supply shortfalls that eventuate actually play out for individual customers? Might some unlucky campers be off for 11 hours straight, or might all we Victorians somehow have 10% carved off our supply?
Rolling on
No and no. First of all, AEMO is very likely to have some short-term lines of defence in place against involuntary customer load shedding. These include so-called RERT (or “interim reliability reserve”) resources which may be contracted on various timeframes to supplement electricity market supply with non-market sources. Under the market rules these potential sources are not modelled in AEMO’s reliability assessments, but may be deployed to deal with actual shortfall threats if they eventuate.
If these are insufficient to close a supply gap that emerges in real time, AEMO may have to resort to rolling controlled load shedding of the kind last seen in Victoria in January 2019. The reason it’s called “rolling” and “controlled” is that AEMO, state governments and network companies work through a schedule of distribution-level interruptions with successive blocks of customers in different areas (with total load in megawatts corresponding approximately to the shortfall depth) losing supply for around 1-2 hours while the shortfall persists. So even where an event extends for longer duration, individual customers shouldn’t expect an outcome too much worse than one where the proverbial possum chose the wrong shortcut.
Afterword
In case any of the above appears slightly glib or to downplay the overall message from the ESOO: that’s not the intention. Forthcoming closures of ageing legacy power stations, and lack of coordination with, or delays to construction or investment in, new supply, storage, and transmission capability are obviously a real threat to medium and longer term industry performance, and need immediate attention on multiple fronts. That should be the fundamental takeout from the ESOO’s publication. Focus on what’s necessary to address these challenges isn’t helped by shrill, uninformed, and opportunistic exaggeration of the near-term reliability risks.
=================================================================================================
About our Guest Author
 |
Allan O’Neil has worked in Australia’s wholesale energy markets since their creation in the mid-1990’s, in trading, risk management, forecasting and analytical roles with major NEM electricity and gas retail and generation companies.
He is now an independent energy markets consultant, working with clients on projects across a spectrum of wholesale, retail, electricity and gas issues. You can view Allan’s LinkedIn profile here. Allan will be occasionally reviewing market events here on WattClarity Allan has also begun providing an on-site educational service covering how spot prices are set in the NEM, and other important aspects of the physical electricity market – further details here. |
While I agree with your sentiment that the reactions are over the top, the fact of the matter is that we rarely if ever had generation shortfalls before the ramp up of renewables.
If the energy market is unable to meet the demand from customers, then the energy grid is not meeting its core requirement and we should be reconsidering a new plan to ensure generation supply can meet demand.
Saying it’s okay because we will just shut down large energy users is a bandaid solution. We need chemotherapy to stop the spread of the cancer through the NEM.