We wrote earlier today about ‘Case Study of Friday 8th Dec 2023 (big gyrations in Aggregate Scheduled Target)’. That’s one of the interesting days that have emerged in our analysis of of Aggregate Scheduled Target (i.e. AggSchedTarget):
1) As part of the number crunching for GenInsights Quarterly Updates for 2023 Q4 … following on from GenInsights21 a couple years ago now;
2) As the best metric to trend and understand as an indication of the emerging requirements for different types of firming capacity, as the coal units progressively close.
So here is another…
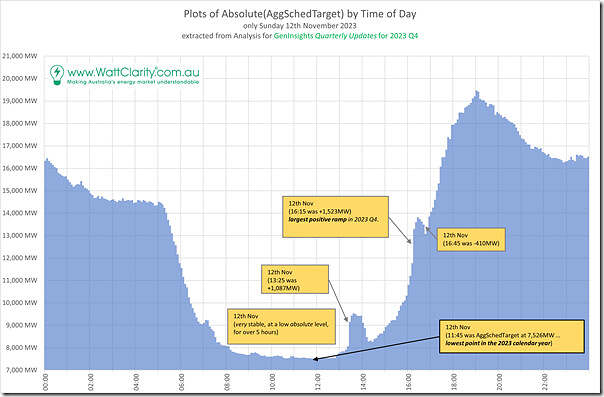
Absolute AggSchedTarget through Sunday 12th Nov 2023
In this first chart we trend the absolute levels of ‘Aggregate Scheduled Target’ (on a NEM-wide basis) for all 288 dispatch intervals on Sunday 12th November 2023:
For a little over 5 hours on the day (62 dispatch intervals) the AggSchedTarget was below 8,000MW … including the lowest point in the year (7,526MW at 11:45 … NEM time)
This low point was over 1,000MW lower than the lowest point in calendar 2022 … which we can see in terms of the longer-term trend of decline in daily minimum points for AggSchedTarget in this lengthy article from mid 2023.
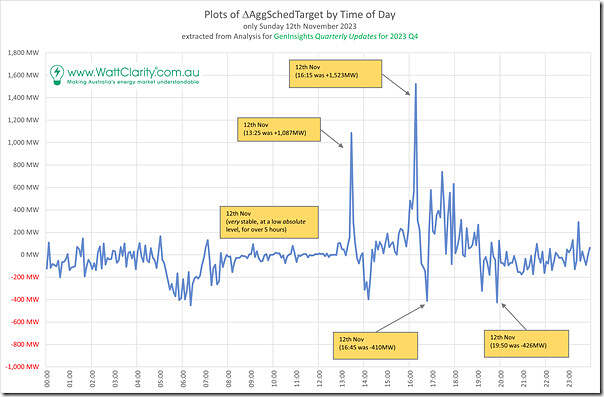
Some large extremes of ΔAggSchedTarget
Superimposed on top of the very smooth ‘duck curve’ shape for AggSchedTarget above are two pronounced spikes through the afternoon, which we can see here in more detail when we trend ΔAggSchedTarget:
I’ve not explored any further at this point, but it’s important for readers to remember that these sharp ramps might be due to a combination of different factors such as:
1) Fluctuations in ‘Underlying Demand’ for reasons not explored; coupled with
2) Sharp fluctuations in yield from rooftop PV (again not yet explored to see if they occurred – remembering AEMO’s estimates are half-hourly only so might not be detailed enough to see); coupled with
3) Sharp fluctuations in yield from Semi-Scheduled units – which might be due to:
(a) variations in the underlying energy resource; and/or
(b) curtailment (such as Dan looked at for the whole of 2023 using the GSD2023), being driven by either:
i. Network congestion; or
ii. Economic drivers.
All of the above are possibilities…


Leave a comment