——————
* rooftop PV is a dominant factor, though there are others … such as the ongoing need for ‘Keeping the Lights on Services’ (which Large-Scale VRE largely does not supply).
——————
Earlier on Tuesday 5th December 2023 we delivered an Executive Briefing to one of our clients with respect to GenInsights Quarterly Updates for 2023 Q3 … after which we publicised more broadly about the release of this report here.
It’s a very broad piece of analysis, and we occasionally choose to share parts of the analysis more broadly with readers here on WattClarity.
(A) Rooftop PV is killing returns for Large-Scale VRE
A few weeks back we noted how the Update for 2023 Q3 was extended further by analysis of Aggregate % VRE on a NEM-wide basis through the quarter … with Mon 3rd and Tue 4th July 2023 rating particular mention (the first part of an evolving Case Study of that important event).
One other thing that jumped out at me with respect to % VRE was contained within the individual unit statistics in Appendix 3 was the extremely low level of VWA Price (for almost all large-scale VRE units) in comparison to the TWA Price for the corresponding region.
(A1) Understanding the measures
Starting with the GSD2019 some years ago now (and soon to be updated for the GSD2023) we included many core metrics for measuring performance of all types of DUIDs across the NEM. Three of them are worth highlighting here:
1) The ‘TWA Price’ is the simple time-weighted average price for a given region over a given time period, such as for 2023 Q3:
(a) which is (by its very nature) not unit-specific,
(b) but does reflect the final value of a flat futures contract for the same period (so is relevant to each unit in relation to their hedging).
2) The ‘VWA Price’ is the unit-specific volume-weighted average price seen by that unit for its generation shape
(a) … but note that this does not take MLF into account
(b) to enable comparison between units
3) The ‘VWA Revenue’ takes account of the above, and also the MLF for the unit over that period.
(A2) Performance for Large Solar units
In each Quarterly Update we’ve been collating VWA Prices for all large-scale VRE units.
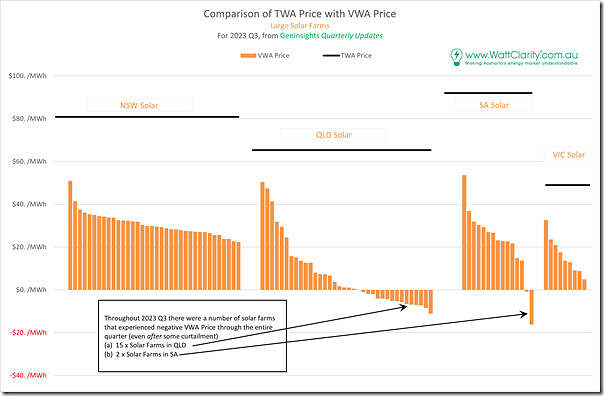
Referencing 2023 Q3, here’s a comparison of VWA Prices for all Solar Farms sorted by Region and compared to the TWA Price in that particular region:
Specific DUID details are removed in this chart, as that’s not the particular focus (though obviously with your own copy of the report you could see the specifics). A few things jump out, including:
1) Every single Large Solar Farm has a VWA price under the TWA Price;
2) Indeed the vast majority of Large Solar Farms see VWA Prices under half the TWA Price for that region over the same period (2023 Q3);
3) Furthermore, a number of units in QLD and SA experienced negative VWA Prices through the quarter – which means:
(a) They would only be above water due to LGC Revenues; and
(b) That’s even after a level of low price induced curtailment.
(c) Noting that where exactly the pain on the negative VWA Price lands would depend on hedging structure, which is different for different units.
This analysis is a timely reminder:
1) That the ‘Solar Correlation Penalty’ is one of the increasing challenges in trying to accelerate this energy transition;
2) … and also of why Capacity Factor is an increasingly simplistic way to compare solar farm performance!
(A3) Performance for Wind units
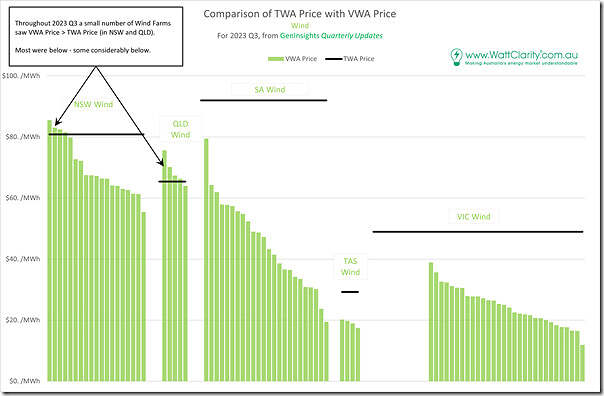
The situation is not-quite-as-dire (but still not pretty) for Wind Farms across the NEM …
We see:
1) There’s a couple of wind farms in NSW (and also in QLD) that saw VWA Price above the TWA Price … at least for 2023 Q3:
(a) The result for QLD was as I was expecting, given how solar-driven is the price shape in the region;
(b) The result for NSW was a bit more of a surprise
i. … and one we might delve into later in a specific Case Study that would be added in here
ii. If we find time to do that, we might actually name those few DUIDs as well!
2) For many DUIDs, the VWA Price is not under half of the TWA Price
… so different to the situation for Large Solar
3) But the results for SA and VIC regions still show considerable challenges.
… because the ‘Wind Correlation Penalty’ is so much stronger in those regions.
(B) Not everyone shares the same view…
Readers will note that I see challenges in the way in which we’ve been incentivising the development of ‘Anytime/Anywhere Energy’ in the NEM.
… on top of which there are additional challenges (such as to do with invisibility, forecastability and controllability) with respect to rooftop PV.
Some share my concerns.
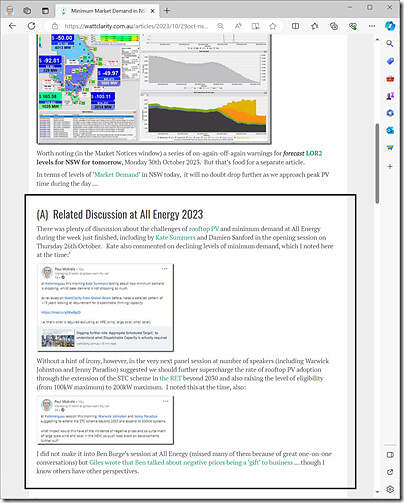
But not everyone. The All Energy conference was a little over a month ago now – following from which I’ve already shared thoughts about the distinctly different views expressed by various participants at the conference … such as what to do with incentives for small-scale rooftop PV specifically (and DER in more general terms):
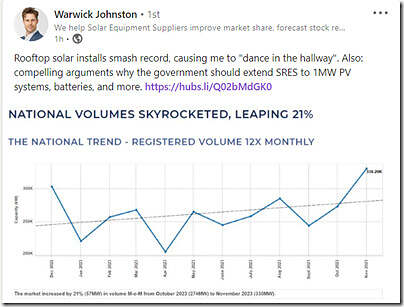
So it was with particular interest that I saw this thought here by Warwick Johnston of SunWiz shared on LinkedIn on Monday 4th December 2023:
Note in particular that Jenny was suggesting doubling the eligibility of SRES from 100kW to 200kW … but Warwick above is suggesting going to 1,000kW.
1) Wow!
2) If this happened, I would see problems ahead…
(C) Unit-level stats for calendar 2023 in the GSD2023
A useful segue, to remind readers that we’re now into the last month of 2023, so will shortly be drawing the line on the year-that-was to start the number crunching exercise leading to the release of the Generator Statistical Digest 2023:
1) Which will contain these types of stats for all* units across the NEM that were operational in the energy market for some period through 2023;
* i.e. ‘all units’ = not just VRE
2) For an envisaged release in early February 2024.
You can pre-order your copy today using this Order Form for GSD2023.


Timely reminder that market pricing is supposed to be an investment signal as well as a dispatch signal.
The mistakes baked into our critical electricity system will require significant effort (and guts) to undo.
In SA there are only 4 solar farms that are 100+ MW. The others are owned by SA Water, the largest of which is 25 MW.
Utility solar was and should be the third leg of the stool in the NEM> there is no way that utility solar can be generated and delivered, billed etc for the same cost as rooftop solar.
In effect the battle will be for utility solar + a lot of storage say 60-70% R MW/250% R MWh (R being the rated power) vs wind with 15-20% R/.5-1 R MWh storage for the remaining 50% of the energy after behind the meter generation and storage, hydro and waste to energy take the other 50%
It’s really the joint effect of non-price responsive rooftop PV crashing into the flexibility floor (minimum stable loading) of coal fired generation that’s driving this. With a different synchronous generation mix the issue would be less severe (unless the synchronous stuff was nuclear, in which case it would be worse).
It’s also important to understand that the Vic & SA results also reflect the endemic constraint issues on VNI not just the “wind correlation penalty”.
Thanks Allan!
Your first point was the reason for the asterisk at the top.
Good point about VIC1-NSW1, which you recently wrote about in ‘What’s happening around Wagga?’.