
On Thursday the 7th September the Bureau of Meteorology issued a severe weather warning for many parts of south-eastern Australia due to strong damaging winds and storms associated with a large low-pressure system and significant cold front.
The weather system’s front was forecast to progress across Victoria and NSW on the 7th and, in its aftermath bring a cold south-westerly air stream behind it on Friday the 8th with conditions easing on Saturday the 9th. Large differences between actual outcomes and forecasts for demand, availability, and supply in the NEM were observed on several occasions over this three-day period.
Note, in some cases the forecasts are strictly ‘projections’ but for simplicity in this article we’ll use ‘forecasts’ throughout.
GenInsights Quarterly Updates assesses predispatch forecasts at three temporal groupings
At the end of November 2023 we released GenInsights Quarterly Update for 2023 Q3.
In this report (as for preceding quarters) we identify days when forecast demand or supply targets or supply availability in the predispatch time horizon differed considerably from what resulted at the time of dispatch – using versions of a ‘Forecast Convergence’ methodology explained in principle here.
- Our reasoning in doing this, each quarter, is that these events provide a pointer towards understanding emerging or increasing challenges that are impacting predictability of the power system.
- This article presents a case study that inspects how predispatch forecasts differed from outcomes at the time of dispatch over the 7, 8 and 9 September 2023.
Related articles: Readers interested in interval-to-interval variability in aggregate unit target levels are directed to this ‘Case Study (part 1) of Aggregate Scheduled Target on Friday 8th September 2023’ which observed a significant 5-minute ramp in AggSchedTarget (+960 MW at 13:40) on the 8th September.
GenInsights Quarterly Updates assesses predispatch forecasts at three temporal groupings:
- The quarter, to compare seasonal patterns,
- The month, to compare longer-term trends, and
- The day, to identify periods of greater interest.
This case study takes those daily insights and delves further to the half-hourly level.
Operational demand differences occurred on the 8th of September 2023
We begin this case study in the middle of the (7th, 8th and 9th of September 2023) period with forecasts of operational demand. Operational demand was under forecast on the 8th of September, 2023, noting also it was well forecast on the 7th and 9th.
The following chart from GenInsights’ Appendix 2 on Grid Demand (day-by-day) captured the large differences in the 24-hours ahead forecasts for NEM-aggregate operational demand on the 8th. It also highlights the more typical difference levels on the 7th and 9th.
Source: GenInsights Quarterly Update for Q3 2023
Friday 8th September saw the widest operational demand difference range in the quarter. The 90% difference range extended above +2000 MW meaning actuals were higher than forecasts by that magnitude on at least one half-hour occasion.
The operational demand forecasts made 24 hours ahead and the actual operational demand levels over our case study period are charted below. We see the largest differences occurred among the half-hour intervals between 09:30 and 13:00 on the 8th, highlighted. Differences were positive, eclipsing 2,000 MW, representing actual operational demand higher than forecast.
Source: Global-Roam, Hosted MMS
Operational demand is impacted by rooftop PV
Was rooftop PV lower than forecast, and therefore necessitated more energy (operational demand) from the grid, driving the ‘higher-than-forecast’ operational demand?
Rooftop PV was lower than forecast. Below, we observe differences of down to -1500 MW for rooftop PV on the 8th.
Source: Global-Roam, Hosted MMS
Inspecting the mean sea-level pressure weather map, we observe the low-pressure system that the Bureau of Meteorology had issued severe weather warnings about. It was centered on Tasmania by 10 am on the 8th of September. The tight lines of pressure over Victoria imply strong west to south-westerly winds. These were pushing across Victoria and into NSW.
The position of the front, which was close to Sydney at that time, would have typically brought cloud cover and a change in wind direction from the north to the south-west. This would have involved an associated drop in temperatures as colder air behind the front came though.
Source: Bureau of Meteorology
In the satellite imagery from the 8th of September, at 10am also, we see the strong cloud band over greater Sydney associated with the low pressure front. Notably, also, is the dappled cloud entering South Australia and Victoria (covering greater Melbourne) which is usually associated with cold air and high wind-chill factors.
Source: Himawari8
When operational demand is high check temperatures
Air temperatures in NSW (Bankstown airport selected in on this occasion) saw dramatic declines around the same time operational demand and rooftop PV were varying from forecast.
The temperature decline at Bankstown began slightly earlier than the NEM-aggregate rooftop PV decline we highlighted above and was arrested and reversed soon after midday for a brief reprieve over the afternoon. During the dip, temperatures in Bankstown dropped to around 13 °C at 7am. The reprieve peaked at 19 °C at 3pm before temperatures cooled again into the evening.
It is likely this drop in temperature help drive unexpected additional levels of demand (for space-heating) and contributed to the higher-than-forecast operational demand.
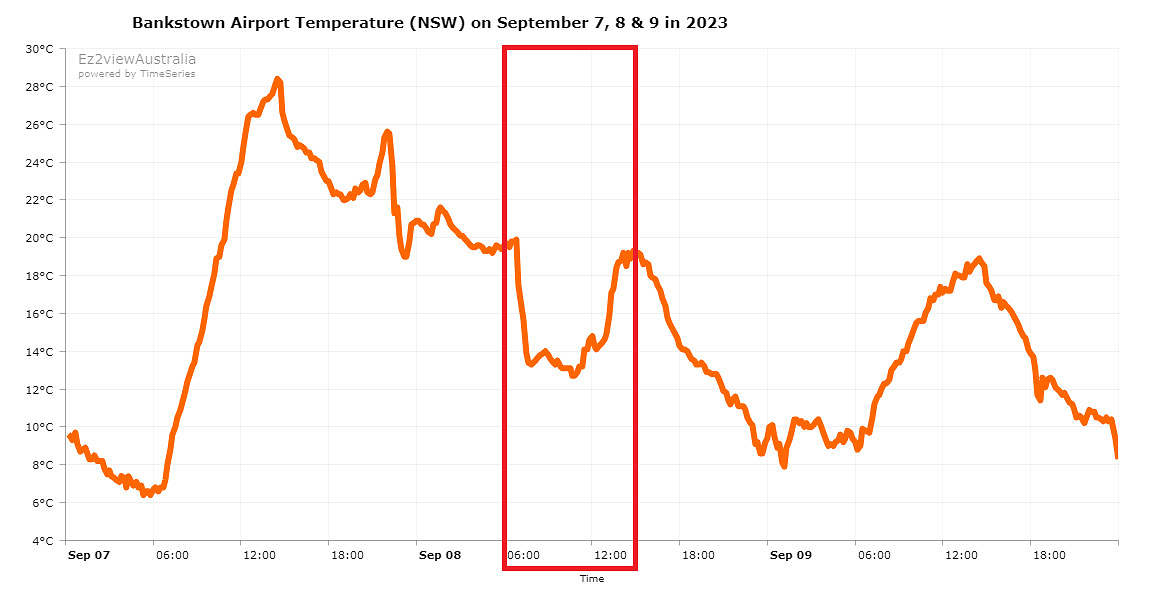
Source: ez2view, trends
Semi-Scheduled Wind Availability experienced differences on all three days
In GenInsights Quarterly Update for Q3 2023, we observed semi-scheduled wind availability varied considerably from forecast on occasions over the 7th, 8th and 9th September 2023. The following chart is annotated with three boxes that highlight key subsets of the chart:
- A dip in availability was forecast for the 7th at 16:00 but, instead, eventuated as a mild spike.
- Later, on the 7th, lower-than-forecast availability occurred in the evening and continued into the 8th until midday. The wind availability forecasts regained accuracy for the remainder of the 8th, from midday onwards.
- The severe weather system had mostly passed the continent by the 9th. Low wind availability forecasts saw negative differences in the evening of the 9th ; dispatch availability had dipped lower than 1GW below forecast levels around 18:00.
Source: Global-Roam, Hosted MMS
Aggregate wind availability differences, on the 9th, of 30% were realised on the back of low availability levels. The following mean sea-level pressure chart shows a high-pressure system had moved into South Australia and was extending to Victoria, by the evening, bringing far-lighter wind conditions to those regions than the days prior.
Source: Bureau of Meteorology
The position of a cold front or low pressure trough often drives forecast wind availability differences
Stepping back to the 7th, the mean sea-level pressure chart for 16:00 on the 7th September shows a low-pressure system and a cold front had arrived in Victoria, from South Australia.
The Bureau of Meteorology had issued a severe weather warning for many parts of south-eastern Australia due to strong damaging winds that were ahead of the front.
Source: Bureau of Meteorology
At the time of dispatch, it appears (box 1 in the semi-scheduled wind availability chart) this system brought a period of increased wind power potential, rather than a reduction, driving semi-scheduled wind availability differences-from-forecast on the 7th.
The Semi-scheduled wind availability chart, reproduced from above.
The cold front on the 7th impacted solar irradiance as far north as Queensland
Around the same time (afternoon on the 7th) as wind availability was different from forecast, semi-scheduled solar availability was below forecast having been that way for much of the day.
Cloud cover for 16:00 (4pm) on the 7th, as captured by the satellite image below, indicates how extensive and thick the cloud cover was over inland Victoria and inland NSW. Many large-scale solar farms are in these inland areas of Victoria and NSW.
Source: Himawari8
Semi-Scheduled Solar availability differences on the 7th were largest (NEM aggregate) over the three-day period we’ve inspected in this article; at largest, actual availability dipped 1,800 MW below forecast levels at half-hour period ending 15:00.
Source: Global-Roam, Hosted MMS
Semi-scheduled dispatch targets didn’t align closely with availability
Forecast and actual aggregate semi-scheduled targets, and scheduled targets are in the two figures below. Three key periods are highlighted:
- On the afternoon of the 7th, when wind availability was high and solar was low, we see aggregate semi-scheduled targets remaining in line with forecasts from 15:00. Differences were larger earlier in the afternoon at 13:00 yet didn’t concretely align with availability differences in solar or wind.
In the evening of 7th and morning of the 8th, when reduced wind availability occurred (not boxed on the chart), we don’t observe similar differences in wind dispatch targets. At the high-level (taking 04:00 on the 8th) it appears there was excess availability (6,500 MW) relative to targets (6,000 MW) such that no change to targets, from forecast, was needed to accommodate the reduced wind availability. - From 09:00 on the 8th, scheduled generator targets at dispatch diverged higher than forecast and equivalent differences in semi-scheduled targets were not seen. The difference matched, instead, the operational demand differences (discussed above) that were attributed to colder temperatures and reduced rooftop PV.
- Forecast differences in semi-scheduled generator targets are usually countered by equivalent but opposite differences for scheduled generators. This is evident on the 9th, 10:00 to 16:00 when scheduled generator targets were lower than forecast and semi-scheduled generator targets varied in the opposite direction from forecast.
Source: Global-Roam, Hosted MMS
Source: Global-Roam, Hosted MMS
For another time, perhaps?
The chart above also captures how forecasts of aggregate scheduled generator targets appear to have aimed for a consistent minimum level of 10,000 MW. The targets even appear to flatten across midday to meet that level. The reasons for this (by chance or due to minimum generation levels perhaps) remains a topic for another day!
Be the first to comment on "Case Study – Severe Weather Challenges Day-Ahead Forecasts for 7, 8, 9 September 2023"