
On Tuesday I presented at the Smart Energy Council’s Queensland Expo on the topic of utility-scale storage in Queensland. There were two prompts that led me to want to undertake some analysis into the topic:
- A recent article by David Osmond, who, after running a simulation over two years, believes that only a few hours of storage may be necessary in a highly VRE-dependent NEM; and
- Numerous news articles that broke last week reporting that Snowy 2.0’s construction costs are now estimated to be ~$12b, doubling within six months.
In this follow-on article to my presentation, I hope to provide some context about storage and explore the current market price signal for duration. Keeping with the theme of the conference, this analysis is primarily focused on Queensland, but I believe some of the key takeaways are likely to be relevant for the rest of the NEM.
The need for Megawatts and Megawatt-Hours
To begin, I’m going to assume that you, my reader, are familiar and aware of the important distinction between a megawatt and a megawatt-hour. You are? Great. But just to be sure.. this is just a gentle reminder that a megawatt is a rate of production (or consumption). Whilst a megawatt-hour is a volume over some period of time, not necessarily just an hour.
From a brief literature review, there seems to be some consensus that eventually a large number of megawatts of firming will be needed – even potentially somewhere in the vicinity of whatever peak demand may be – to cater for short periods where solar and wind generation are bound to be exceptionally low. This firming is likely to be supplied by forms of stored energy… which could be batteries, pumped hydro, solar thermal with storage, compressed air storage or even gas turbines drawing on stored energy in gas pipelines with diesel backup.
Where there has been much less consensus is in regards to how many megawatt-hours of storage would be needed in some future VRE-dependent grid. There has been a number of well-known independent studies that have been conducted on the topic. One of these long-term studies by Andy Boston, Geoff, and Nathan Bongers, concluded that we may need as many as x10 Snowy 2.0s to manage seasons of low wind and solar. Joel Gilmore and a small team from Griffith are slightly more bearish on duration, modelling that simulated VRE energy did not fall below 75% of expected production over a two week period when backcasted against historical weather data. On the other end of the spectrum, David Osmond’s two year simulation concludes that only 5 hours of storage (and a tiny amount of dispatchable generation) may be necessary.
We need to take all of these models with a dose of humility because:
- There are many highly dynamic variables and feedback loops that are hard to accurately represent in a model of this nature – things such as transmission flows, evolving demand profiles, changing weather patterns, etc.
- Wind and solar droughts are High-Impact Low-Probability events, so need to be considered over very long periods (i.e. numerous weather scenarios) in order to gain a more accurate picture of the risk involved.
The state of storage in QLD
So where are we now?
On the left of the image below we can see all battery projects currently ‘in play’ in Queensland. At last count, there are seven that are either operational or under construction. In addition, there are about thirty more that are proposed, but all have varying degrees of certainty in terms of proceeding. You can see here that many of these battery projects are clustered around the two hour mark, with very few beyond four hours.
On the right is the same chart but for pumped hydro storage projects in Queensland. Wivenhoe is the only current operational plant in the region, but will eventually be joined by the Kidston project in North Queensland currently under construction. There are a handful of proposed projects (some of them more publicised than others) but all are still some ways away from construction.
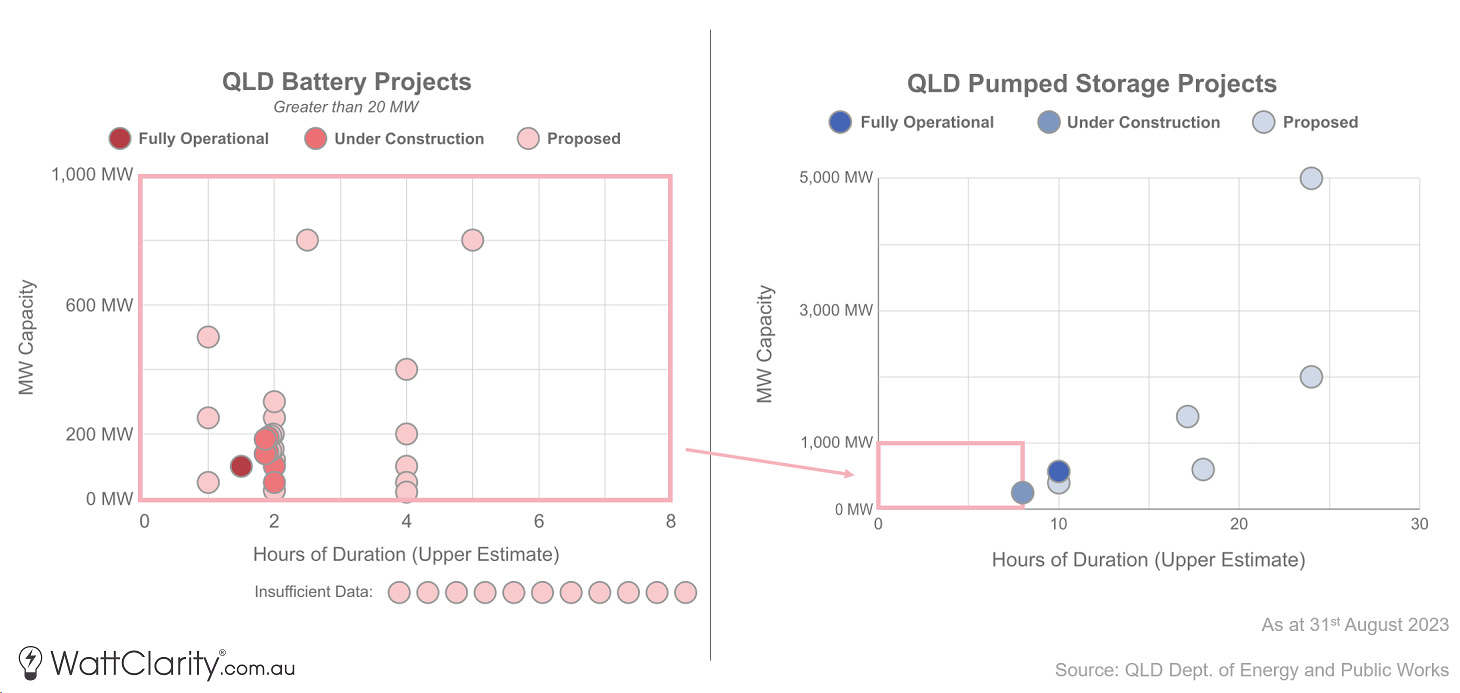
Storage projects currently operational, under construction, or proposed in Queensland.
Source: QLD Department of Energy and Public Works
An emerging arbitrage opportunity
Now there are a lot of smart ways that a storage device can add value and earn revenue. As you are probably aware, the vast majority of these projects currently being developed intend to target the frequency control markets as a key source of revenue. As these markets aren’t infinitely deep, it is likely that energy arbitrage will become an increasingly important concept as we move through the transition.
As I noted in my summary of Q2 price trends in July, there are increasing incidences of more extreme prices at both the high and low (even negative) end. Intra-day price spreads appear to be widening for a host of reasons, but primarily because of:
- Decreasing middle of the day grid demand (with the rise of behind-the-meter rooftop solar).
- Increasing low-marginal-cost generation from utility-scale solar in the middle of the day.
- Low-marginal cost wind generation typically not ramping up until evening periods.
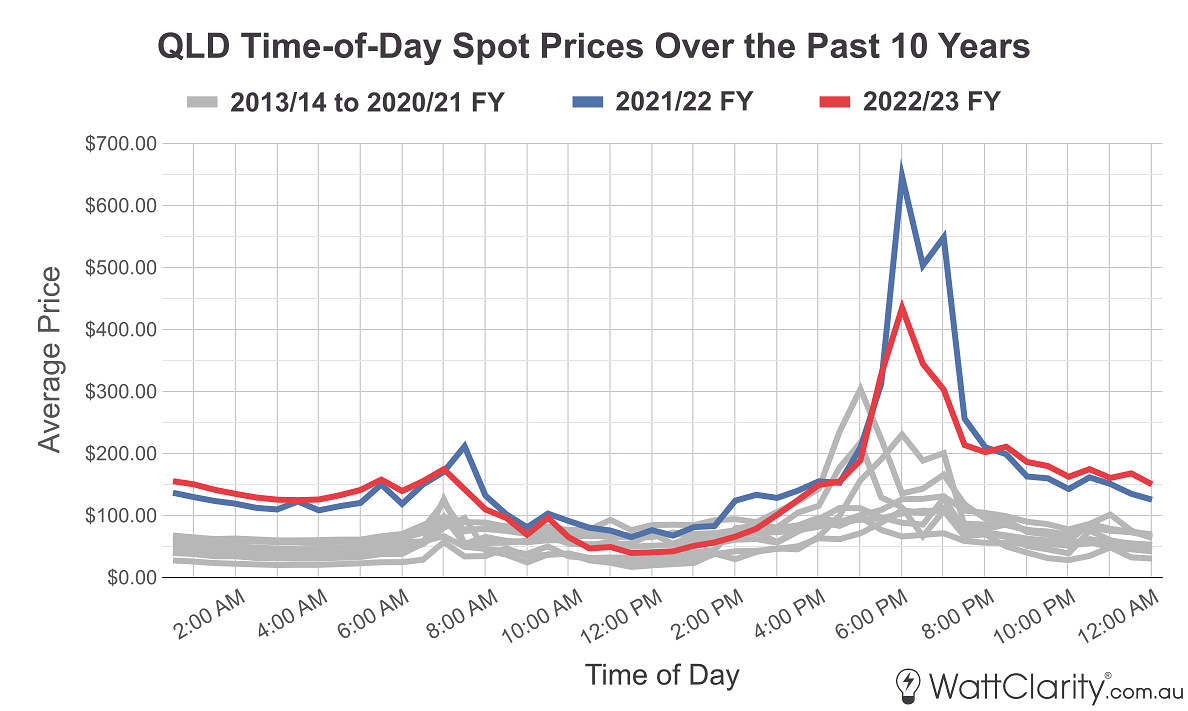
Average time-of-day prices in QLD for the past two financial years, compared to the previous eight.
Source: NEMreview
From the chart above you can see quite clearly that average morning and early evening price peaks in QLD have been becoming more pronounced – which is making for a more attractive arbitrage opportunity for storage.
But not every day in the NEM is the same…
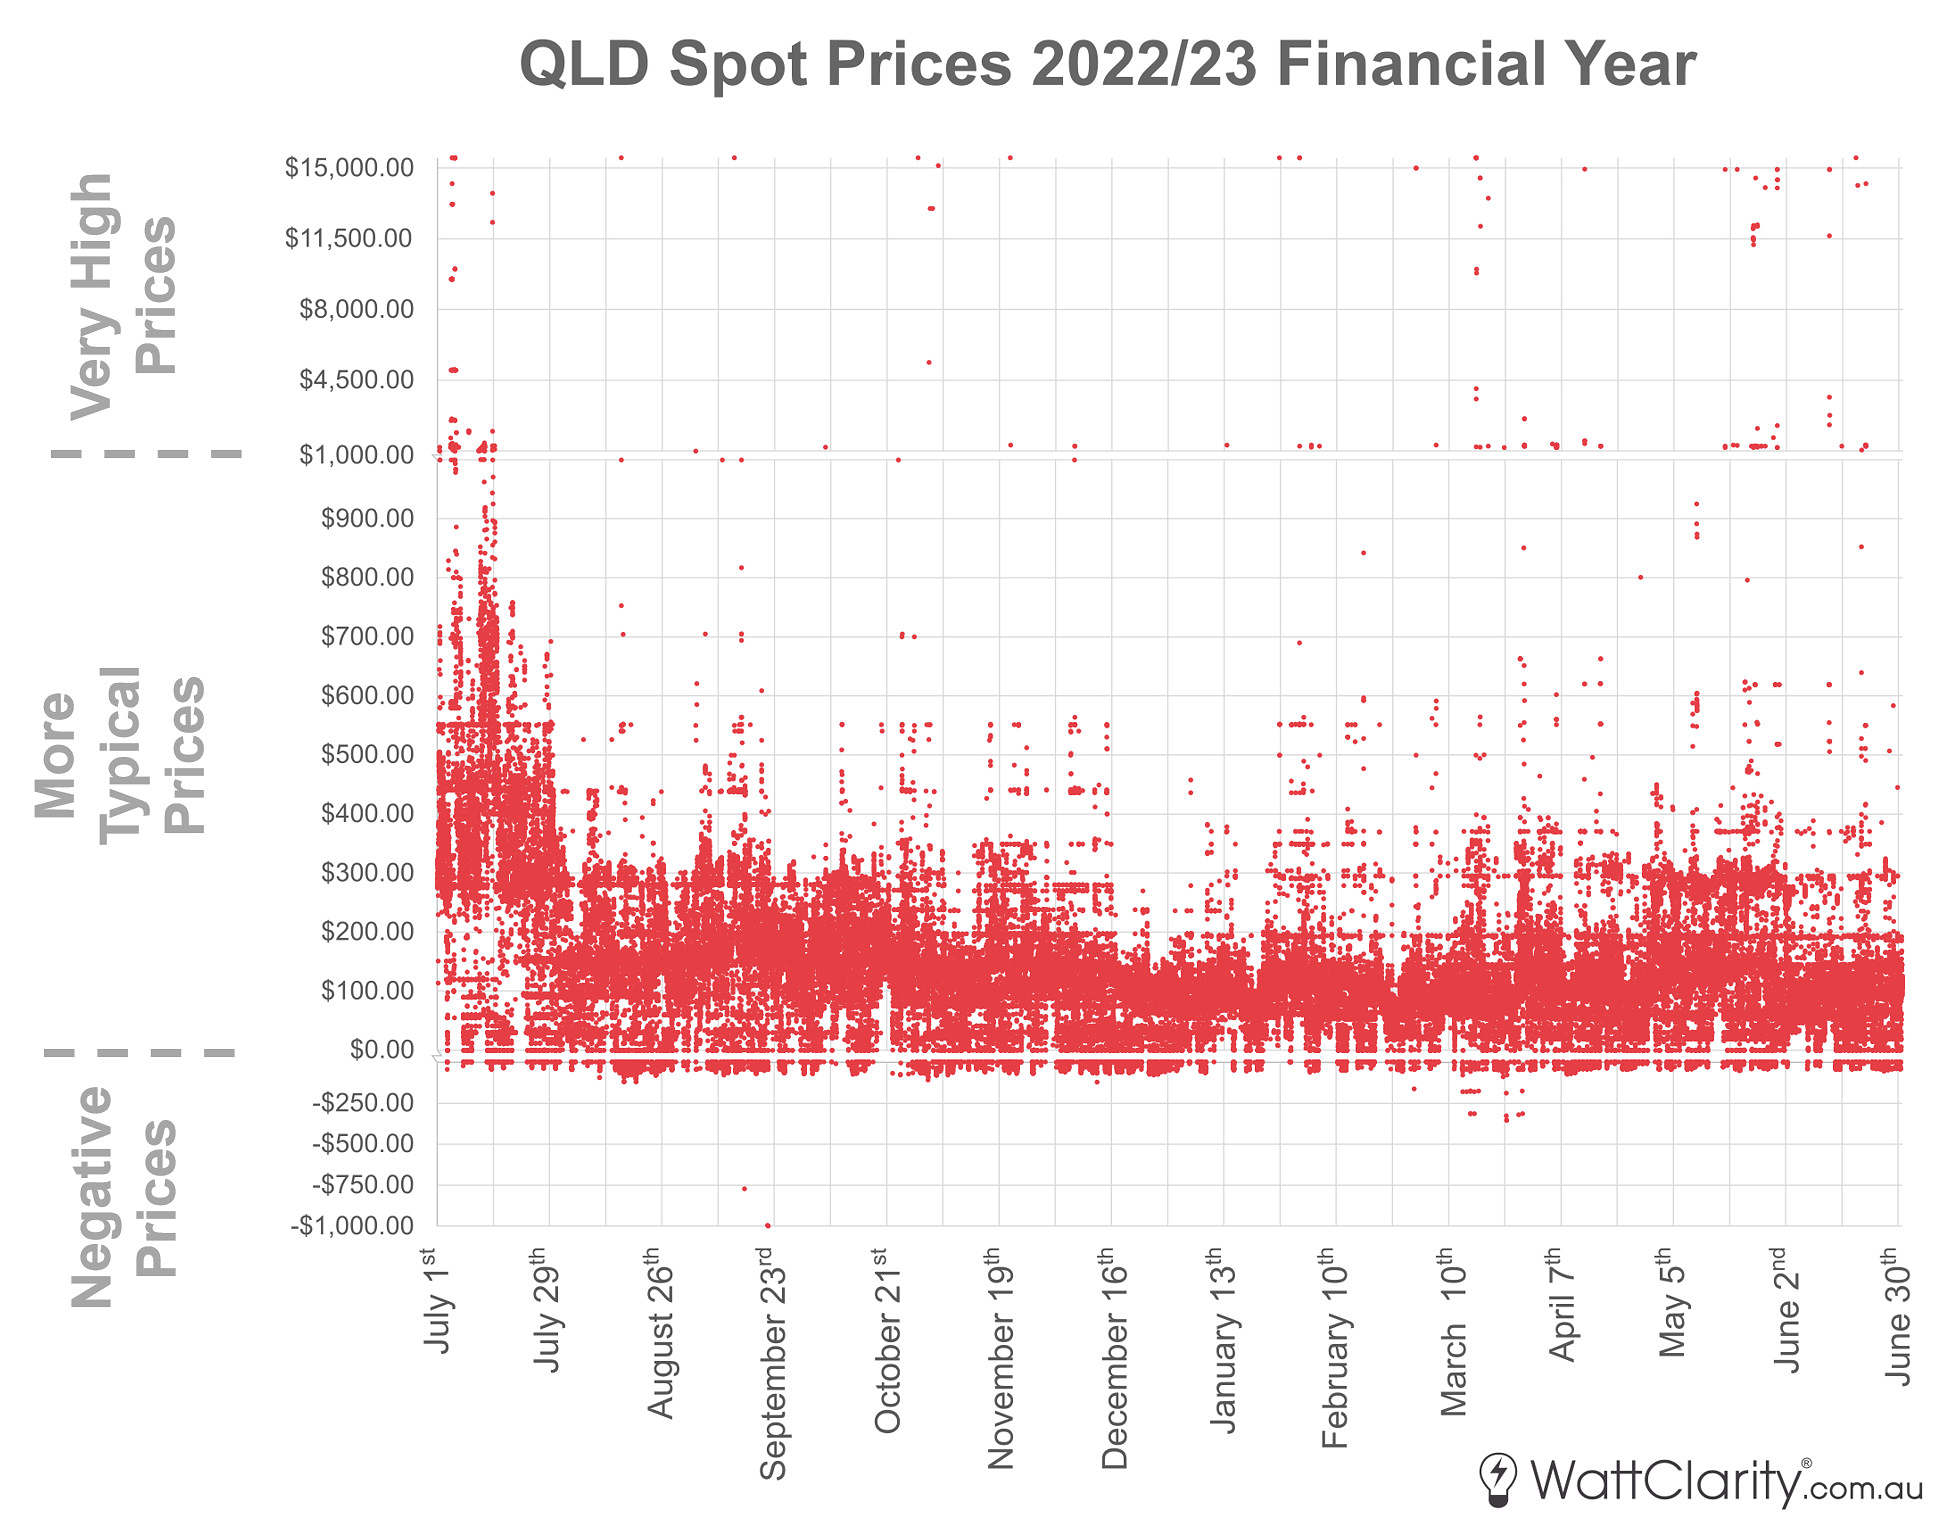
The underlying volatility within the NEM. Note: the y-axis on the chart is on three different scales.
Source: NEMreview
In fact, the NEM is one of the most volatile commodity markets in the world – so averages usually hide the underlying extremes. And because prices are volatile in the short and long term, that means that different price spreads for varying lengths of time exist.
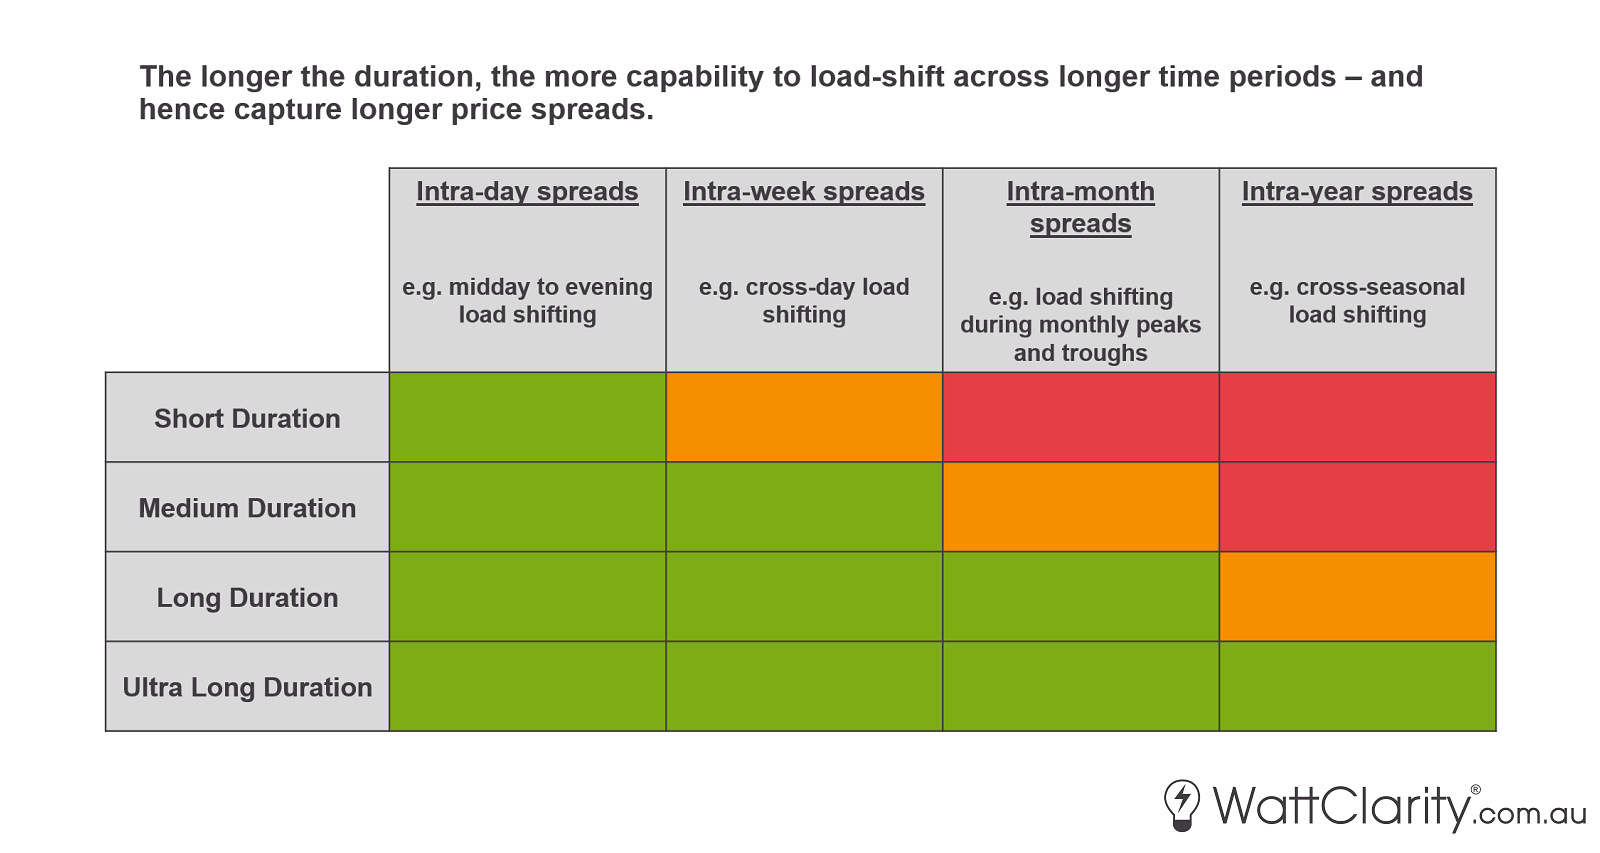
In terms of arbitrage, short-duration batteries are quite capable of buying during those daily troughs and selling during those daily peaks. And effectively these batteries need to cycle almost every day to justify the initial investment.
But more duration adds more cycle flexibility. For instance, a large pumped hydro plant in comparison is much more capable of load-shifting across days, weeks, or even months to take advantage of what may be a bigger spread.
A thought experiment to interpret the price signal for duration
In May, RenewEconomy’s David Leitch published some analysis of diurnal (i.e. daily) spreads available for batteries that may be of 2, 4 or 8 hours of duration.
But because of the effect mentioned above, myself and the team at Global-Roam were more interested in examining the element of time against duration – in order to understand how strong or weak the current market price signal is.
As a thought experiment, I made a simple spreadsheet model to understand the relative value of being able to capture longer price spreads.
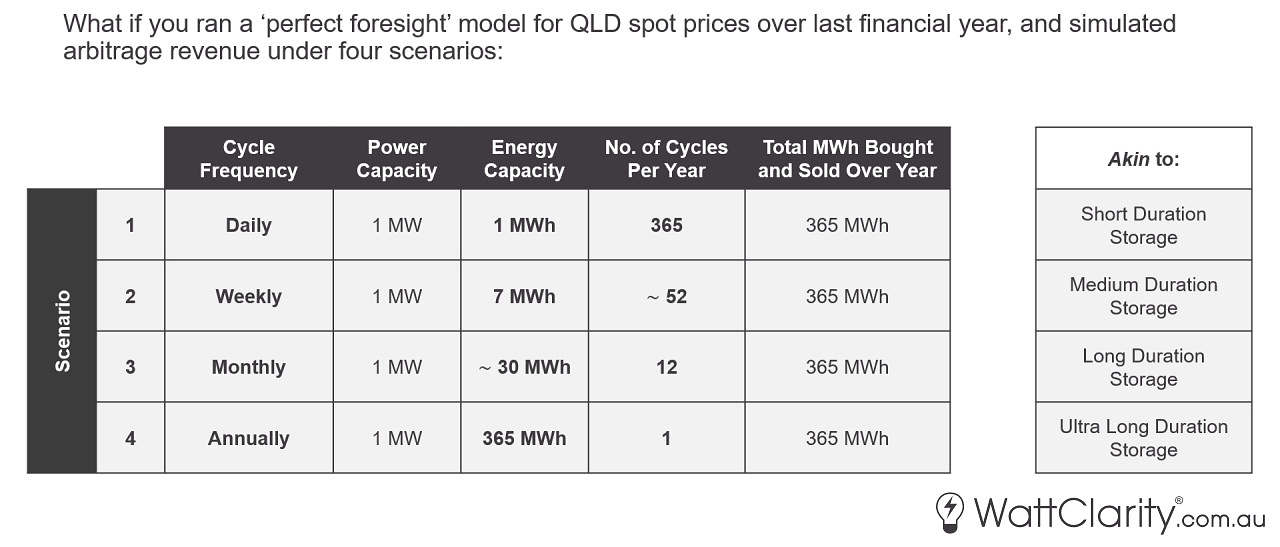
I took every single spot price in QLD from last financial year (i.e. on a 5-minute basis) and ran four simulations on that data – a summary of each of these scenarios is in the image above. Essentially you can think of the scenarios as: how much revenue would you have generated if you bought and sold 1MWh optimally each day 365 times? versus; how much revenue you would have generated if you bought and sold 7MWh optimally each week 52 times? and so on and so forth.
I purposely added in the assumption that you had perfect foresight in each scenario and thus could optimise your revenue perfectly. All scenarios were capped at a 1MW power limit – and that was effectively my constant – so that I could try to understand the relative value of extra duration.
The scenarios very loosely resemble storage devices with increasing amounts of duration, but I intentionally ignored state of charge, round-trip losses, the effect on price setting, etc. – things that matter a lot in the real world… but are not important when you only want to look at price spreads and arbitrage strategies alone as I am doing here. So this is not a sophisticated model by any means, but hopefully, a useful way to problem-solve by simplification.
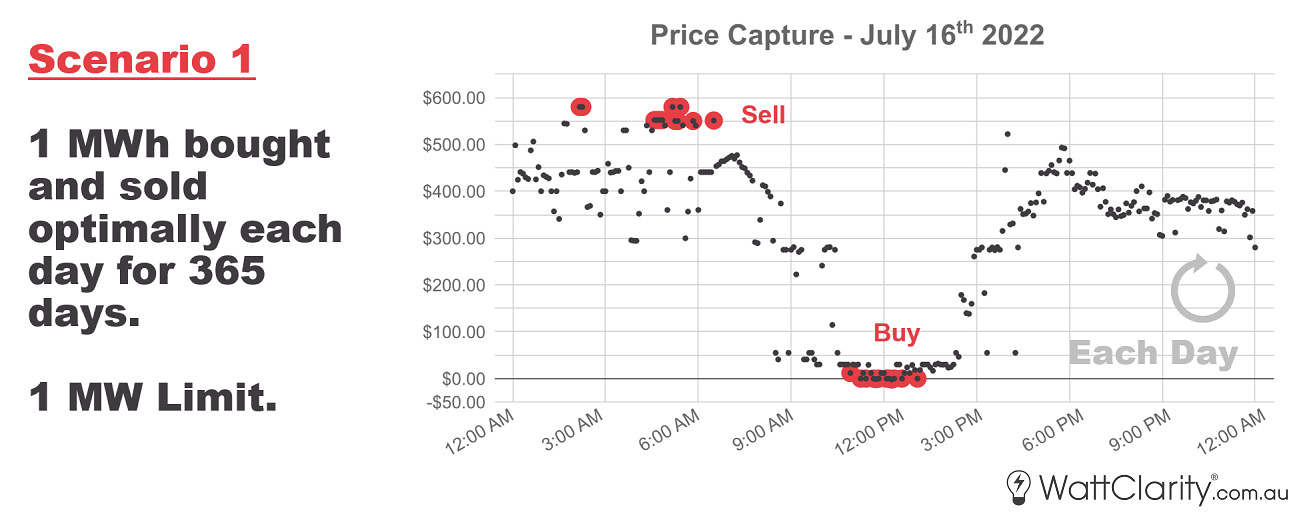
The chart represents a sample of the prices that were simulated to be captured in Scenario 1 on a given day. It optimised on a daily cycle each day of the financial year.
The chart above is a sample of the output from Scenario 1 on a given day. This is for July 16th 2022 – we can see that it sold its 1MWh in the early morning, and bought it back in the middle of the day, and then it was done for the day. And it did something similar the next day.
This isn’t that far removed from how a battery might operate in the NEM if it was only focused on arbitrage. Here you should begin to get the idea that, in relative terms, it’s not too hard to predict the general shape of prices over a day, on most days.
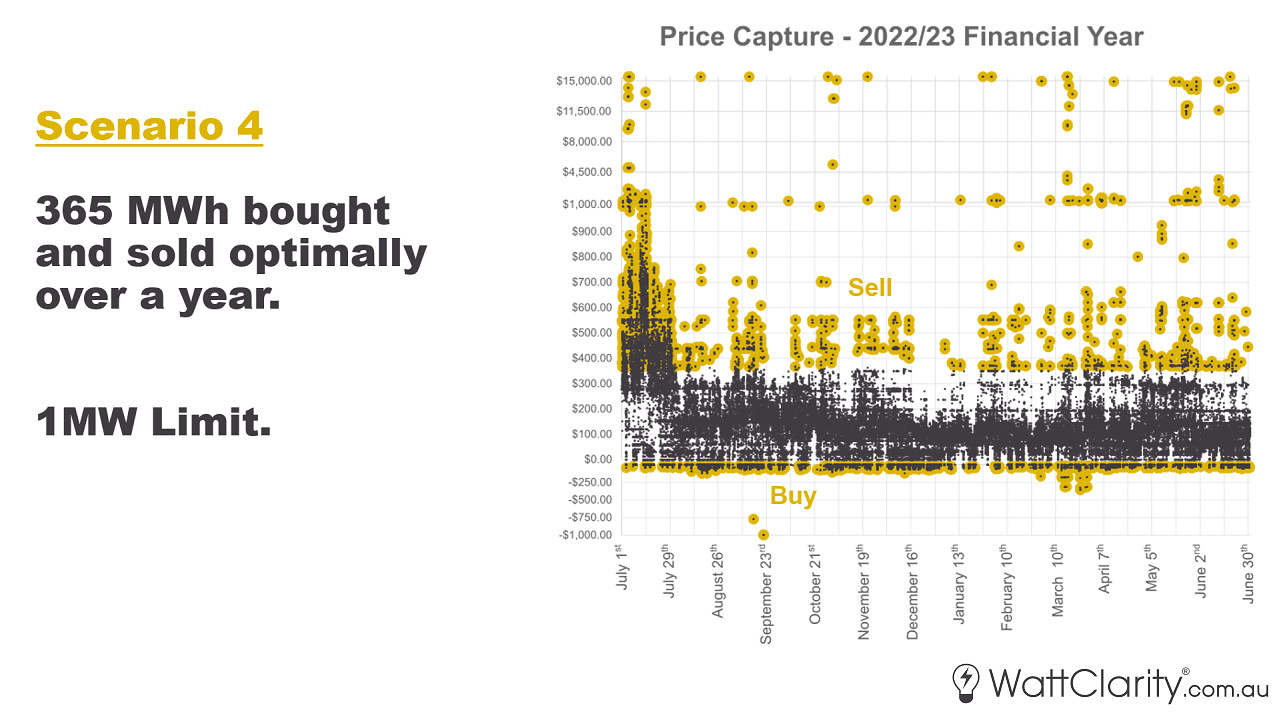
A graphic showing all the prices that were captured in Scenario 4.
In comparison, the image above shows the simulated price capture for Scenario 4. This was the scenario where you could optimise your whole volume over a full year, and therefore it wasn’t constrained to cycling daily, weekly or monthly.
The main thing to note here is the randomness of all the price spikes that were captured. As I mentioned earlier, these simulations assume perfect foresight – something that is far from reality. From comparing the last two images, perhaps you can begin to get an idea of how unpredictability has increased with cycling length.
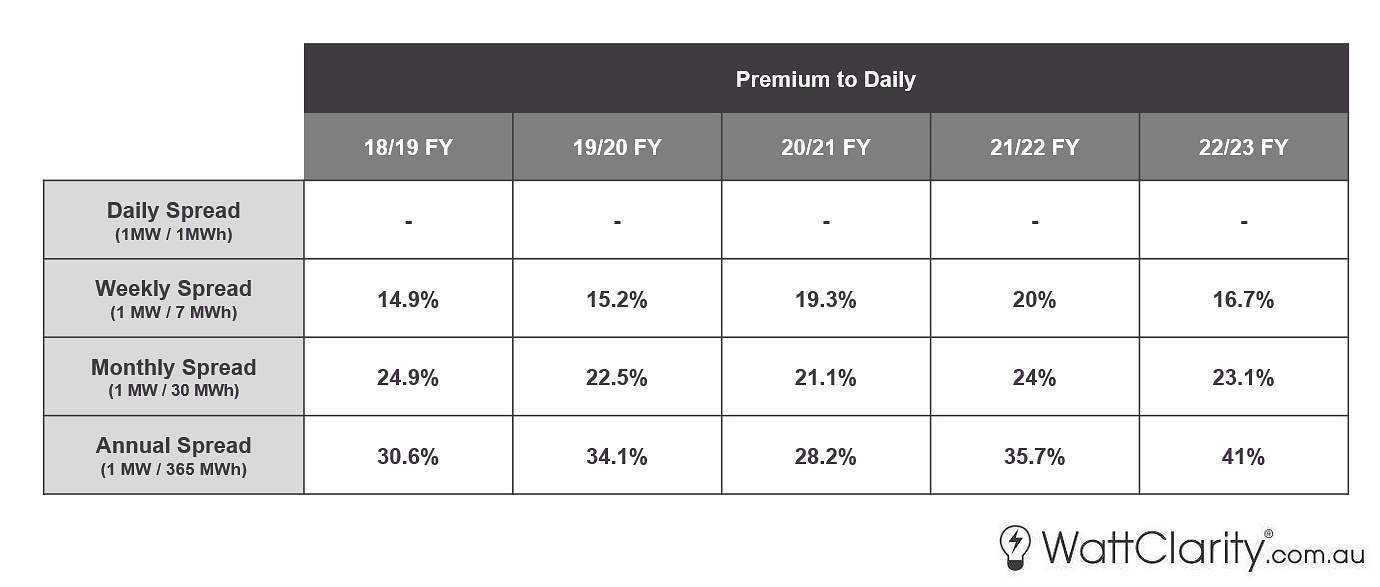
Below is the final results from the four simulations.
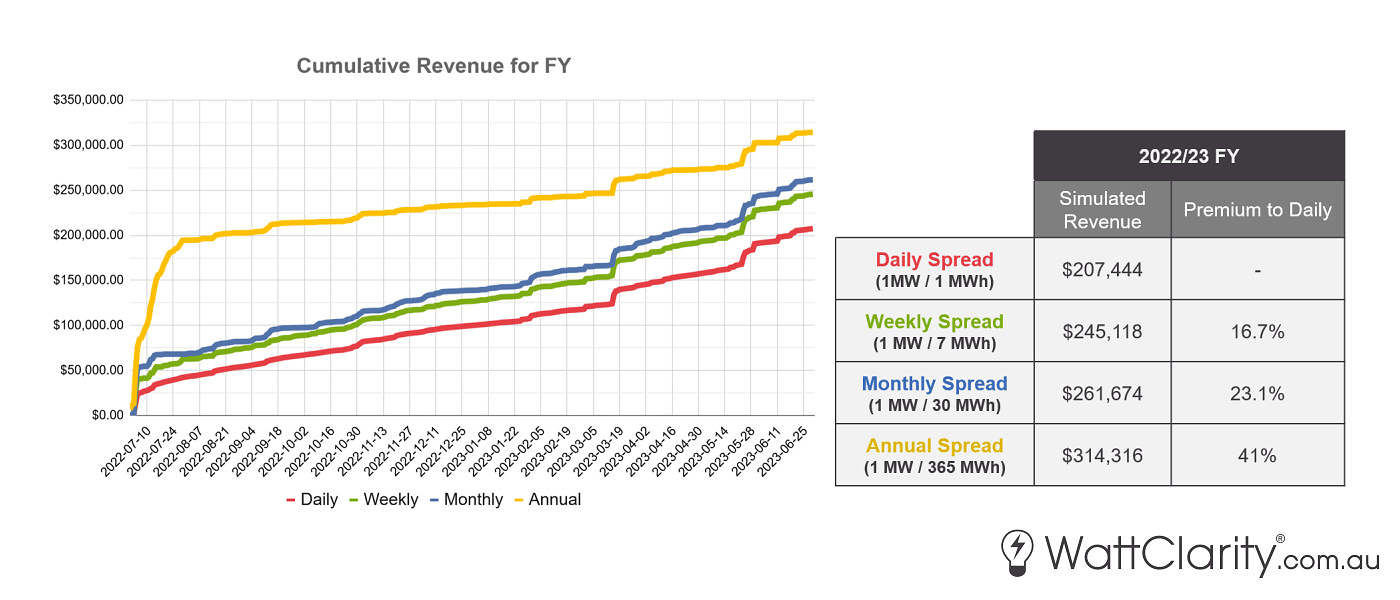
Final results from the simulations of the four scenarios within my ‘thought experiment’.
You might have seen in a previous chart that the annual cycle scenario sold most of its volume in July, so it got off to a quicker start than the rest, but by the end of the financial year all four outcomes somewhat converged.
The ‘simulated revenue’ numbers in the table above aren’t all that significant because of my simplifying assumptions. But the ‘premium-to-daily’ percentage is more what I wanted to get out of this analysis. It is my attempt at trying to quantify the relative returns in a best-case scenario for different arbitrage strategies.
So whilst each scenario received a higher premium than the one before it, it’s another question about whether this premium justifies additional capital costs. If we assume that this premium percentage is somewhere in the ballpark of being accurate – I don’t think that the additional construction cost of adding 364 more hours of duration to your storage project would come anywhere close to being covered by a 41% market premium.
Obviously cycling by financial year and running simulations based on calendar months, etc. is fairly arbitrary. In order to gain a slightly bigger picture, I reran the simulations using four more financial years worth of data to expand the sample size. As you can see below, the results did not diverge substantially.
Rerunning the same simulations over the past five financial years. Note: Percentages are based on dispatch prices both pre and post 5-minute settlement.
Key Takeaways
This analysis is largely just a thought experiment so there are many simplifications, but hopefully, there are still some important lessons that can be learned:
- Solar and wind droughts are High-Impact Low-Probability (HILP) events. It has always been a challenge for financial markets to properly price in the risk associated with these, giving rise to Nassim Nicholas Taleb’s ‘black swan’ theory.
- It appears that there are very sharp diminishing returns for longer duration storage under current market arrangements. And that’s even with perfect foresight. So in lieu of mechanisms or incentives or forms of financial security outside of the market, I believe that currently it is very hard to justify this level of risk from a private investment standpoint.
- The degree of foresight needed to take advantage of spreads increases with cycling length. Intra-day price spreads most of the time are relatively predictable – but cross-seasonal price spreads are really tricky to pre-plan (and therefore manage the risk involved).
This “game play” of energy battery arbitrage is pure speculation at this point since it is not happening right now. You are only guessing what battery traders may be capable of doing in the future since we are seeing very little of it now in the other NEM regions. The current fleet of operational batteries are still playing the FCAS game even as the revenue pool shrinks further and further with each new battery commissioning. Furthermore, we can safely say at this point that battery “energy contributions” in Queensland are nil.
To say that intra-day arbitrage is easier to manage than very long-duration arbitrage (i.e. up to a year in duration) is not necessarily correct either. A battery operator has a smaller margin of error when trading on an intra-day scale since their arbitrage period is spread across fewer 5-minute dispatch intervals. If a battery trader forecasts low prices in the next dispatch interval and it happens to be much higher, then they have purchased electricity at a higher price and reduced their arbitrage revenue significantly.
On a yearly scale, we actually do know what months give us lower prices and which months give us higher prices. E.g. it is no mystery that summer demand is higher and prices are higher as a result.
The energy (or MWh) of these batteries are tiny which makes arbitrage difficult on the “sell side” and this is compounded by smaller time frames (e.g. intraday arbitrage). I.e. how do you decide when to sell your miniscule volume of energy that you bought earlier in the day? Do you sell it all during the evening shoulder period when prices are sensitive and risk selling when actual prices are too low? Or do you wait until demand hits its absolute peak later on? My point is that the small energy of batteries makes it harder to sell during the forecast high price periods.
I hate to burst your bubble, but energy arbitrage on a short-scale only works if you can predict the market perfectly. And this is obviously not the case. And this leads to a sobering conclusion with batteries. Batteries are only capable of arbitrage over the short-term which has all these major aforementioned problems.
There is a mental confusion in the terminology. There is no need for a one hour battery to discharge over an hour, it can run at a quarter power for four hours or full power for one 5 minute bidding cycle and then ramp down over successive cycles over 6-8 hours if prices fall.
It can sometimes charge at night even buying power at a positive price that is still less than morning peak. It won’t have two full cycles /day but it may have 1.2-1.5.
The beauty of batteries vs pumped hydro is that it is easy to increase the duration as demand for longer duration increases and as the cost of storage falls. Pumped hydro is pretty much stuck once it is built.
If for the foreseeable future we retain the existing gas and hydro fleets and triple solar and wind output, the peak output from new backup/storage will be around 10 GW less whatever demand response is implemented, and for all but a few hundred hours per year wind/solar/hydro/gas will meet demand. So, in the medium term to 2030 or later, we should be focusing on backup power rather than energy. In the current environment it is difficult to see batteries with more than 1.5-2 hours duration being economically viable because on all but a few days per year, the batteries will run at far less than peak power and their output will therefore be spread over the entire evening peak.
The next limitation on storage is excess wind and solar capacity. All reliable grids have significant excess capacity both in terms of peak power but also annual generation. In 2008 the coal and gas capacity on the NEM could have comfortably provided 280 TWh, but in fact provided 195 TWh. If we build enough wind and solar to provide 280 TWh at normal capacity factors then on seven days out of ten there will be excess energy and hydro will handle most of the peaking demand, new storage will be active for only a few hours and will rarely need to run at anything like peak power. We can also see that if you examine the seasonal variation in renewable share on OpenNEM against the running average renewable share, that there is not much variation, typically winter renewable share is about 90% of the preceding summer renewable share. If there is 280/195 i.e. 44% excess capacity then seasonal variations will easily be covered.
Consequently depending on the cost of long term storage it is quite likely that we can easily exceed 83% renewable grid with no more than 10 GW/25-35 GWh of storage