I started this article Thursday evening 23rd February 2023 (as it was unfolding), but did not get it finished. With the passage of time it’s evolved to be a bit longer, but need to post it now (still unfinished) before it’s ancient history…
—
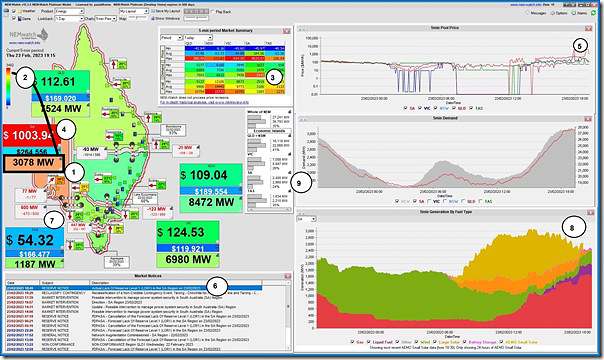
Here’s a snapshot from NEMwatch at 19:15 on Thursday 23rd February that has been annotated in several places:
(remember to click on any image to open in a larger resolution view)
We see in the image above a number of things, as follows:
1) At this time it was still quite hot in Adelaide (not unusual, in the scheme of things, but perhaps more unusual given La Nina summers recently).
2) The heat was driving the Market Demand up to 3,078MW, which is well up in the ‘red zone’ based on the historical range for this measure of demand;
3) But we also see it’s been higher Thursday evening (at 3,142MW for the 19:00 dispatch interval … which ended up being the highest for the evening);
4) For the current dispatch interval we see that the price is $1,003.94/MWh
5) … and that this is not the first dispatch interval it’s been above $1,000/MWh:
(a) we also see at this point it’s been above $100/MWh for many hours;
(b) what became clear became apparent later, was that this was the last interval above $1,000/MWh, and that there had been two stints:
i. 17:50 , 17:55
ii. then 18:55, 19:00, 19:05, 19:10 and 19:15 (here)
… we see below the differences between the two stints
6) We also see that the AEMO published Market Notice 106087 at 18:49 (i.e. just prior to the second stint starting) alerting the market to an Actual LOR1 tight supply-demand balance warning:
——————————————————————-
MARKET NOTICE
——————————————————————-
From : AEMO
To : NEMITWEB1
Creation Date : 23/02/2023 18:49:17
——————————————————————-
Notice ID : 106087
Notice Type ID : RESERVE NOTICE
Notice Type Description : LRC/LOR1/LOR2/LOR3
Issue Date : 23/02/2023
External Reference : Actual Lack Of Reserve Level 1 (LOR1) in the SA Region on 23/02/2023
——————————————————————-
Reason :
AEMO ELECTRICITY MARKET NOTICE
Actual Lack Of Reserve Level 1 (LOR1) in the SA region – 23/02/2023
An Actual LOR1 condition has been declared under clause 4.8.4(b) of the National Electricity Rules for the SA region from 1830 hrs.
The Actual LOR1 condition is forecast to exist until 1930 hrs.
The forecast capacity reserve requirement is 587 MW.
The minimum capacity reserve available is 474 MW.
Manager NEM Real Time Operations
——————————————————————-
END OF REPORT
——————————————————————-
… so I started to dig a bit deeper to understand a bit more:
(A) What’s producing, and what’s not?
The NEMwatch image above shows in aggregate what’s making up the bulk of the supply for the South Australian region:
7) For a start, note that the interconnectors are cranked to the maximum current capability for imports into South Australia:
(a) With the Heywood interconnector exporting 600MW from VIC (which is up around its thermal limit, so thankfully not limited by more transient constraints); but
(b) The Murraylink interconnector only able to export 77MW from VIC.
8) The fuel supply mix shows in broad terms that:
(a) Solar’s mostly disappeared for the day;
(b) Wind generation is (thankfully) starting to ramp back up from an earlier lull late until about an hour earlier, though its still quite low;
(c) Thermal generation (gas and liquid) is making up the dominant amount of supply;
(d) We can even see the small but meaningful contribution from various batteries in South Australia in the pink.
—
The above was all visible at the point of dispatch in the NEMwatch widget above … but with the advantage of ‘next day public’ data and the ‘Bids & Offers’ widget inside of ez2view, and a bit of Time-Travel, we can see a bit more detail:
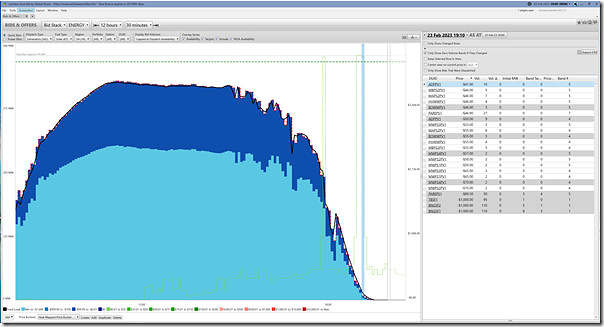
(A1) Supply from gas generators
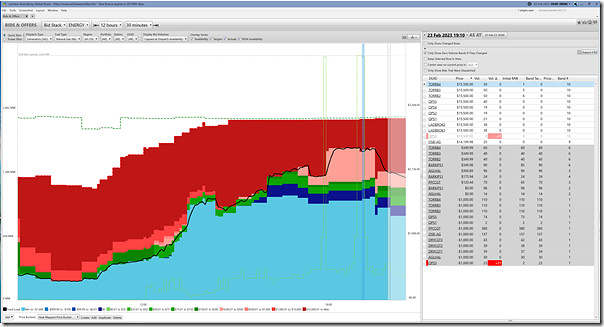
Here’s a snapshot of bids from SA-located supply side units, filtered on gas-fired units:
You’ll note that (with the time-travel point for the whole window being 20:00) I’ve focused the table on the right to be the bids from these units considered in dispatching the market for the 19:10 dispatch interval
… which happened to be the second-last dispatch interval with the price above $1,000/MWh (it was $3,999/MWh – dropping to $1,003.94/MWh at 19:15, snapshot in NEMwatch, and then lower still afterwards).
Of particular interest to some will be the limited amount of ‘spare’ capacity from any unit … and how it was all bid up at the $15,500/MWh MPC.
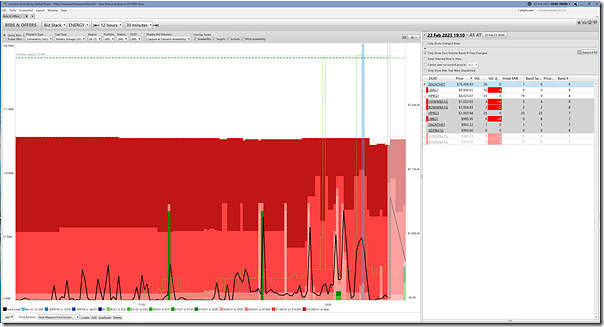
(A2) Supply from liquid-fired generators in SA
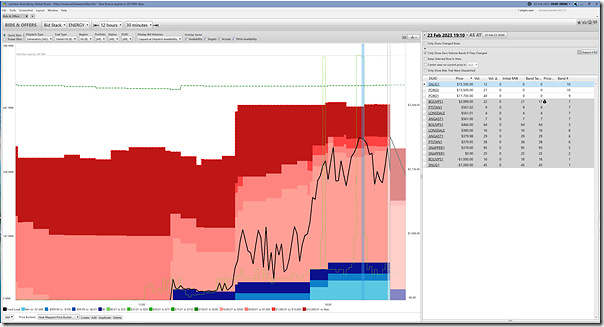
Here’s the supply-stack from the (traditionally higher-priced) thermally-fuelled generators:
Since 2022 (and the Ukraine-boosted 2022 Energy Crisis) we’ve seen those old traditions upended. Indeed, we see increasing volume of energy bid in blue in the above:
1) Small a minority percentage, but increasing through until 20:00
2) Perhaps (at least in part) because of ‘slower’ FSIP characteristics that can’t keep up with the pace of 5MS?
Note the indication (in the table) that the bid from Bolivar (bidding volume at $3,999/MWh at the RRN) has been involved in setting the price for ENERGY in the SA Region.
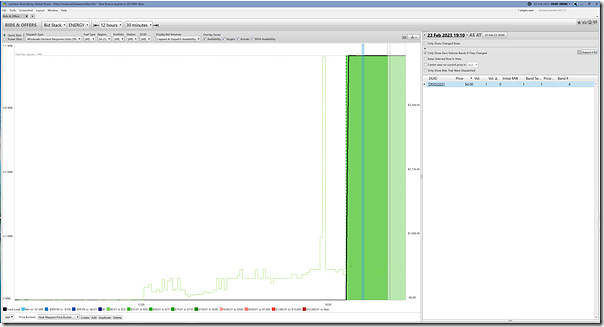
(A3) Supply from Wind Farms in SA
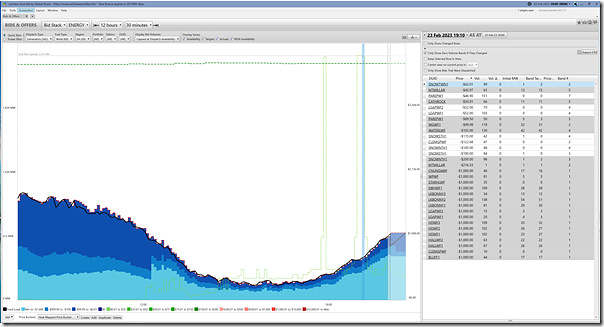
Here’s an aggregate view of the ‘true volume’ offered by Semi-Scheduled wind farms (and those Non-Scheduled required to operate like Semi-Scheduled) across South Australia:
At its lowest point earlier in the day, aggregate supply from wind was down to ~250MW … but we see that it’s started to rise further at 19:10. We see that the aggregate ‘true volume’ was lower during the first price spike.
… in the table note that bids are shown as ‘as offered’ nit ‘true volume’ … so it shows cheap volume notionally offered to the market that actually can’t be supplied because of lack of wind resource.
(A4) Supply from Large Solar in SA
Rooftop PV does not bid into the wholesale market, so all we have in terms of visibility for bids on Thursday is for the Large Solar Farms operating in the South Australian region. There are currently four large-sized units, plus a number of smaller ones operated by SA Water:
On this occasion (note – does not always happen!) there’s a nice inverse relationship going on between the two different VRE sources:
1) During the later >$1,000/MWh pricing period, solar’s almost completely gone … but wind has begun ramping back up
2) During the earlier (and shorter) >$1,000/MWh pricing period, solar’s still contributing something reasonable … whilst wind is at its lowest point.
… looking at the bids for thermal above (and remembering the interconnectors being maxed out) we can deduce that the price would likely have been at $15,500/MWh but for this wind-vs-solar synchronicity that ‘came to the party’ on this instance.
(A5) Supply from BESS Discharge in SA
Here’s a similar view for the BESS supply-side units in SA;
Remembering the severe energy limitations have (as an integral part of their technology) it’s no wonder they bid all their volume in ‘pink and red’ in order to conserve precious charge.
(A6) A solitary Negawatt dispatched in SA
One of our team members pointed this out internally on Thursday evening (aggregate dispatch of negawatts is visible in real time in the ‘NEM Map’ widget). But using the same ‘Bids & Offers’ widget inside of ez2view here’s a view over time:
It’s obviously going to be subjective, but (from my perspective) despite all the song-and-dance that existed for many years in certain quarters in agitating for the creation of market rules that favoured the dispatch of negawatts in the NEMDE centralised dispatch mechanism , we see that there’s a single solitary MW of Negawatt dispatched in SA during Thursday evening.
There are several articles I’ve written here (like on 24th November 2020, on 21st October 2019, on 5th March 2019, and further back in history) expressing concern with the overall process, the evidence to date (here’s at 4th November 2022, more than one year after the start of the rule) seems to me to be decidedly underwhelming.
So much collective effort on the part of the industry over many years could have been much better invested solving much more real and pressing problems (such as driving towards a real two-sided market)!
… now don’t get me started on 5MS!
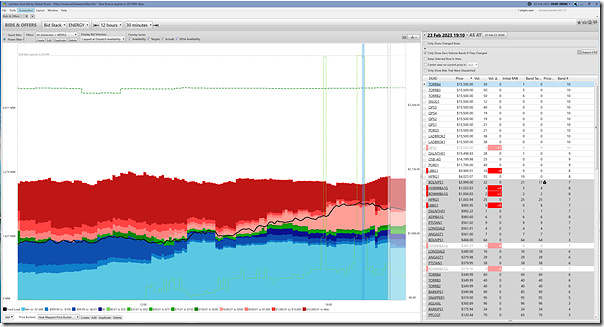
(A7) Aggregated all supply-side units
Aggregating all the supply-side units together (which entails remembering Tripwire #3 and that WDRU units are supply-side units despite being registered as ‘loads’) we see the following aggregated view:
We’ve worked through many individual implications for each fuel type above, so the only other thing I would remark on is prior cautions about how we’re seeing progressively ‘declining volume bid in green’*.
* for reference to this, see:
1) In May 2019 via GRC2018 we noted about the reduced ‘volume bid in green’ as one of the indications of how ‘The Level of Risk in the NEM is increasing’ … and we expanded on this in December 2021 via GenInsights21 (as the pattern, and the level of risk, has not abated – in fact it has increased).
2) the ‘not much volume bid in green’ reference discussed around the ~22:31 mark of this presentation to the Smart Energy Council audience on our GenInsights21 report.
In the case above note that there’s almost zero megawatts bid in green from any supply-side option across South Australia … which reinforces we’re going to see increasing boom-bust pricing cycles (i.e. extreme volatility) into the future.
(B) Highest ‘Market Demand’ since January 2014
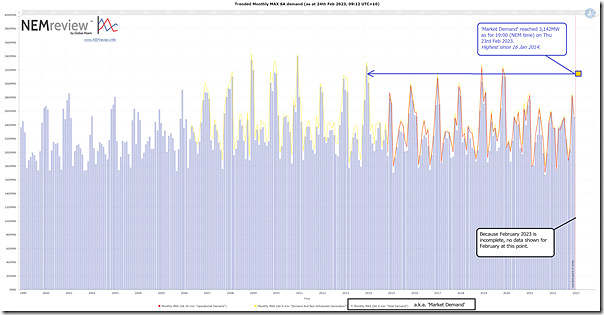
Using our NEMreview v7 tool I’ve produced this long-range trend of monthly maximum for various measures of demand (excluding February because the month is not yet done):
(for those clients with a licence to this software, they can open their own copy of this query here)
With respect to the measures of demand:
1) When speaking about ‘Market Demand’ we’ve the longest time range of history to compare to.
(a) As noted further above, the Market Demand reached 3,142MW at 19:00 (NEM time) on Thursday 23rd February 2023;
(b) We can see in the chart above that this point is higher than any monthly maximum since the Market Demand reached 3,259MW on 16th January 2014
(no exact snapshot of that level of demand on the day, but there was this article recorded earlier about the heatwave)
… so the Market Demand on Thursday 23rd February 2023 was highest in over nine years in South Australia!
2) With respect to ‘Operational Demand’ (the measure AEMO increasingly speaks about, as it reflects what they can ‘see’ in the grid in real time … but not directly what impacts on the market):
(a) The chart shows that published data does not go back as far as January 2014;
(b) Operational Demand peaked at 3,125MW in the half-hour ending 19:00 (note – AEMO publishes Operational Demand on a half hourly basis still) on 23rd February 2023.
(c) By our calculations the last time it was this high was 19th December 2019 (i.e. skipping only summer 2020-21 and summer 2021-22).
… after that day, we’d published this ‘Not-So-Quick review of price spike in South Australian region yesterday (Thu 19th Dec) evening’.
(C) ‘Market Demand’ significantly higher than immediately preceding market forecasts
Remembering that we can use the ‘Forecast Convergence’ widget in ez2view to ‘look up a vertical’ and see ‘that other dimension of time’, on Friday 24th February I used time-travel to wind the clock back to Thursday evening (at 20:00, just past all the activity above) to see what was visible in the P30* predispatch data.
* in doing this I am remembering both Tripwire #1 and Tripwire #2 that means that we’re still not getting full visibility of what AEMO or NEMDE thinks might happen into the future … a technical limitation related (at least in part) because of the increasing computational complexity that the P5 predispatch forecast being subject to in the energy transition.
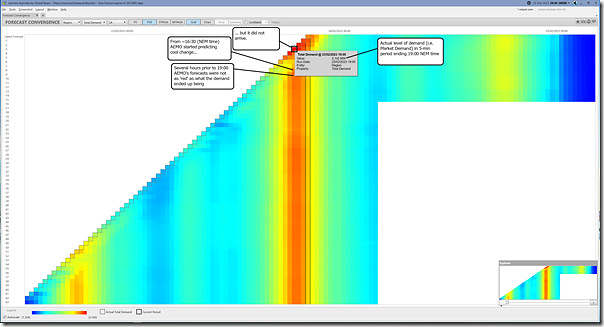
In the first snapshot we look at the ‘Grid’ view and see a couple of things:
In this case, the sliding colour scale makes it clear that:
1) The actual level of ‘Market Demand’ in the 5-minute period ending 19:00 (NEM time) was significantly ‘redder’ (i.e. higher) than any prior forecast;
2) But it was particularly higher than the (much more moderate) forecasts immediately preceding …
3) … where it appears that the AEMO was expecting some form of cool change that did not materialise.
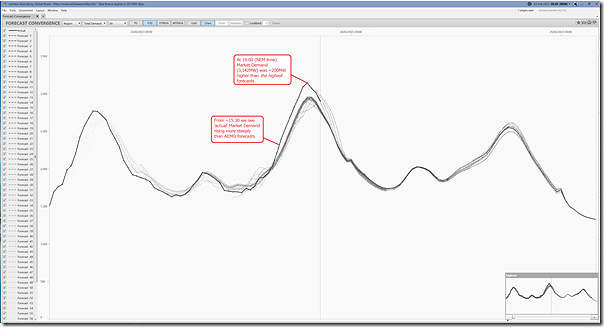
Flipping to ‘chart view’ we see one other thing jumps out:
With this chart we can see that:
4) Even the (several hours before) forecasts that appeared ‘reddish’ in the grid view were ~200MW below what the final ‘Market Demand’ ended up being.
… so suffice to say that what eventuated was a fair surprise to AEMO, and presumably others in the NEM.
More could not note, but that’s all for now…


Why was Market Demand at a 9 year high while Operational Demand only hit a 3 year high?
I think the reason will be those non-scheduled wind farms that now have to bid and be dispatched like their semi-scheduled cousins. That change meant that their output is now counted as contributing to meeting Market Demand; previously their output effectively subtracted from the grid demand met by market-dispatched sources.
In other words there has been a basis change in the last 18 months that increases the measured Market Demand.
On the other hand the Operational Demand and Demand and Non-Scheduled Generation measures have always included demand met by these non-scheduled wind farms.
Good pickup, thanks Allan!