
The energy transition has implications across all timescales of the electricity market and underlying physical system – from the multi-decade horizon of the Integrated System Plan (ISP), through the ten-year outlook of the Electricity Statement of Opportunities (ESOO), the five-minute to days-ahead cadence of the spot market, right down to the second to second and even sub-second grid security requirements being addressed through AEMO’s Engineering Framework.
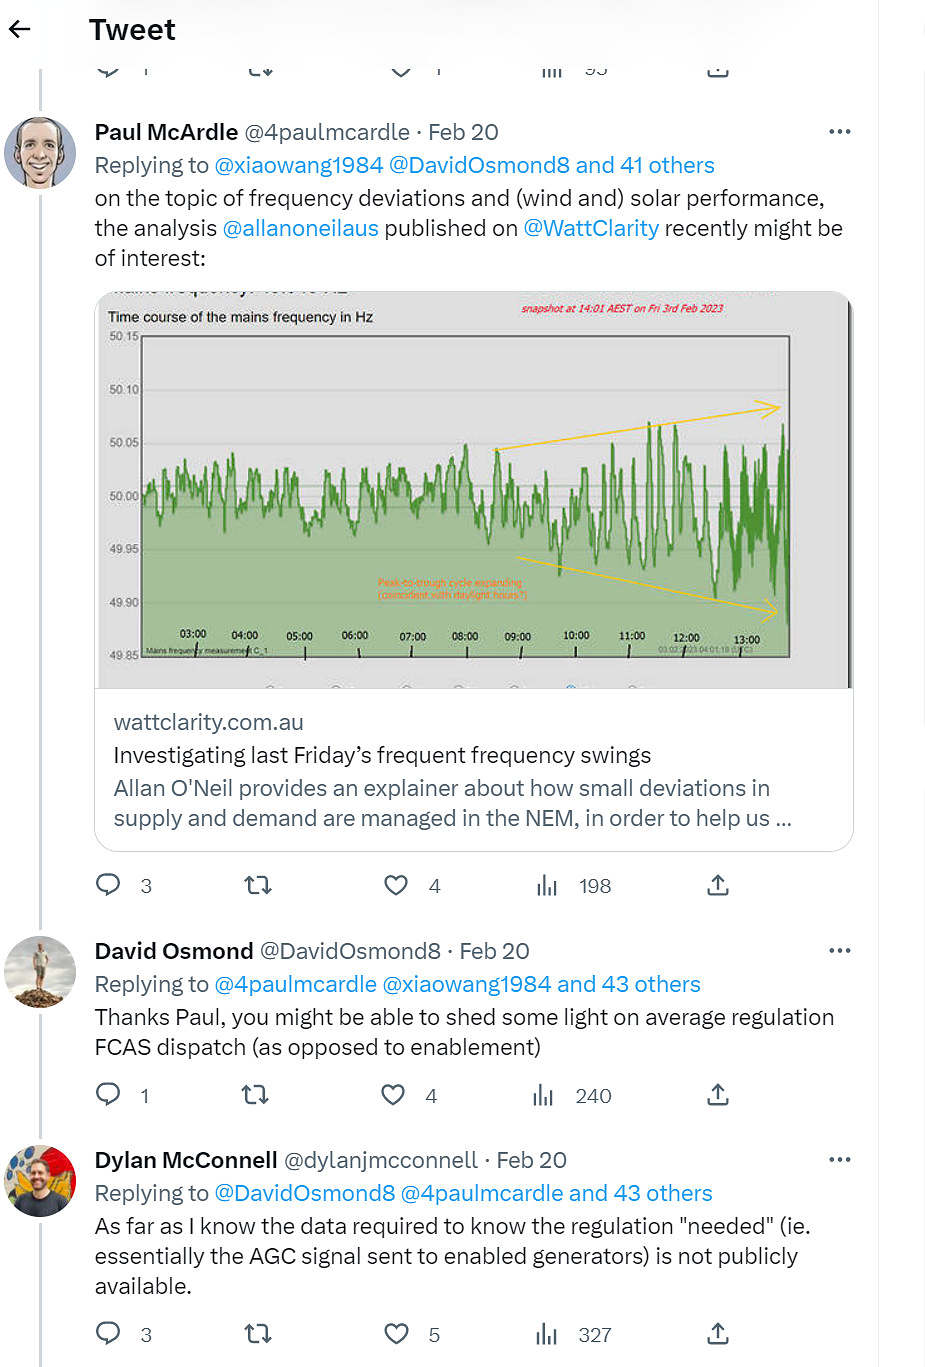
Towards the shorter end of this spectrum, the frequency performance and control of the power system is something we focus on occasionally in WattClarity posts, most recently looking at some swings in grid frequency on 3 February, which appeared in part to be driven by output from grid-scale solar plants deviating away from forecast levels (for a few different reasons).
Generator output and loads on the power system are always deviating – from previous values and forecasts – by some amount, with net short-term deviations showing up as movements in system frequency. As outlined in that Feb 3 post, there are multiple physical and market mechanisms in place to deal with these deviations. Following that post, there was some online discussion about whether the increasing penetration of renewables is leading in general to greater reliance on some of these mechanisms, or showing up as increases in the quantities that AEMO procures.
As a partial answer, in this post I’ll focus on two of the market Frequency Control Ancillary Services (FCAS) procured by AEMO to help manage drifts in system frequency – the Regulation Raise (or “Raise Reg”) and Regulation Lower (“Lower Reg”) products. There are at least two relevant metrics we can use:
- How much of each service does AEMO enable? – this quantifies the total capability that AEMO assesses might be needed in each five-minute dispatch interval (but doesn’t necessarily all get used).
- How much of this enabled capacity is actually utilised to deal with the frequency deviations that do occur?
Enablement
Answering the first question is simpler than the second – AEMO’s five-minute market dispatch data provides both system total and facility-level volumes enabled for each FCAS product, and using this we can look for any trends in how much total capability AEMO is procuring – here they are for Raise Reg and Lower Reg back to 2011:
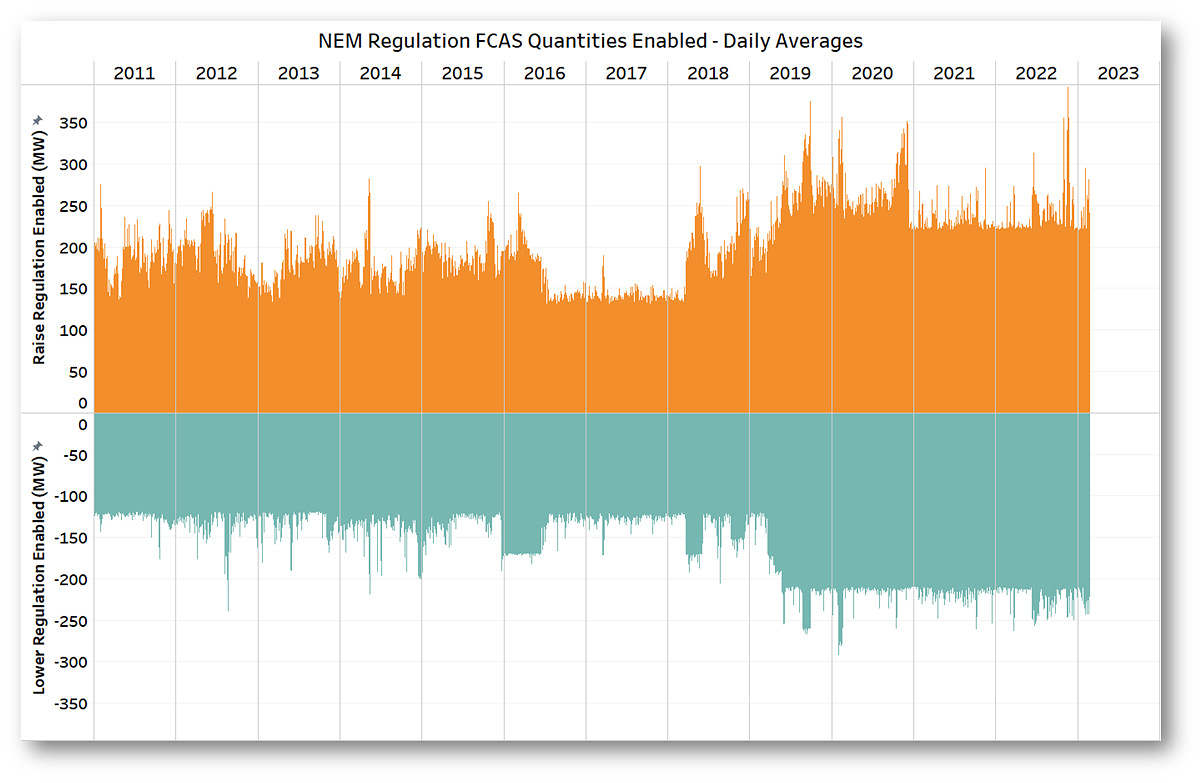
The chart summarises daily average Regulation capabilities enabled; at five-minute level these quantities can also move around depending on system conditions. The chart essentially shows signficant ramped or stepped increases over 2018 and 2019, but no very obvious trends on either side of that period. The day-to-day volatility in average enablement also varies at times, and between products, with Raise Reg average enablement varying much more than that for Lower Reg. Others might have better explanations than I can quickly give for these observations.
Utilisation
Tracking utilisation of enabled Regulation capacity is a bit more involved. AEMO’s Automatic Generation Control (AGC) system sends signals every four seconds to each facility enabled for Raise or Lower Reg, instructing how much deviation, if any, in facility output (within its enabled range) the AGC has calculated is needed to address frequency drift. Here’s an example of how this plays out for a particular facility in the NEM:
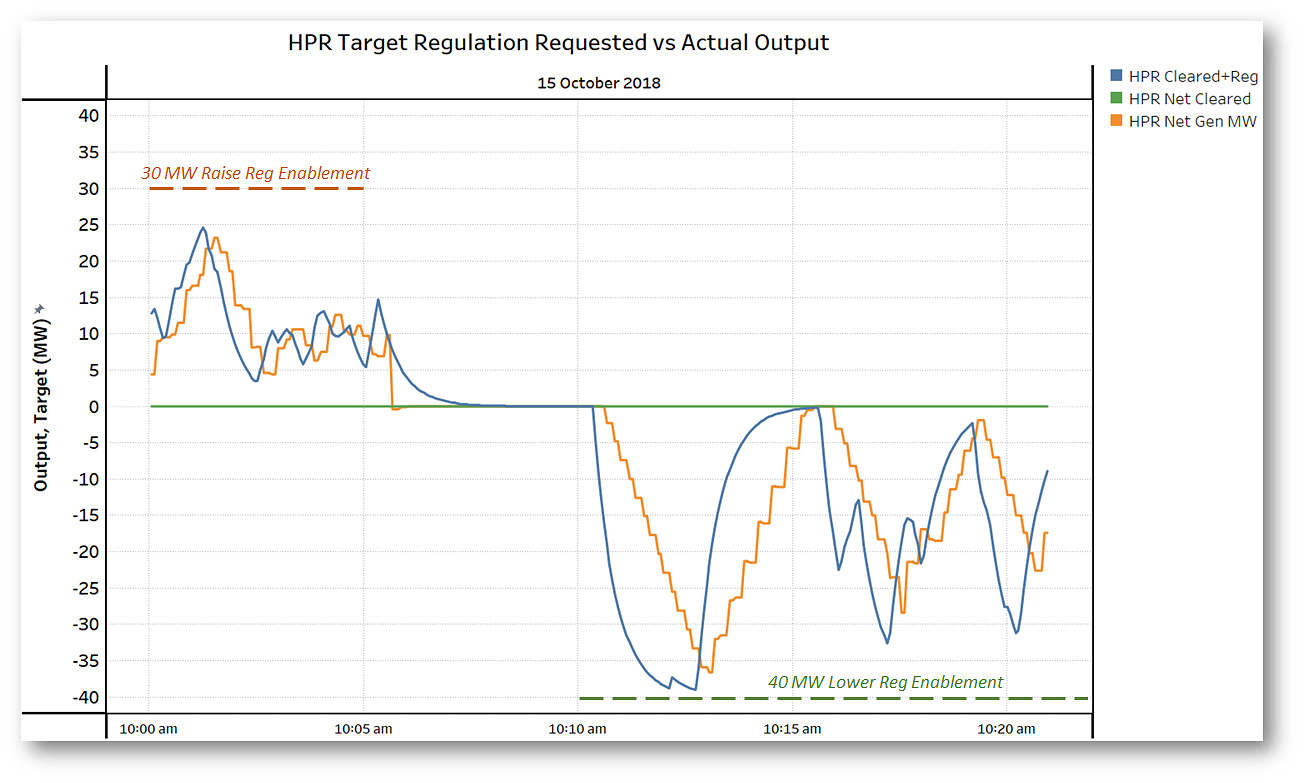
The chart shows activity of the Hornsdale Power Reserve (HPR) battery in South Australia over 20-odd minutes, or four and bit dispatch intervals, back in 2018. Over this period Hornsdale was bid out of the energy market with market targets of zero MW – neither charging nor discharging – shown by the green baseline, but as indicated by the dashed horizontal lines, it was enabled for either Raise or Lower Reg services in some of these intervals.
The blue solid line is effectively showing HPR’s 4 second output targets – controlled variations away from its zero baseline – being commanded by the AGC system. A positive target (discharging) is for Raise Reg and negative (charging) is for Lower Reg. The orange line shows the actual response of the battery to these instructions. Some of the apparent lag in response may reflect small timing offsets in the underlying data for this chart, and some appears to relate to the ramp rate at which the battery moves between power levels.
We can see that in some intervals the AGC is commanding a lot of output variation away from HPR’s zero baseline – higher utilisation of enabled Raise and Lower Reg – but in others not so much.
This raises a question about how best to measure utilisation of these Regulation capabilities within each dispatch interval:
- By comparing the maximum Raise or Lower Reg amounts targeted at any point within the interval (the peaks and troughs of the blue line) to the enabled capacity? Or
- By comparing the average amount targeted across the whole interval to enabled capacity?
It probably makes more sense to use the first definition, because these Regulation services are essentially “capacity products” with total amounts procured and enabled across the NEM based on the maximum deviations that AEMO calculates these services may need to correct for. If all enabled capacity is being fully commanded by AGC at some time within a given dispatch interval – even for a short sub-period – then it seems sensible to describe this capacity as being fully utilised in that interval. (When doing this for aggregate FCAS utilisation across the whole market, we first have to add up individual facility actuals for each four second period, before taking the maximum of this total.)
For aggregating utilisation across multiple dispatch intervals – for example to calculate a daily utilisation – it then makes sense to go back to averaging the dispatch interval level maximums. This is because FCAS services are essentially designed to deal with frequency deviations within each interval, with energy market dispatch attempting to “reset” the baseline position for the system at the next five minute boundary. Averaging across dispatch intervals therefore gives a sense of how frequently and extensively the system is relying on enabled FCAS capacity over longer time periods.
Drowning in data
The 4-second data for analysis like that charted above – the only public source for assessing overall utilisation of FCAS Regulation – comes from AEMO’s Causer-Pays files, which disgorge operational data at a rate of over 37 million new rows daily – a bit beyond spreadsheeting. Assessing total utilisation of FCAS Regulation services involves trawling through this data and adding up the AGC regulation commands issued to each enabled facility (generator, battery or load) for every four second period.
Fortunately the good people at Global-Roam have already wrangled a fair bit of this data into useable database format, making some longer term analysis practicable. This provides the opportunity to see if utilisation of enabled FCAS Regulation capacity has been increasing as more variable renewable energy (VRE) sources, both large and small scale, have been added to the NEM.
Global-Roam’s hoard of processed 4-second Causer Pays data covers all of 2011, a little of 2017, then from March 2018 a nearly continuous record. While it would be nice to see results from intervening years, I’m loath to ask them to quickly load another 70 billion-plus data rows from AEMO’s Causer Pays files, so the analysis here is limited to what’s already been processed. But having a full record for 2011, when there was much less VRE in the NEM, still provides a good starting point for assessing longer term trends.
Resurfacing
And here are some results:
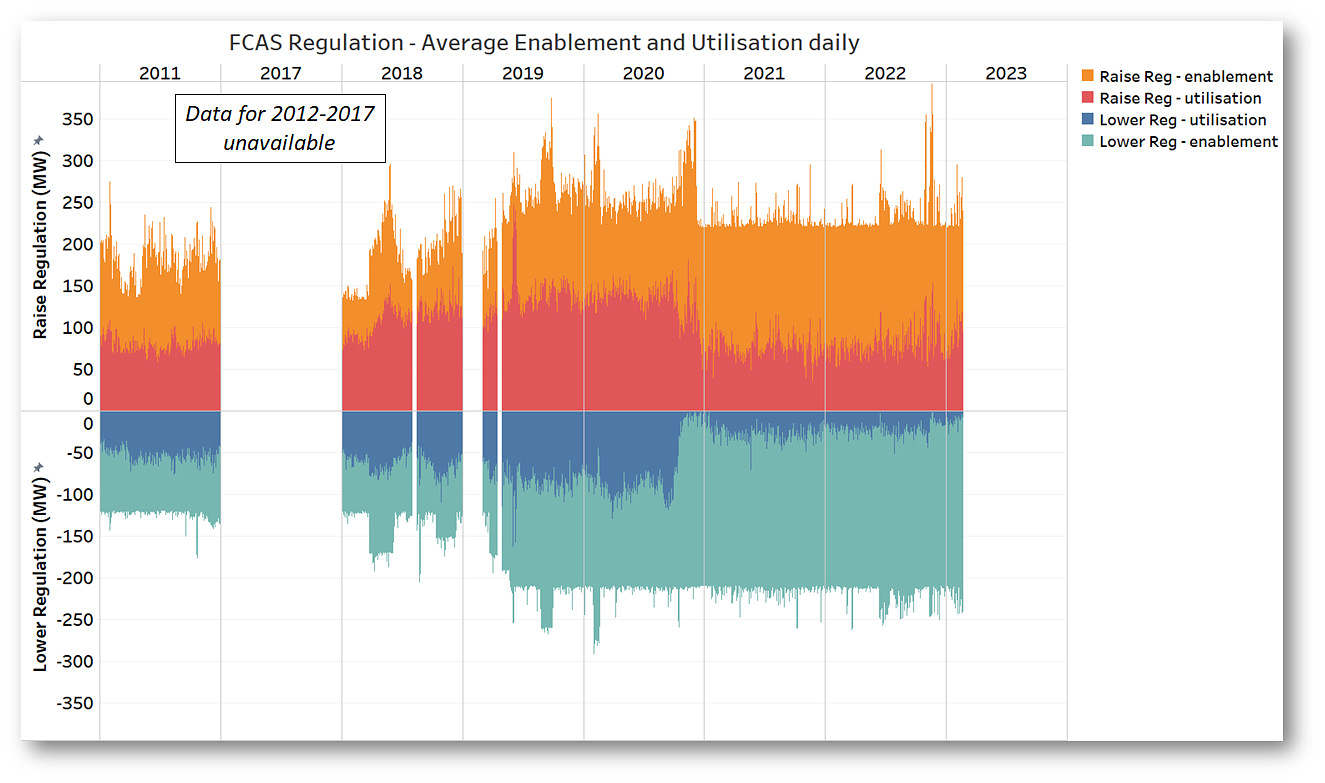
I’ve shown both utilisation and enablement as daily averages across Global-Roam’s processed 4-second dataset. Remember that utilisation is the daily average of the maximum amounts of Regulation service that AEMO’s AGC commanded within each dispatch interval. What stands out here?
- Despite those stepped increases in enablement quantities over 2018 – 2019, on average the amount of FCAS Regulation utilised in recent years appears to be no higher than it was back in 2011 – in fact quite a bit less in the case of Lower Reg.
- There were clear reductions in average amounts utilised from late 2020. This coincides with wide-scale implementation of mandatory Primary Frequency Response (PFR) across the NEM at that time. This is a finer-grained mechanism where nearly all generators are required to respond automatically to frequency deviations, and not surprisingly its (re)introduction has taken pressure off the centrally-controlled Regulation services.
- There probably is (visually at least) a bit more volatility in utilisation of Raise Reg in the last couple of years.
It might also seem from the chart that AEMO is enabling more of these services than necessary. But appearances can be deceptive, and it’s useful to switch to a view of the maximum quantities of FCAS regulation utilised and enabled at any time within each day of the period (switching to maximums reveals a couple of minor but very-hard-to-get-rid-of data glitches caused by duplication of underlying data rows in the 4-second data – but these are not material to the overall analysis).
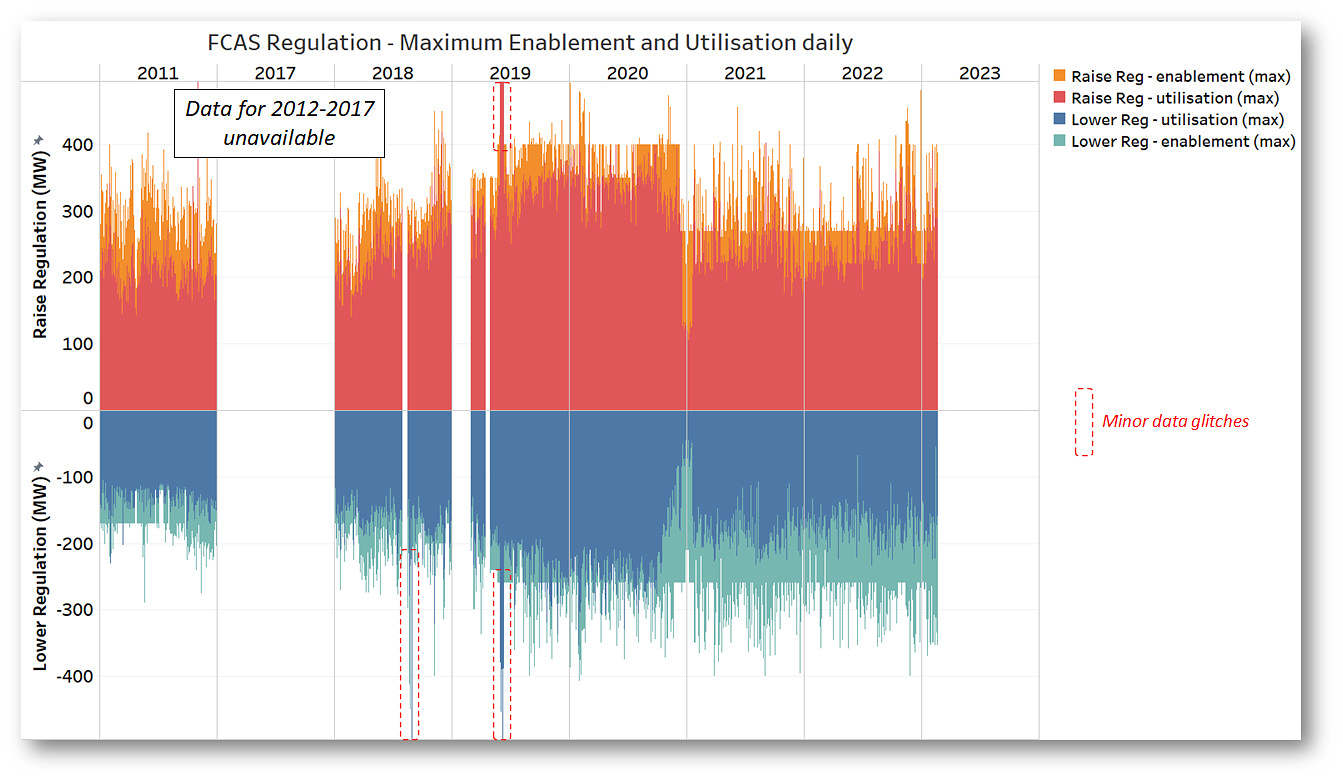
The need for Regulation response is inherently uncertain, as it depends on foreseeable but unpredictable factors driving frequency drift, and the Regulation FCAS amounts that AEMO enables are calculated on an assessment of the potential largest need for response within a dispatch interval, not the average.
On this view, we see that at some point in most days, the highest amount of FCAS Regulation capability that is utilised reaches a fairly high proportion of the maximum enablement for that day, particularly for Raise Reg. But we also see that the implementation of PFR has generally reduced these maximums, and similarly to the results for average utilisation, recent levels are not much higher than they were back in 2011, despite all the VRE added to the NEM since that time.
It will be interesting to track these trends over the next few years as the transition continues.
=================================================================================================
About our Guest Author
 |
Allan O’Neil has worked in Australia’s wholesale energy markets since their creation in the mid-1990’s, in trading, risk management, forecasting and analytical roles with major NEM electricity and gas retail and generation companies.
He is now an independent energy markets consultant, working with clients on projects across a spectrum of wholesale, retail, electricity and gas issues. You can view Allan’s LinkedIn profile here. Allan will be ocassionally reviewing market events here on WattClarity Allan has also begun providing an on-site educational service covering how spot prices are set in the NEM, and other important aspects of the physical electricity market – further details here. |
Leave a comment