The December-January period each summer is a time for many of the team to take holidays, for some to catch up on a bit of cricket and now tennis, and to reflect on how our business has progressed through 2022.
However it’s not all been R&R and navel gazing, with a number of product development initiatives underway for those of our team working in any particular week. I’d particularly like to highlight two of these:
1) We’re* over the hump now in the compilation of the Generator Statistical Digest 2022 (GSD2022), with a view to release at the end of January 2023.
2) We’re* also progressing on the analytical work and report writing that will underpin the GenInsights Quarterly Update for Q4 2022 (i.e. focused particularly on the October-to-December period of 2022 for the Executive Briefings we’ll be delivering to a special set of clients in February 2023).
* note that in both cases here where I say ‘we’ I am referencing the combined team of us at Global-Roam Pty Ltd (publishers of this WattClarity® service, and other software products), and the team at Greenview Strategic Consulting Pty Ltd.
We’re looking forward to having both released in the coming weeks.
—
I’m one of the team who’ve been focused on preparation of the GSD2022 currently … which entails (amongst other things) repeated reviewing of successive drafts of the PDF (now well past 800 pages given all the DUIDs that are now operational in the NEM’s ENERGY market – remembering that there’s two pages of stats for each).
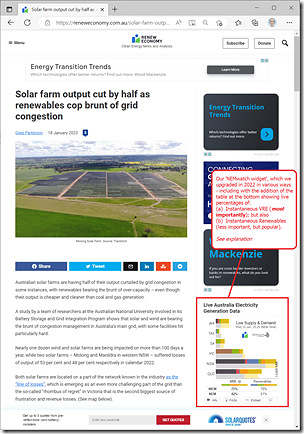
It’s partly for that reason that I noticed that Giles Parkinson had written ‘Solar farm output cut by half as renewables cop brunt of grid congestion’ on RenewEconomy on Wednesday 18th January:
The article jumped out to me as an opportunity to use the latest draft of the GSD2022 (coincidentally we finished another draft also on Wednesday) to cross-check some of what was noted in the article against the results we’re seeing in the current draft of the
The article clearly resonated with other readers as well, with a growing number of comments appended to the article directly!
In his article, Giles notes that:
‘A study by a team of researchers at the Australian National University involved in its Battery Storage and Grid Integration Program shows that solar and wind are bearing the brunt of congestion management in Australia’s main grid, with some facilities hit particularly hard.
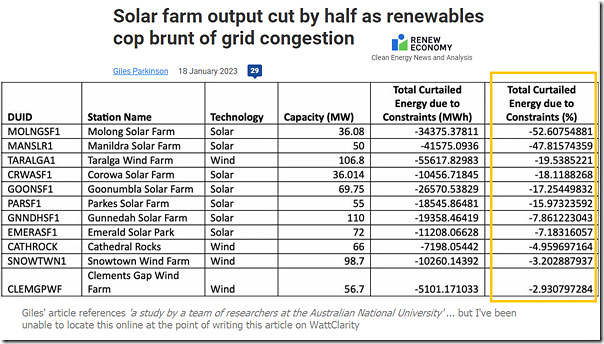
Nearly one dozen wind and solar farms are being impacted on more than 100 days a year, while two solar farms – Molong and Manildra in western NSW – suffered losses of output of 53 per cent and 48 per cent respectively in calendar 2022.’
A little further down, this table was provided:
I had a quick look and could not find the analysis by the team at ANU, so have only what Giles has written about to start with – but that’s probably enough for my purposes today.
(A) About curtailment of Solar Farms and Wind Farms
It’s worth, for a start, reminding readers of how Marcelle wrote ‘Not as simple as it appears – estimating curtailment of renewable generation’ back in June 2020. Something well worth remembering:
1) when doing this sort of analysis yourself; and/or
2) when reading of analysis by others.
As Marcelle noted in that article, there’s a couple different reasons why a Wind Farm or a Solar Farm might be curtailed, with three big reasons being…
Curtailment Cause #1 = Network constraints
Marcelle wrote that these might include:
‘such as a transmission line out of service, thermal or stability constraints on the network, or system strength limitations applying to specific units or types of generators’
This is the one that (my reading of Giles’s article suggests) is the focus of the ANU analysis.
However it’s important to keep in mind that there are other causes of curtailment as well, such as …
Curtailment Cause #2 = Economic curtailment
Marcelle wrote that these might be…
‘including the spot price being negative due to oversupply, or the cost of generation too high (e.g. In Feb 2020, due to extreme FCAS contingency costs that are paid by generators pro-rata on generation)’
Marcelle mentioned February 2020, but relevant to curtailment in 2022 could have been (for generators in South Australia) the high Contingency Raise FCAS costs in
Curtailment Cause #3 = Commissioning
Marcelle wrote:
‘new generators must progress through “hold points”, limiting their output until AEMO is satisfied they’re ready to generate more.’
As we work through the following, best to keep all three of these potential factors in mind.
Other causes of curtailment
In doing simple analysis for units operating in the ENERGY market, it may be that there are other reasons why they don’t achieve targets that their bid stack might simplistically suggest (e.g. lower targets in ENERGY might be due to ramp rates, or FCAS trapeziums, and so on).
(B) What can we see in the (draft of the) GSD2022?
We’ve not yet finalised the GSD2022 (we’re still checking through frequent iterations of drafts) but it’s useful to highlight that, when it’s released, there will be two pages of statistics for every* single DUID that was operational in the ENERGY market through at least some part of calendar 2022.
* note with respect to ‘every’ that there are DUIDs that exist that are not covered in the GSD2022. Specifically:
(a) it might be DUIDs that were active in one of more FCAS markets in 2022, but not in ENERGY (most of the report covers ENERGY so these pages would be mostly blank).
(b) it might be the DUIDs were not active in ENERGY for 2022 … in which case we’d refer you to a previous issue of the Generator Statistical Digest for their operations history.
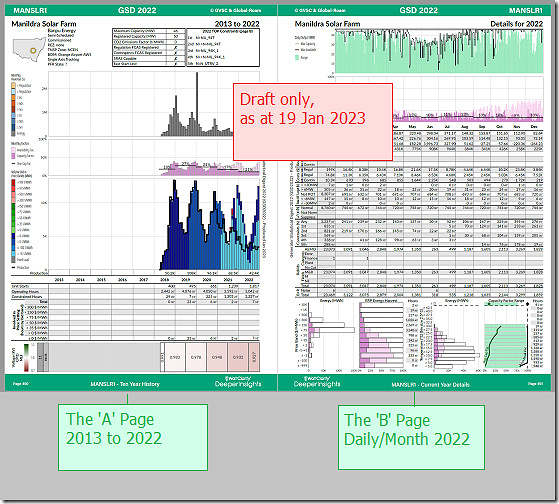
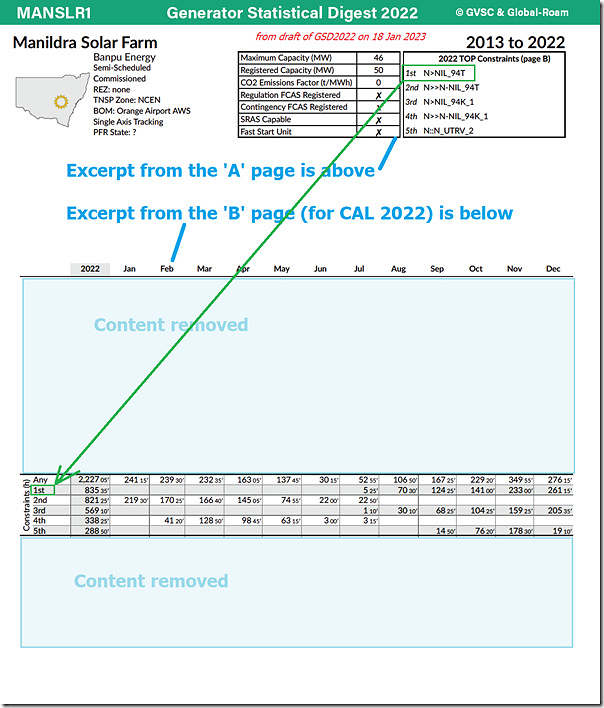
Here’s a quick look at a low-res image of the two pages for MANSLR1 highlighting the general structure of both:
1) The ‘A’ Page = which contains stats for that unit from 2013 to 2022 … typically on a monthly basis; and
2) The ‘B’ Page = which contains more detailed stats just for 2022 … sometimes monthly, sometimes daily, and sometimes aggregate.
Using the draft of the GSD2022, we take a closer look at some particular aspects of the operations…
(B1) Production pattern at MANSLR1
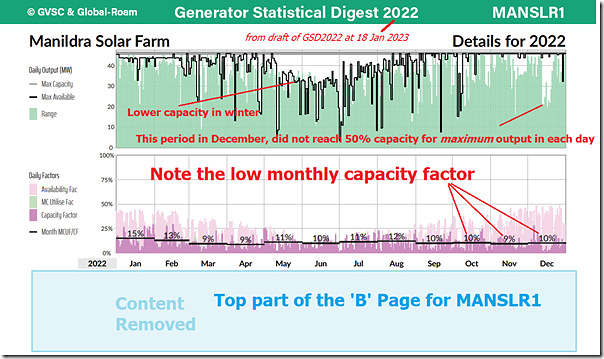
Here’s an extract from the top of the ‘B’ Page for the (draft of the) GSD2022 for MANSLR1 – which highlights the quite low capacity factors seen for the solar farm through the year (but particularly in November and December 2022):
This image is a better quality, so click on the image to open larger size.
This aligns with what Giles has quoted from the ANU analysis in his article – but the above does not, in itself, explain why output’s been low.
Consideration #1) Each of the 3 factors above highlighted in Marcelle’s article could be playing a role (although the plant’s been operational some time, so commissioning is probably not a factor here).
Consideration #2) On the face of it, looking just at the capacity factor, it might also be just due to low solar resource, or technical issues with the plant….
(a) however if we look at the lighter pink in the 2nd chart we see that the Availability Factor reaches levels in November and December similar to those seen in January and February (i.e. approaching 50%), so we deduce that these two potential contributing factors were also not significant either
(b) so it appears that we’re down to some combination of network congestion and/or poor economics as the main drivers for lower production in November and December than in January and February (noting that even the start of 2022 showed levels lower than other solar farms).
(B2) Constraints on MANSLR1
So we look elsewhere on the GSD2022 ‘B’ Page for MANSLR1 to see what impact constraint equations might have had on MANSLR1 through calendar 2022:
The table on the ‘B’ Page references the ‘top 5 constraints’ (i.e. in terms of hours bound with that unit on the Left Hand Side (LHS)) included at the top of the ‘A’ page.
1) Keeping in mind that there are 720 hours in a 30-day month, we see that some months (e.g. November 2022 with 349 hours in total) saw the unit on the LHS of a bound constraint for almost 50% of the whole month … and we guess that these hours might have been daylight hours, so the net effect even higher than the simple ratio of hours might imply.
2) Note that the top scoring constraint for this unit was the the ‘N>NIL_94T’ constraint equation … and that this constraint equation:
(a) was only bound from July 2022 onwards
(b) … which is coincidentally when a similarly named constraint equation (the ‘N>>N-NIL_94T’ constraint equation ) appears to have been phased out.
(c) with respect to the ‘N>NIL_94T’ constraint equation we see the number of hours bound grew from July through to December … possibly a seasonal effect, or due to some other factor.
We’ll explore this further below.
(B3) Production pattern at MOLNGSF1
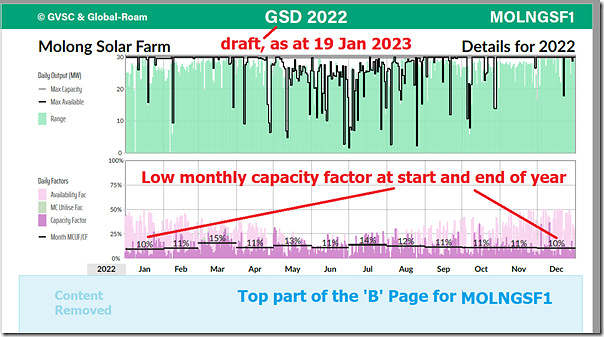
Worth including a quick note about the Molong Solar Farm, with a similar (but not identical) picture from the relevant ‘B’ Page:
In this case, the monthly capacity factor was lower in January 2022 than it was for Manildra Solar Farm. Both solar farms saw low capacity factor at the end of the year.
(B4) Constraints on MOLNGSF1
I won’t include an image here but see that there’s a similar (though not identical) picture for MOLNGSF1 in terms of constrained hours:
1) The top two constraints are the same
2) The 3rd, 4th and 5th constraints are different.
(B5) Offline analysis for MOLNGSF1
We thought it would be useful to also perform a quick calculation of ‘curtailment’ (keeping in mind Marcelle’s caveats) in order to cross-check with the numbers from the ANU that Giles quoted in his article.
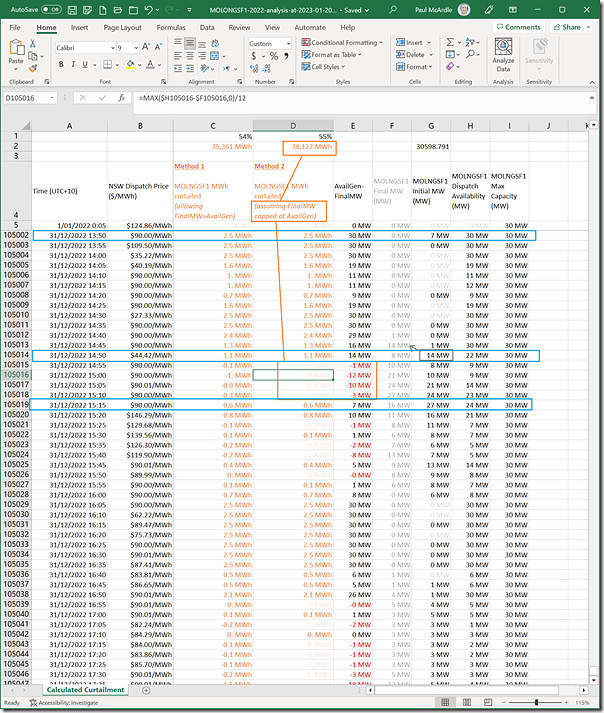
I chose to focus on Molong Solar Farm, but could have equally chosen any on the list – and extracted dispatch interval level data from the ‘Trends Engine’ in ez2view to perform some quick calcs in Excel. The following image illustrates the general pattern of what I did:
Note that I have used two different methods for performing the calculation – so we add these to what has been reported of the ANU analysis, we have three different measures – each of them similar (but different):
Measure 1 = from the ANU
Giles reports that the ANU says there was 34,375MW curtailed though the year due to transmission congestion, representing 52.6% of the total capability.
Measure 2 = from us (marked ‘method 1’)
This is based on simpler assumptions, and allows for ‘negative lost energy’ in the calculation (i.e. if actual generation is higher than the availability forecast in a 5-minute period, this is assumed to be ‘negative curtailment’).
This yields a total curtailed of 35,361MWh or 53.6% of the total capability.
Measure 3 = from us (marked ‘method 2’)
This goes further than Measure 2 and posits that ‘negative lost energy’ should be disregarded (i.e. it’s not really anything to do with a cause of curtailment, but rather due to some poor forecasts for that period of time – which is its own rabbit hole).
In this method, then, we ignore any 5-minute period where output was higher than the forecast availability, given that curtailment then was clearly not a factor.
Using this method we arrive at 38,122MWh curtailed, or 55.5% of total capability.
Whatever the measure chosen, and whatever the cause, it’s clear that the amount of production below forecast was substantial (relative to project size)!
(B6) A reminder that ‘Capacity ain’t Capacity’
Whilst typing this note, I see that the ANU report table that Giles quotes has a ‘capacity’ of MOLNGSF1 at 36.08MW … but in the image above the Maximum Capacity of the solar farm is only 30MW through the year.
This is another reminder that ‘capacity ain’t capacity’.
The Registered Capacity for MOLNSG1 is 36MW (which is probably where ANU gets its figure of 36.08MW from) … but I would have thought that (as I wrote here) Maximum Capacity would have been a better (though not perfect) gauge of ‘real’ capacity for a Solar Farm.
(C) About those Constraint Equations (Case Study of 31st Dec 2022)
With particular respect to MOLONGSF1 and MANSLR1, the (draft of the) GSD2022 highlights two particular constraint equations that have significantly affected the solar farms (in terms of hours bound per month through 2022):
1) The ‘N>>N-NIL_94T’ constraint equation in the first half of 2022; and then
2) The ‘N>NIL_94T’ constraint equation in the latter half of 2022 (… which was referenced tangentially in this explanatory article on 13th November 2022 as more significantly affecting both of these units).
In the image of the dispatch interval data in Excel above, I focused on 31st December 2022 (just because it was last day of the year) and highlighted in light blue three particular dispatch intervals, which I thought your be useful to explore using two widgets in ez2view and Time-Travel (a sort of a ‘Case Study’, if you like).
(C1) Time-travelled to 15:15 on Saturday the 31st December 2022
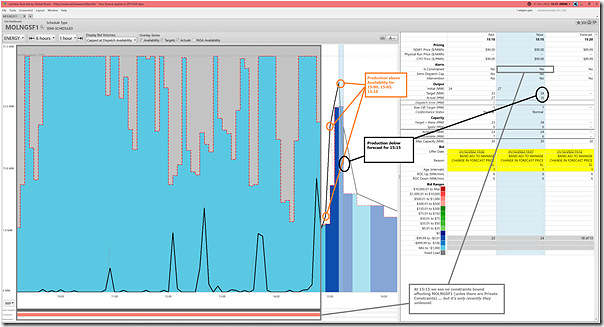
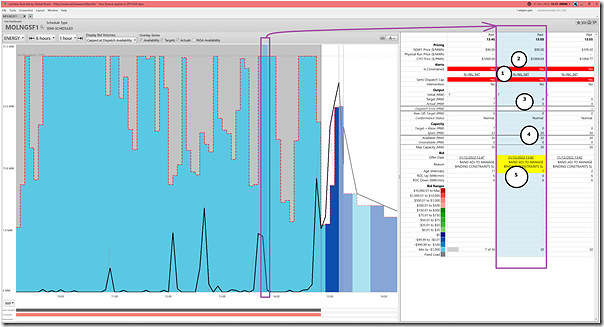
Let’s look particularly at the the 15:15 dispatch interval, using the ‘Unit Dashboard’ widget and the MOLNGSF1 unit:
For this dispatch interval, we see several things:
1) For much of the day shown (up until 14:55 last dispatch interval) the unit has been subject to (at least one) bound constraint:
(a) During this period we see the unit had bid down at –$1,000/MWh at the RRN;
(b) Yet despite this low bid, and the high Availability (i.e. the red dotted shape), actual output was very low and sporadic through this period.
2) For the 15:00, 15:05 and 15:10 dispatch intervals, the unit over-produced compared to its Availability.
3) For the 15:15 dispatch interval, the unit under-produced compared to its Availability (and Target) … not due to constraints, or low prices.
(C2) Time-travelled to 15:15 (and looking at 13:50) on Saturday the 31st December 2022
Leaving the time-travel point the same but clicking back in the chart at the 13:50 dispatch interval to set the table time point, we see the following:
With respect to the annotations:
1) At the 13:50 dispatch interval, the unit is subject to the bound ‘N>NIL_94T’ constraint equation;
2) This constraint is binding MOLNGSF1 that it’s CPD Price has dropped below –$1,000/MWh at the RRN…
… which means the unit can’t bid low enough to be dispatched at all.
3) Thus we see the Target driven to 0MW;
4) Despite the Availability being 30MW;
5) And even though there was a rebid submitted.
… without going into a different Rabbit Hole here, this rebid does not appear to have changed anything in particular between 13:45 and 13:50 – which reminds me of the broader logic we’re now using in the GSD2022 to classify all the ‘Noise Bid’ (note – not saying this is one here, as have not checked all the factors).
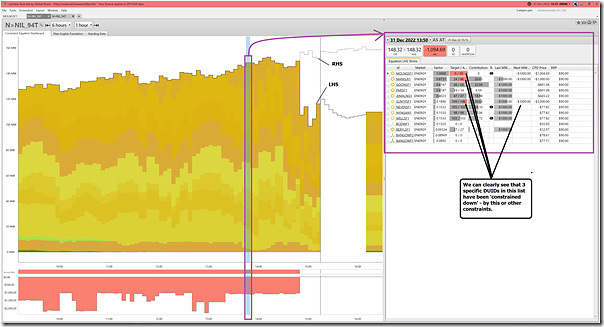
In this case, it’s possible to open up the ‘Constraint Dashboard’ widget (new to ez2view v9.5) and have a quick look at the ‘N>NIL_94T’ constraint equation:
There’s lots in this widget, but I’d just like to highlight a couple of things with respect to this particular constraint:
1) The top chart shows the relative contributions to the LHS by all the DUIDs (and Others, if present) – and they are coloured by fuel type…
… in this case we clearly see it’s a very solar-dominated constraint.
2) At 13:50 there are three DUIDs which are being ‘constrained down’:
(a) Might be by this constraint, or others as well;
(b) We see that MOLNGSF1 is being fully constrained down
i. … and that its LHS factor at +1.0 is largest
ii. … so we deduce that it’s this constraint having the effect here.
(c) We see that MANSLR1 is second on the list (i.e. its LHS factor here is next biggest, at +0.8731) and is being constrained down, but not fully
(d) The SUNTPSF1 is not 3rd in the list (i.e. its LHS factor here is small, at 0.1890), but is being constrained down, so we think perhaps there are other constraints also at work.
(e) In all 3 cases, their ‘Next MW @’ shows the next MW to be dispatched (if possible) from them would come at –$1,000/MWh.
(C2) Time-travelled to 15:15 (and looking at 14:50) on Saturday the 31st December 2022
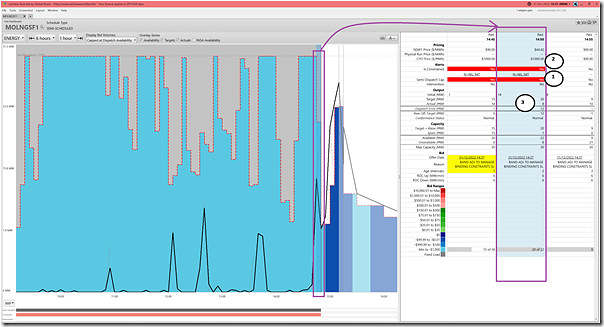
Skipping forwards 1 hour into the chart to the 14:50 dispatch interval we see the following – firstly in the ‘Unit Dashboard’ widget and the MOLNGSF1 unit:
Per the annotations:
1) The unit is still bound subject to the ‘N>NIL_94T’ constraint equation;
2) But on this occasion it’s CPD Price has risen to be –$1,000/MWh
3) Which allows some dispatch:
(a) Because that’s where the volume is bid at;
(b) But on this occasion we see that the unit misses its target;
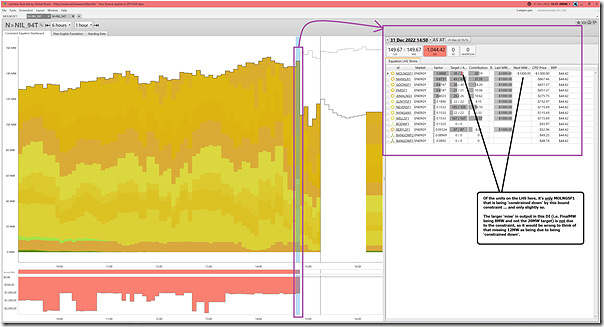
(c) A useful dispatch interval to highlight because in my two calculations above (i.e. Method 1 and Method 2) this dispatch interval was inferred as ‘constrained down’ – which is correct, but only somewhat so, with the bigger effect being just a poor forecast compared to what the plant actually achieved.
Flipping to the ‘Constraint Dashboard’ widget again, we see the following:
Whew!
—
I hope that just highlighting these three cases from 31st December 2022 illustrates the intricacies in determining whether or not a unit’s truly been ‘constrained down’ as a cause of ‘lost generation’!
In summary:
1) Both MOLNGSF1 and MANSLR1 experience low production through 2022 … lower than might be ‘expected’ if taking a high level view.
2) The precise amount of underperformance is complex to calculate (and depends somewhat on exactly what you’re trying to work out). My ‘back-of-the-envelope’ calculations for underperformance are the same order of magnitude as those quoted from ANU.
3) Even in the three dispatch intervals (of 110,000 in a year) i looked at, there are various reasons apparent.
(a) Transmission constraints are a factor, but so is underperformance relative to forecast.
(b) It’s quite likely that there would have been some economic curtailment through parts of 2022 as well.
4) As noted in WattClarity articles over many years, the NEM is a complex place…
The GSD2022, when we release it (another week or two), will provide a useful means by which people can quickly peruse a range of different performance metrics.


At the risk of adding more complexity, a better way of assessing curtailment or economic offloading is to just consider the difference between forecast availability and target output. If there is no forced curtailment, or offloading due to offer price, then target output will equal availability. Differences between target and actual for whatever reason – poor forecast or something else – shouldn’t go into calculating curtailment or economic offloading.
Thanks Allan!
Thanks for your insights and additional analysis Paul! These numbers came from our (ANU Battery Storage and Grid Integration Program) submission to the ESB’s “Transmission Access Reform Directions paper”. The analysis was done by my colleagues Jack Sorensen, Marnie Shaw, and Alix Zeibell.
https://bsgip.com/news-events/news/curtailment-due-to-congestion-whats-the-current-state-of-play/
If we followed Allan O’Neil’s methodology of assessing curtailment as the difference between forecast availability and target output wonder what the result would be for these two solar farms.
It was a very nice article, but nowhere did you actually state *what* the constraint was. It would be nice to know the simple root cause.
As noted in the article, Michael, the ‘N>NIL_94T’ constraint equation was one of the most significant ones. Obviously with the ez2view software we can drill in further … but that would be a separate (and longer) article.