
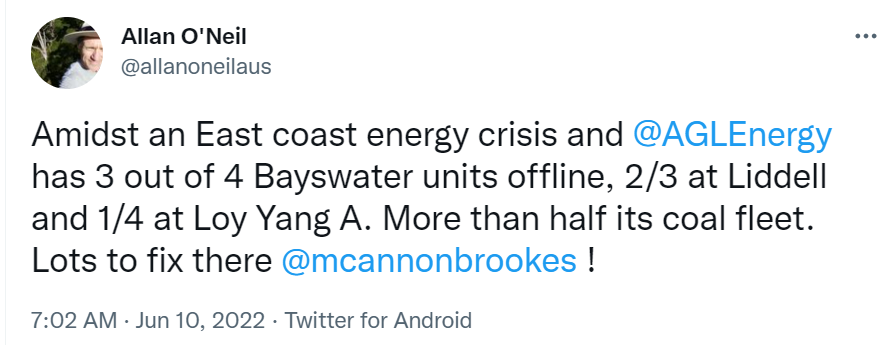
Tweet at your own peril
A quick mea culpa: after squinting at an ez2view layout early this morning I dashed off a tweet suggesting that six of AGL Energy’s eleven coal-fired generation units were offline – three at Bayswater, two at Liddell, and one at Loy Yang A, amounting to more than 50% of AGL’s coal-fired fleet. In fact two out of three Liddell units are online so it’s only 49% (by volume) offline, or a shade over 3,000 MW. A shame you can’t edit tweets.
Penance done, this situation again highlights something that’s drawn much attention in this East coast energy crisis, the performance of coal-fired generation in New South Wales, Queensland and Victoria. This shortish post tries to summarize – at high level – how performance has trended.
Promise versus reality
All scheduled generators in the NEM are required to provide rolling updates of their expected daily available capacity over a two-year forward window as part of the Medium Term PASA process. This is input to one of a whole suite of forecasts that AEMO runs over horizons ranging from hours to years ahead, assessing likely supply adequacy – ie reliability.
Thanks to a relatively recent rule change, these forecasts are publicly available down to individual generating unit level, which lets interested parties drill down into the data and more easily compare outcomes to what was projected, by individual unit, power station, fuel type or portfolio.
For example, here’s how the outlook for available coal-fired capacity in the NEM over Q2 – up to today – appeared a few days before the quarter started. The top panel shows expected daily availability by generating unit – here filtered down to black and brown coal-fired stations – while the lower chart plots the aggregate forecast availability and “Maximum Capacity” of this fleet. For various historical reasons, that Maximum Capacity line is somewhat overstated and a more realistic figure, if all non-retired units were online, would be more like 22,400-23,000 MW. I’m going to use the lower end of that range as the “practical maximum” from here (which means that my measures of percentage availability are somewhat flattering to the coal fleet).
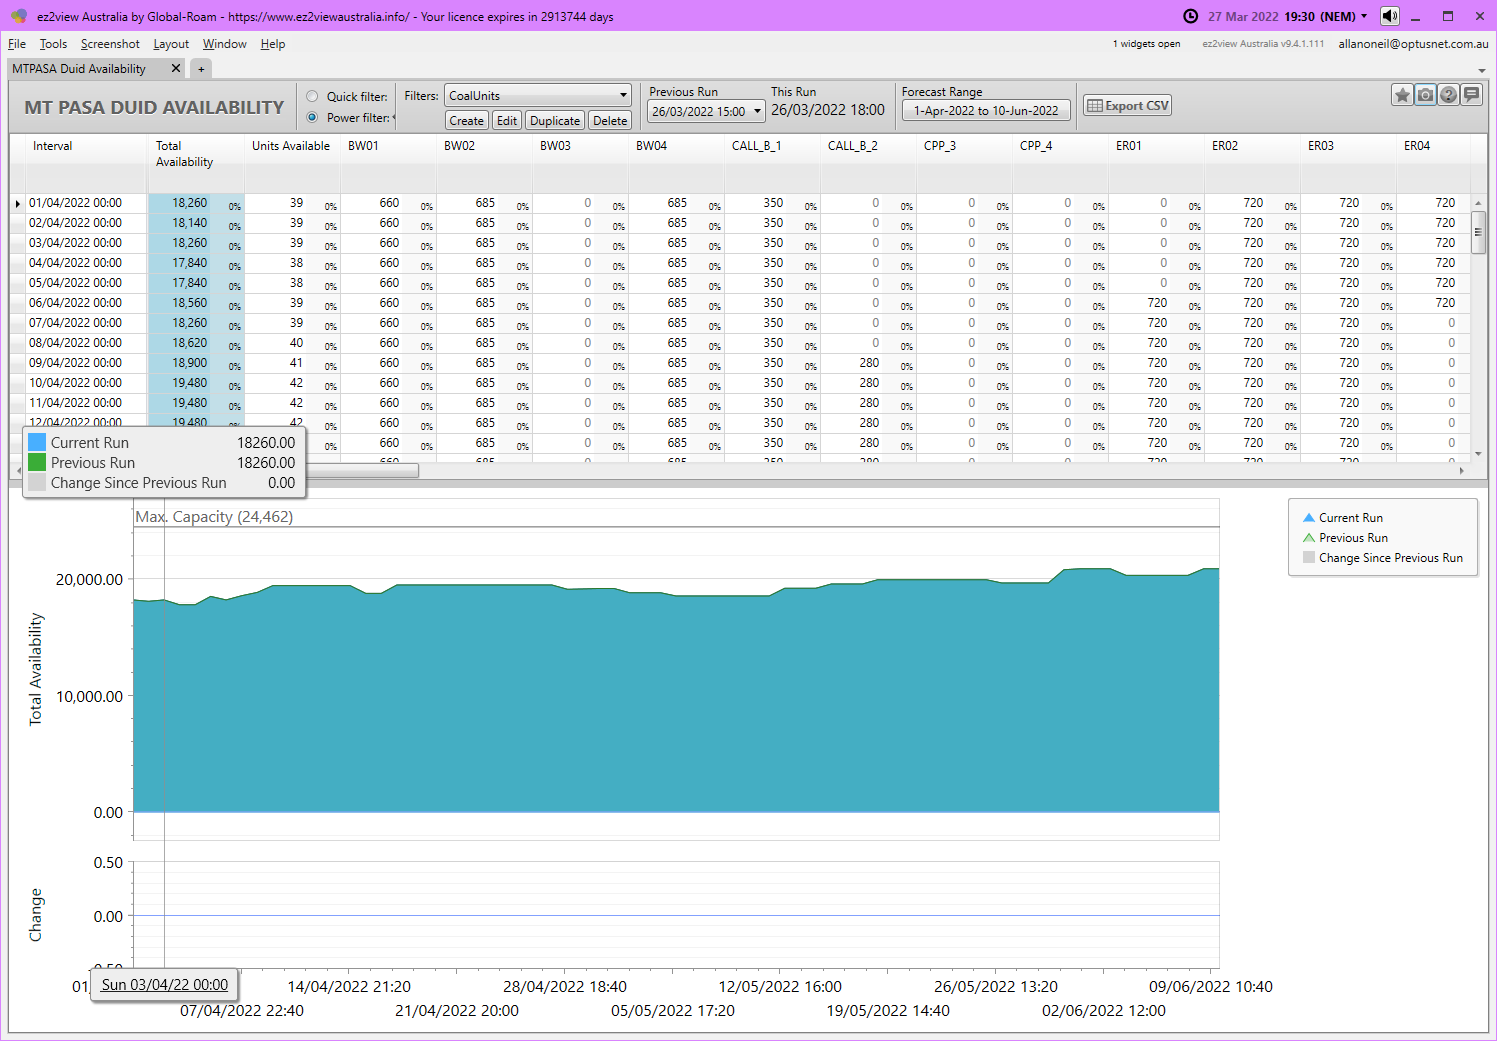
From the chart we can see that 18,260 MW of coal-fired capacity was projected to be available at the start of the quarter, amounting to 81% of fleet capacity, with 19% unavailable. Some of this “known” unavailability was due to planned major maintenance (for example at AGL’s Bayswater unit 3 or EnergyAustralia’s Mt. Piper unit 2), while some was the result of “forced” outages current at the start of the quarter due to breakdowns of various kinds, both short-term and long-term (for example the major rebuild required at Callide unit 4 after its catastrophic failure over a year ago).
By the end of the period charted (today), the expectation for availability was just over 20,900 MW or 93%, with units returning from planned maintenance and repairs. This should be seen as a best-case estimate at the time, as it’s not realistic to forecast the timing and extent of the future forced outages which are inevitable across a coal fleet of 47 generating units.
Using other AEMO data on actual availability as the quarter unfolded, summarized at daily level, I’ve compared this outlook to reality in the next chart below. “Actual availability” represents the maximum level that generators declared they could provide in real time (here expressed as a daily average). Not all this capability was dispatched, as that depends on market conditions – demand, spot prices, generator bid prices and so on.
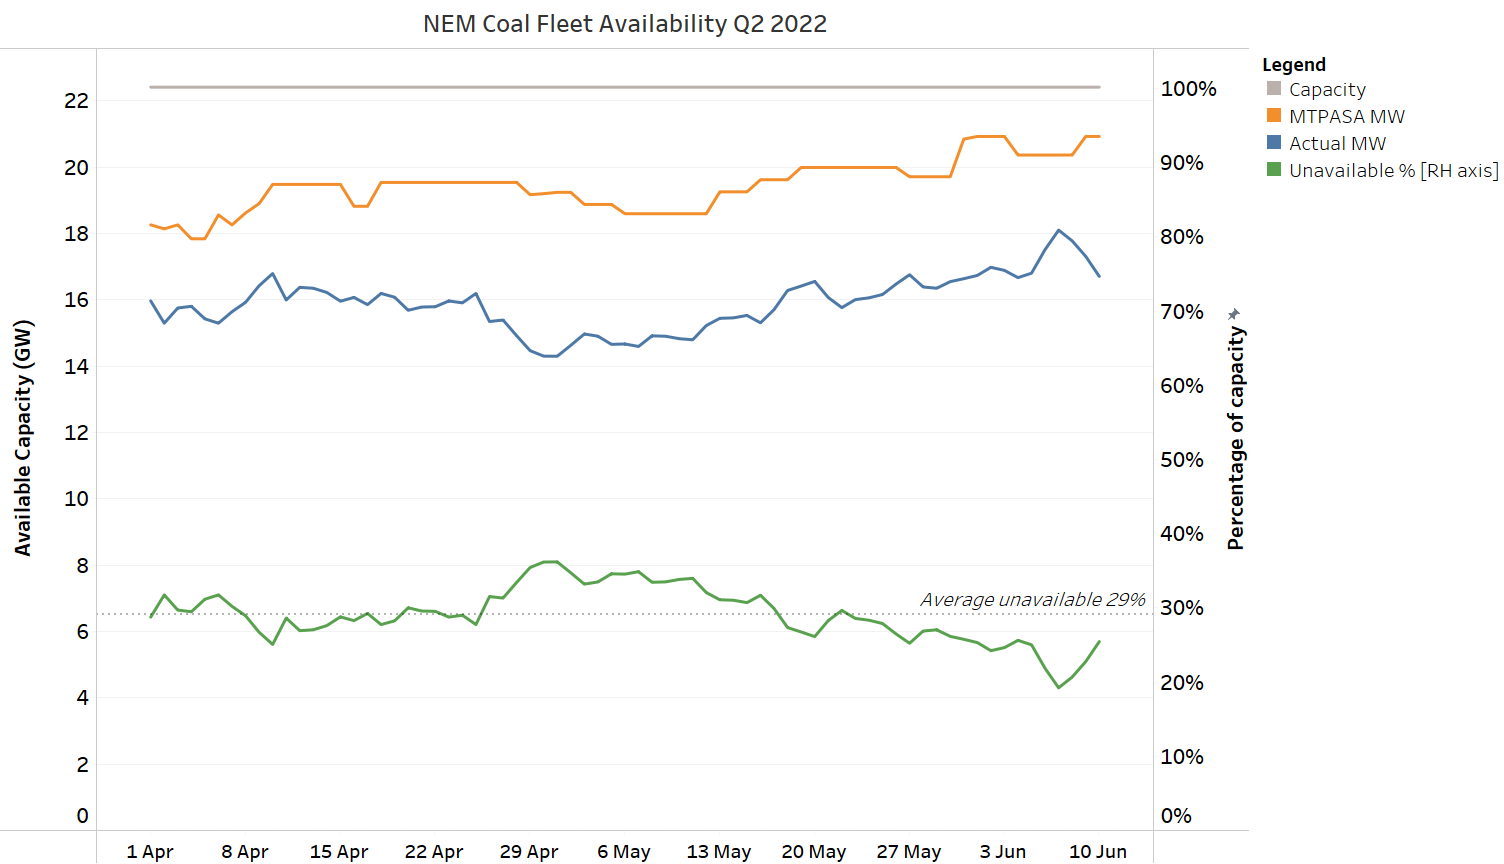
Here we see that actual availability, the blue line, sat well below the start-of-quarter forecast and reached a nadir of just over 14 GW, 64% of (practical) maximum at the end of April. From there until a couple of days ago the data show a slow but steady improvement to 80% availability earlier this week, and then a sudden reversal – just when things were looking better.
Some observations
Availability performance was poor
Availability at 71% – measured as available generation vs fleet practical capacity – is a poor outcome. Even allowing for known long term outages such as Callide C4 and major maintenance outages at other stations over the period, one would hope to see availability exceeding 80-85% from a coal generation fleet performing well. The period in late April – mid May where unavailability exceeded 30% was particularly sub-standard.
A persistent gap to forecast
Throughout the period shown, actual availability sat consistently 2-4 GW below the MTPASA projection with a maximum gap of nearly 5 GW at the end of April. This gap effectively represents:
- unplanned outages,
- planned outages running for longer than expected,
- derating of unit maximum outputs – often due to technical problems or perhaps fuel supply issues – and
- in a few cases “economic withdrawal” where units were technically available to run if required for supply reliability, but were not offered into the market – for example this applied at times to units at Gladstone power station. Such offer behaviour might again reflect fuel supply limitations.
This gap to forecast represented 16% of the total 29% unavailability for the quarter to date, and is far higher than would be expected for an adequately performing coal fleet. An overall forced outage rate well under 10% would be an appropriate goal.
It was also surprising to see this gap start the quarter as high as it did at over 2 GW, as this was relative to forecasts submitted only a few days earlier.
Things can change rapidly
Having crawled to 80% earlier this week, fleet availability has suddenly dipped back towards 70% with unexpected outages in the last three days of two Bayswater units (prompting my tweet) and the remaining Callide C unit – totalling 1,765 MW. Hopefully these are all short outages as we head solidly into winter, particularly as AGL has announced that its Loy Yang A2 unit which went offline with a major electrical failure on April 15th will now not return to service until the second half of September at the earliest.
The outlook from here
Finally, what’s the latest set of MTPASA forecasts saying about the outlook for coal availability over coming months? Here’s the previous chart extended out to the end of August, obviously with no actual data for the forecast period, but with the most recent MTPASA forecasts spliced in – you can see that at the start of the forecast period, those forecasts more closely reflected the availability position as of a few days ago, but once again the forecast got “mugged by reality” with a gap of about 1.7 GW to today’s actuals, presumably because of the three recent outages flagged above.
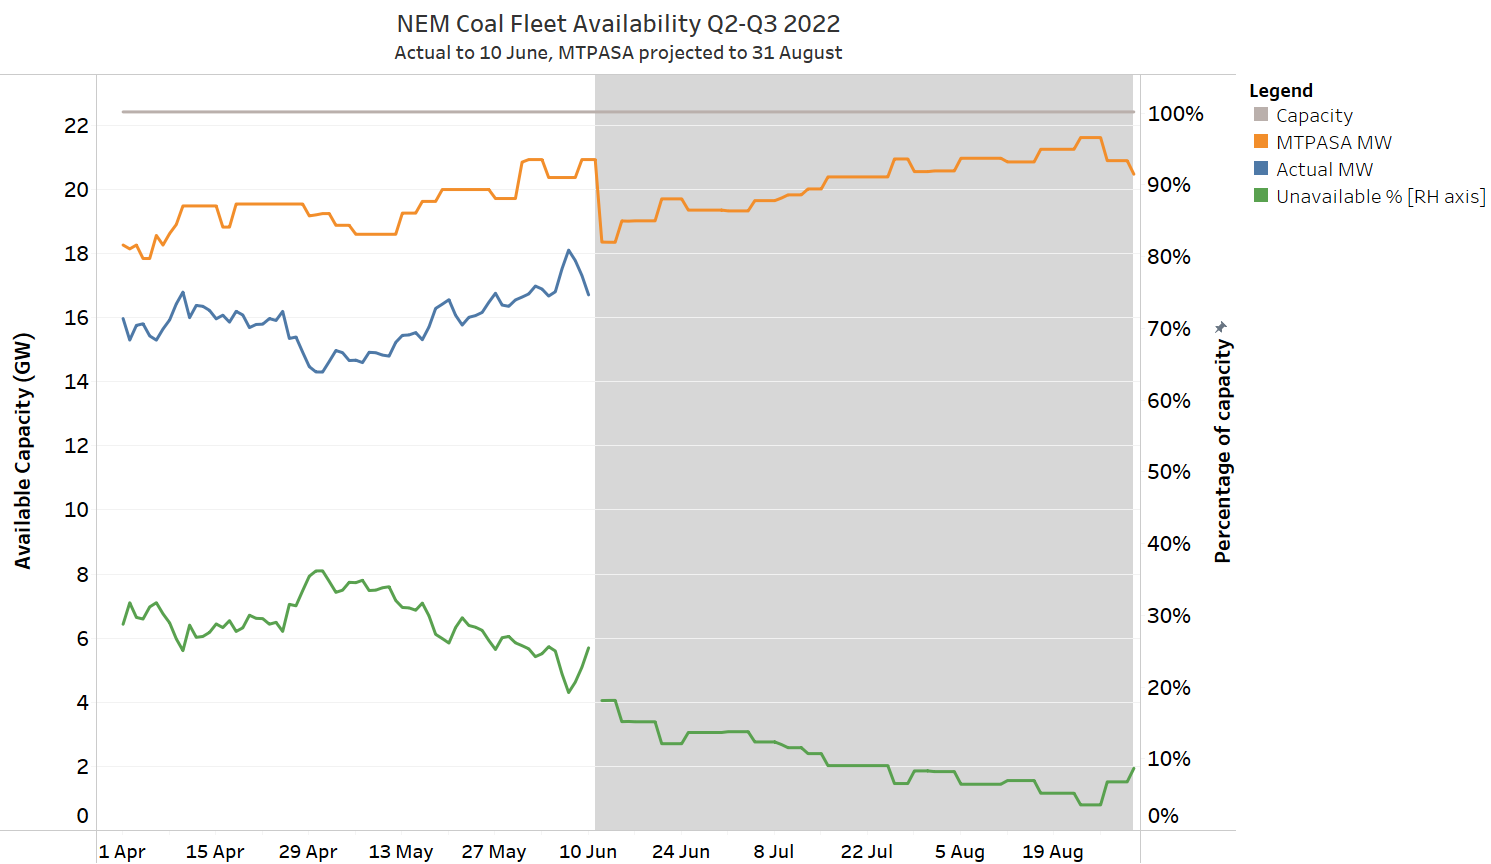
While we know that actual availability will almost certainly be lower – because it excludes future unplanned outages – let’s nevertheless hope this forecast is a much better predictor of reality than it has been over the past few months!
=================================================================================================
About our Guest Author
 |
Allan O’Neil has worked in Australia’s wholesale energy markets since their creation in the mid-1990’s, in trading, risk management, forecasting and analytical roles with major NEM electricity and gas retail and generation companies.
He is now an independent energy markets consultant, working with clients on projects across a spectrum of wholesale, retail, electricity and gas issues. You can view Allan’s LinkedIn profile here. Allan will be sporadically reviewing market events here on WattClarity Allan has also begun providing an on-site educational service covering how spot prices are set in the NEM, and other important aspects of the physical electricity market – further details here. |
“…one would hope to see availability exceeding 80-85% from a coal generation fleet performing well”. I thought the capacity factor for coal was 50-80%, so 71% is about average, especially for aging infrastructure.
Dave – thanks, but you might be thinking of actual capacity factor which measures energy actually dispatched relative to nominal capability, and will always be lower than available capacity factor because of market offloading – generators don’t always operate at their available maximum and we see plenty of swing on the NEM coal fleet. But available CF is a more appropriate metric to consider generation reliability. Allan.
Great article Allan. One cant help but observe the coincidence of outages and high coal prices at the start of winter although I have no doubt coal availability at the mine mouth and rail availability to move it to a power station are also down. I do wonder whether the bayswater issues will further impact agl profitability.