
Quick summary
Automatic capping of NEM spot market prices commenced on the evening of Sunday June 12th in Queensland, and 24 hours later in the other mainland NEM states. As has been widely discussed, the volumes of generation capacity offered into the spot market started to fall over subsequent days. Using AEMO market data, this post steps through snapshots of the aggregate volumes of generation offered in each region, identifying the timing and extent of these withdrawals, as well as the impact of AEMO’s directions to participants to increase their availability to the market.
The amounts of withdrawn generation progressively increased up until AEMO’s decision to suspend the spot market at 2pm on Wednesday June 15th, reaching levels as high as 4.3 GW in New South Wales which represented over a third of capacity able to run in that state.
A snapshot of aggregate bid volumes from New South Wales “peaking” gas-fired and hydro generators across these events shows the impact of volume withdrawals, and hints at one possible reason for the increasing volumes withdrawn. Generators with limited supplies of fuel or water generally manage supply levels by re-bidding market offers to higher prices as their remaining fuel or water stocks drop, which normally reduces their market dispatch levels as lower-priced generation is dispatched before them. This still leaves their re-priced capacity available to run in the market if necessary.
But once enough generators start withdrawing significant capacity offered to the market, this can require remaining generators to “pick up the slack”, and re-pricing of offers might become a less effective mechanism for managing fuel or water levels. This can end in a “rush for the exits” or prisoners’ dilemma, as more generators withdraw volumes from the market in response to rundown of fuel or water stocks, essentially forcing remaining “energy-limited” generators to follow.
The longer version
In this post I’ll try to broadly quantify the timing and extent of those “withdrawals of generation from the market” that we’ve read and heard a lot about over the last week, occurring since the NEM spot market price was capped – initially in Queensland from 18:55 on Sunday evening (June 12th) and then progressively in other mainland NEM regions starting around 24 hours later over Monday evening (NSW at 18:35 and then 21:50 for SA and 21:55 for VIC). This culminated with AEMO determining to suspend the NEM spot market across all regions at around 2pm on Wednesday June 15th.
Very briefly, AEMO decided that the spot market had become “impossible to operate” as the (largely manual) task of issuing directions to generators to make capacity available, where capacity normally offered through the spot market bidding process was falling, had created an operating environment too risky for the physical supply security of the power system.
If I tried to dispel every wrong notion that’s been aired about these events, provide a full timeline of the leadup and trigger points, or start discussing the detailed mechanics of Cumulative Price Thresholds, Administered Price Periods, Administered Price Caps, compensation regimes, NEM spot market suspension and so on, this post would never finish. All I’ll do here is try to capture how this played out in terms of generation capacity offered into the market, the rough impacts of the directions issued by AEMO in response to forecast Lack of Reserves, and how this evolved up to the point of market suspension.
Quantifying withdrawals
There are two broad ways to approach this, a detailed “bottom-up” view of generators’ bidding profiles and dynamics through this period, or a “top-down” view of how the aggregate capacity offered by generators to the spot market changed as events unfolded. Again, stepping through the first approach would result in a very long post indeed, and probably risk misconstruing at least some offers and rebids made by individual participants. Instead a “helicopter view” seems a better place to start, leaving the detailed unpicking of events for another time (and analyst).
Even at an aggregate level it’s not feasible to step minute by minute through events, and I’ve instead collated a short set of snapshots of generation volumes offered over the period which picks up some of the most notable changes. This is derived from AEMO’s “PDPASA” datasets which are issued every half hour and project supply and demand conditions over a horizon of around 16 to 39 hours (the horizon varying as the dataset runs to the end of either the current 4am-4am “trading day”, or to the end of the following trading day, depending on the time of forecast issue).
From these datasets I’ve focussed on two aggregate data series:
- Market offers of scheduled generation capacity by region – derived from self-declared “maximum availability” of these generators (note this does not included projected output from semi-scheduled wind and solar generators, which are handled differently in the PASA process), and
- Declared “PASA availability” which is capacity technically available to generate, whether offered into the market or not. At any given forecast point this should always exceed or be equal to market-offered availability.
It is the first data series of market-offered available capacity that drives AEMO’s assessment of system reserves in each region, and where these are inadequate, its decisions to direct generators to make additional capacity available, or take other steps to maintain system security. Again for reasons of length and conciseness, I will take the framework for AEMO’s reserve assessments and directions as a given and not go into details here.
Charts of course
(Actually only one chart, but repeated with updates and annotations. And did anyone get the lame pun?)
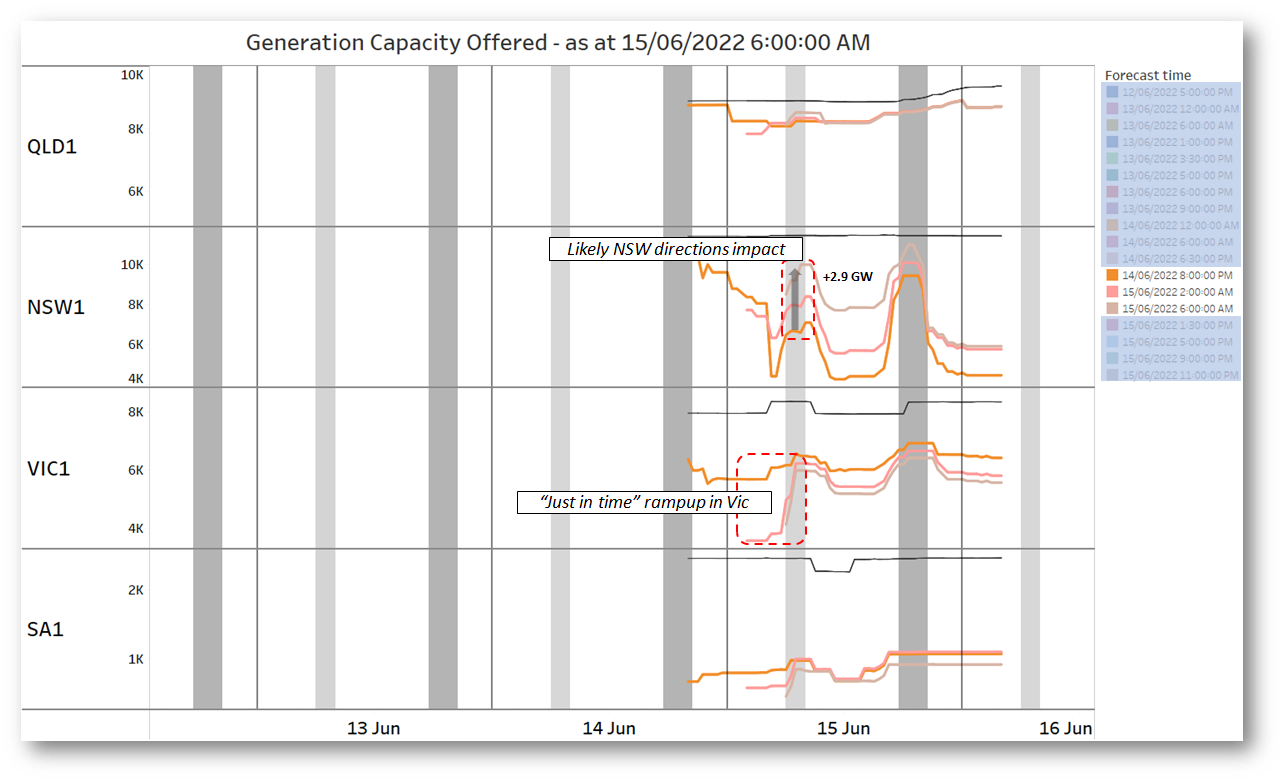
Let’s summarise how available generation capacity was looking across NEM mainland regions just before the 6am-8am morning peak on Monday June 13th (remembering that only QLD was under Administered Pricing at the time):
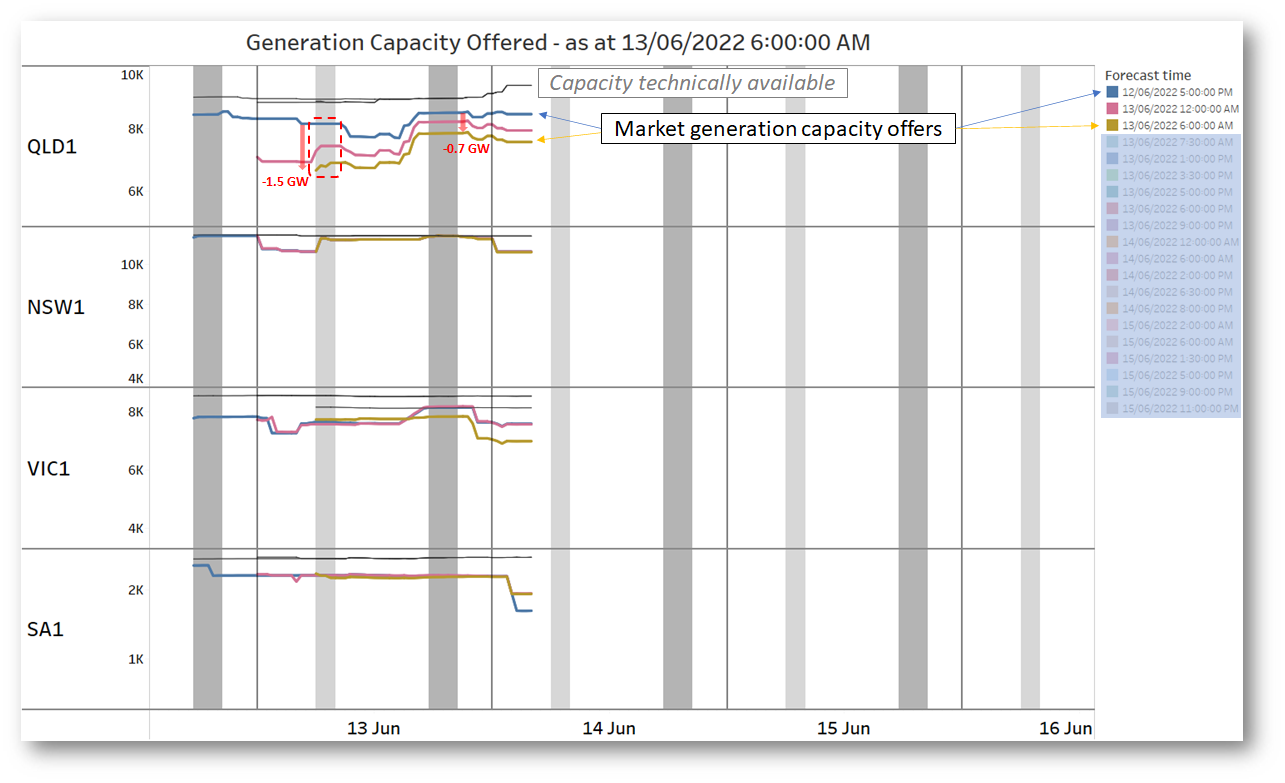
The coloured data series represent market-offered aggregate scheduled generation capacity, keyed to selected forecast times in the legend. The upper grey data series are aggregate technically available capacity from the PASA data. For each day on the horizon the shaded bands pick out a 6am-8am morning peak and a 5:30pm-8:30pm evening peak.
Obviously demand, projected contribution from wind and solar, and other things like regional interconnector capacity are highly relevant to AEMO’s overall assessment of system reserves, but here we’re focussing exclusively on the dynamics of offered capacity.
The most recent data shown on this snapshot represents the position at 6am on Monday, and includes a couple of earlier market-offered capacity aggregates for reference and comparison (remembering that there’s actually a new PDPASA dataset every half-hour – including every instance would make the chart unreadable, if it’s not already). Spot market participants can update their offered availability at any time by rebidding (subject to compliance with the National Electricity Rules of course), so aggregate availability offered can be quite dynamic.
Annotations on the chart highlight some changes seen in Queensland generation capacity offers following on from the automatic Administered Price Cap of $300/MWh kicking in from 6:55pm the previous evening. Compared with the earlier 5pm forecast:
- available capacity offered over the Monday morning peak had dropped by ~1.5 GW
- at this point, offered availability for the Monday evening peak was down around 0.7 GW.
By contrast, aggregate available capacity offered in other regions had shown much smaller changes.
Queensland’s generation capacity reduction in the morning peak already created some significant system security issues as higher transfers from New South Wales were necessary to balance demand, but for some periods exceeded secure transfer limits between the regions.
Let’s roll the chart forward into the Monday evening peak with some offer levels at intermediate times shown, and some earlier ones dropped off:
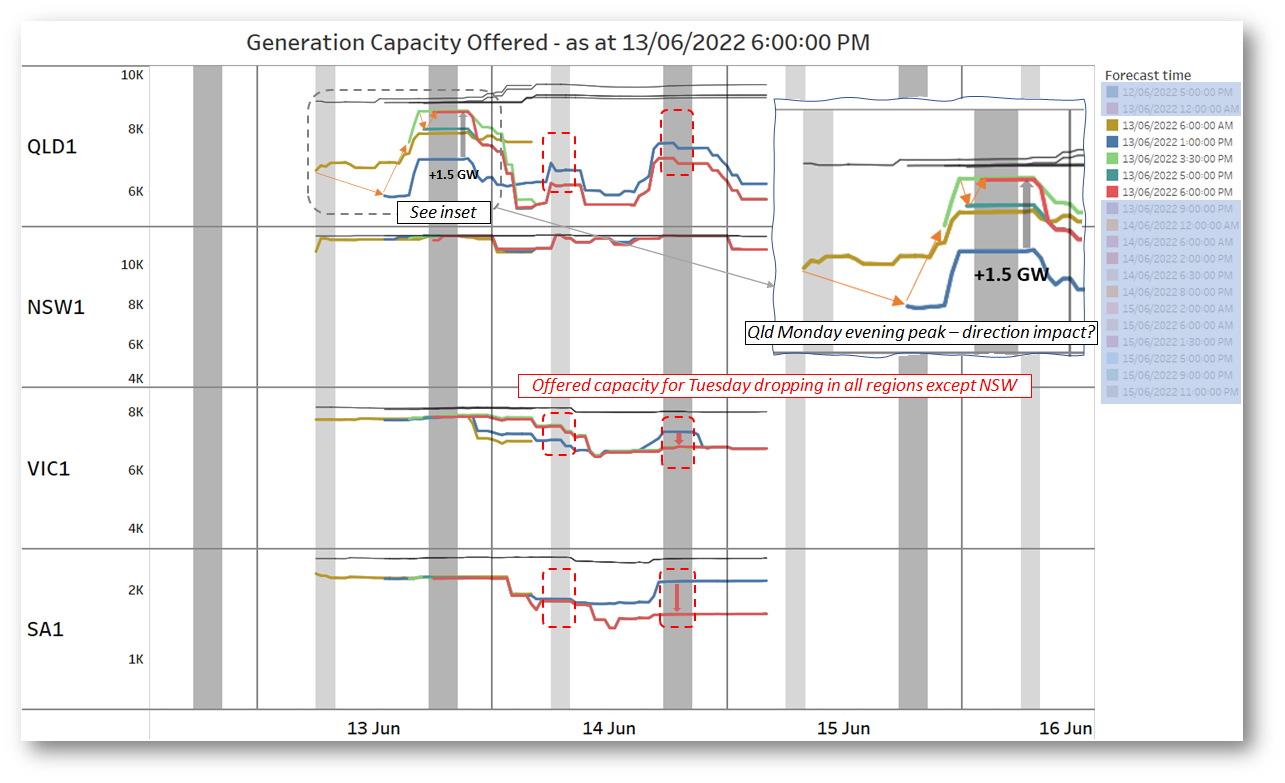
Not as busy as the AEMO control room must have been, but still a very busy chart. I’ve tried to highlight two key features:
- running past the morning peak, by the 1pm forecast (blue series) there had been a further large drop in offered capacity for the evening peak – about 0.8 GW – but then by the 6pm forecast (red series) a 1.5 GW recovery in offered generation levels. This in all likelihood includes the net effect from one or more AEMO directions to generators (see Market Notice 97068 issued at 12:55pm on Monday).
- With projections now available for the trading day commencing on Tuesday at 4am, we see significant reductions from previous levels (and from typical values) not only in Queensland, but in Victoria and South Australia as well – no response in New South Wales though.
Rolling forward to the Tuesday morning peak, at 6am we see more changes in the picture:
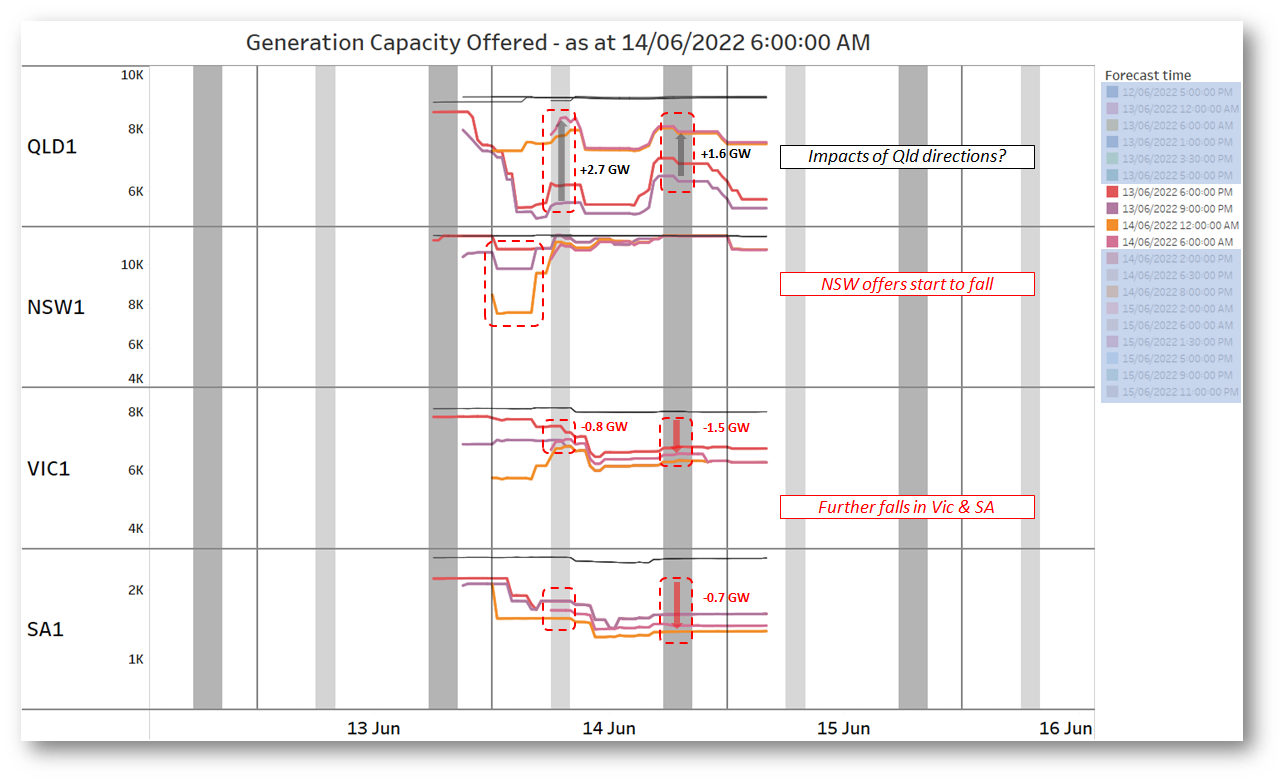
Recall that by this time, automatic operation of the Cumulative Price Threshold had led to spot price capping in the three other mainland regions.
Here we see that:
- after some further reductions in the Monday 9pm projection (purple series), there had been some very large reversals (increases) in offered capacity in Queensland across Tuesday, up 2.7 GW from its low point for the morning peak and 1.6 GW in the evening peak. Again very likely the net effect of AEMO directions to generators.
- there are further falls in capacity offered by generators in Victoria and South Australia, particularly affecting the Tuesday evening peak, and for the first time we see material changes in offered New South Wales generation, although not yet signficant in the peak periods.
This is as good a point as any to mention one major impact of these reductions in offered capacity: the issue of multiple Lack of Reserve market notices by AEMO. The automated PASA processes spit out such notices in response to projections of inadequate system reserves – and of course the huge swings in offered capacity we see in these charts resulted in a blizzard of LOR notices and updates over this period. One of the many unanticipated consequences of the underlying events was that the PASA framework had no provision to account for directions already made or those planned to be made by AEMO to bring on additional generation. This meant that the extent of reserve shortfalls and potential load shedding summarised in the auto-generated Market Notices was often materially overstated (see AEMO Market Notice 97340 issued at 4:33pm on June 14th).
Forward to the Tuesday evening peak, by which time the projection for Wednesday had also become available, showing a massive drop in offered New South Wales generation:
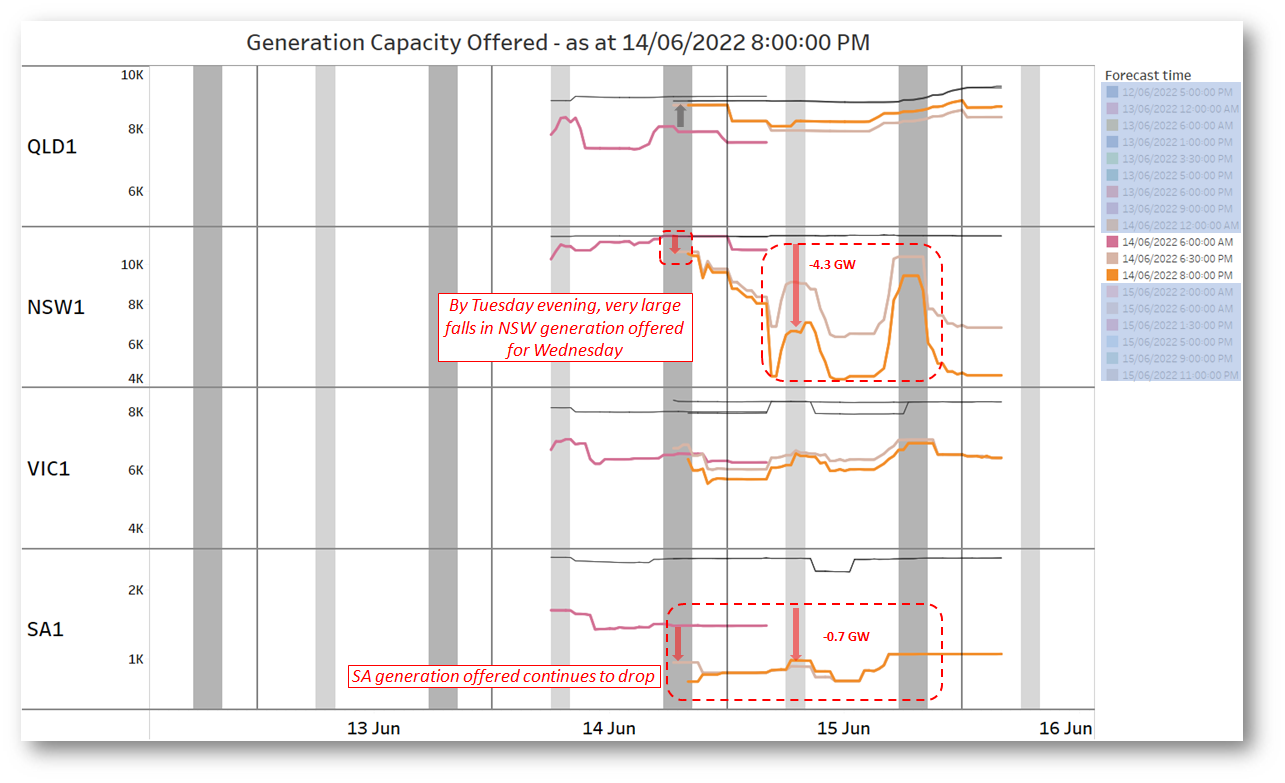 If it wasn’t squarely under consideration before these projections came in, this must have been the sort of picture that brought market suspension fully into the frame for AEMO, with reductions of the order of 5 GW, primarily in New South Wales. Conversely, the projected offering in Queensland had continued to improve – whether this represented directions or not I haven’t investigated.
Before the Wednesday morning peak, AEMO had obviously taken action in New South Wales, as well as other regions:
 Note that volumes offered in Victoria and South Australia had continued to decline, although by lower net amounts.
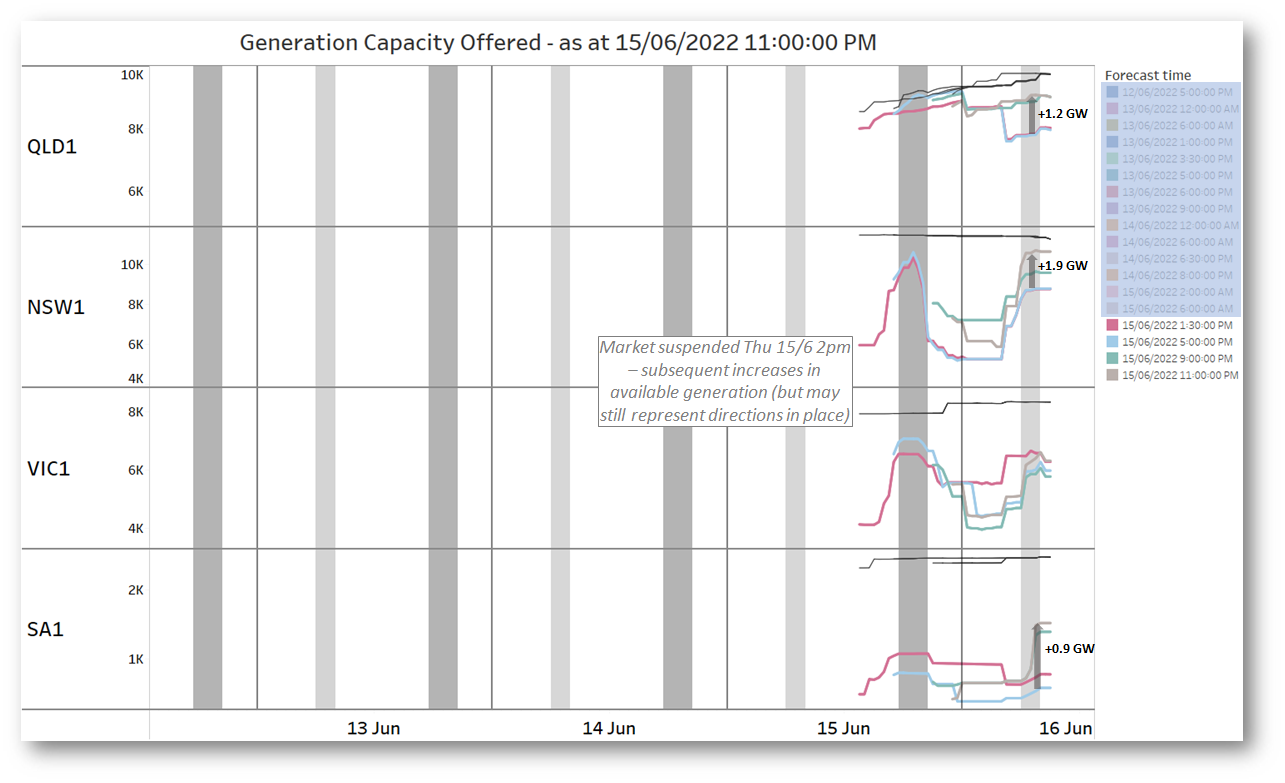
As we know, AEMO suspended the spot market at 2pm on Wednesday, however all the underlying dispatch processes continue to operate in order to physically run the power system, generators continue to offer availability into those processes, and we can update the picture as it evolved through the evening peak and into the following day:
To finish, a look back at some bids
While I’ve concentrated on the top-down view of generator behaviour rather than bottom-up bidding for reasons of time, space, economy and on legal advice, I will finish with an aggregate view of as-dispatched bids leading up to and through these events, for all the major gas-fired and hydro power stations in New South Wales – simply to pick one region and one group of generators likely to have been affected by both:
- the impacts of price capping under the Administered Price Cap provisions;
- limited fuel or water supplies (see below).
This chart from ez2view doesn’t show the evolution of offers across time, simply the final market-offered volumes and dispatch levels for this largeish set of generators:
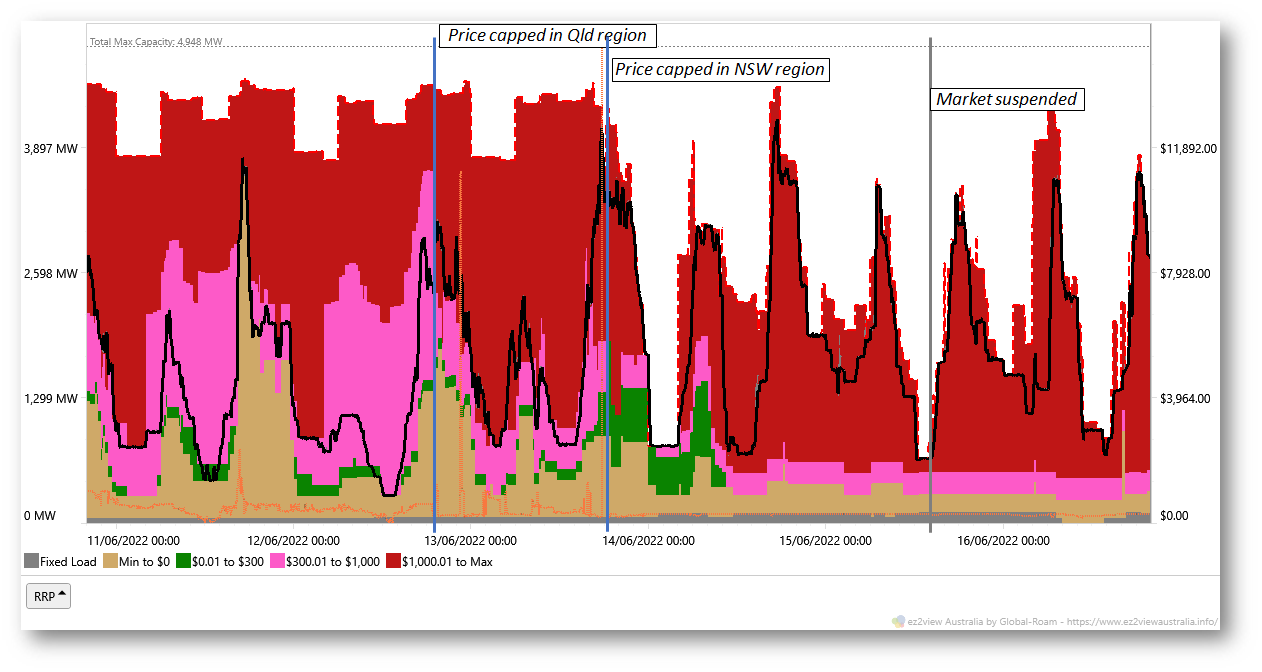 A couple of key takeouts from this chart:
- offer levels – in particular availability, represented by the top boundary of the bid volumes – changed substantially after the New South Wales price was capped from 6:25pm on Monday June 13th, however
- dispatched volumes actually increased substantially.
The fact that many of these generators are energy limited – only able to run for certain maximum times at full output level due to things like limited water reserves for hydro plant, gas availability or even pipeline pressures and linepack for gas-fired plant, hints at one reason (but certainly not the only possibility) that the market saw compounding withdrawals of offered capacity. There is a form of prisoners’ dilemma affecting energy limited generators once some participants withdraw from the market and leave the dispatch task to others: the market dispatch process will continue to draw on whatever generation is still bid available and needed to meet demand.
The NEM dispatch process has no inbuilt recognition of cross-temporal energy constraints and doesn’t seek to internally optimise limited energy reserves. Normally generators manage their fuel or water position through pricing of their market offers, repricing upwards – even to the market cap – if fuel is scarce. But in periods where there is a near-deficit of generation – because of withdrawn capacity – everything offered available to the dispatch process would be dispatched and offer price may no longer be an effective rationing mechanism for generators with limited fuel or water. So if too many generators have already “headed for the exits” by withdrawing capacity, remaining energy-limited generators may almost necessarily have to do the same. Paul McArdle’s recent article on bidding by batteries touches on some of these points, and goes into further detail.
But that’s enough detail for this piece, I’ll end here. Thanks for watching along.
=================================================================================================
About our Guest Author
 |
Allan O’Neil has worked in Australia’s wholesale energy markets since their creation in the mid-1990’s, in trading, risk management, forecasting and analytical roles with major NEM electricity and gas retail and generation companies.
He is now an independent energy markets consultant, working with clients on projects across a spectrum of wholesale, retail, electricity and gas issues. You can view Allan’s LinkedIn profile here. Allan will be ocassionally reviewing market events here on WattClarity Allan has also begun providing an on-site educational service covering how spot prices are set in the NEM, and other important aspects of the physical electricity market – further details here. |
Leave a comment