I was showing some of this to a client* earlier today, and thought it would be of interest to share more broadly.
* a client who’s looking to upgrade from one of our other products to ez2view (something which is increasingly happening)
With spot volatility re-occurring this evening as I type this, I thought it would be useful to wind back the clock in ez2view via the ‘Time Travel’ function to show some of what’s visible on a ‘Next Day Public’ basis with bidding information for supply-side DUIDs (including Negawatts) across QLD and NSW.
What follows are four points … but keep in mind that there’s much more that could be explored.
(A) Supply stack for 17:25 on Tuesday 3rd May 2022
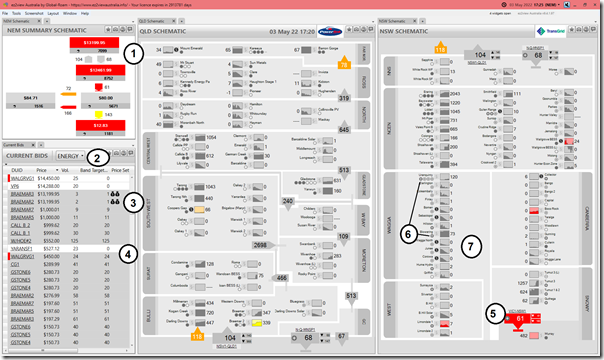
As noted yesterday, the volatility kicked off in earnest from 17:25 with prices up above $10,000/MWh in both QLD and NSW. Here’s a snapshot of this particular dispatch interval via time-travel in ez2view:
It’s a busy display, and readers won’t have the benefit of the mouse-overs and hyperlinking available in the software itself, but with the numerical tags I can draw your attention to the following:
1) Prices are up over $10,000/MWh in both QLD and NSW … and much lower in VIC, SA and TAS
2) The ‘Current Bids’ widget shows a bid stack for just supply-side DUIDs in the QLD and NSW regions:
(a) with the bid tranches dispatched (i.e. ‘Band Target’ > 0) shaded in grey
(b) highlighting very thin supply at the top end of the bid stack … even though demand is quite modest.
3) The money bag icons reveal that AEMO ‘Price Setter’ data is showing the two operating units at Braemar A were setting the price in both QLD and NSW (one of the ‘Slightly Complex’ scenarios outlined here).
4) For clarity, the bid tranche for Yarranlea Solar Farm at $527.12/MWh at the QLD RRN has no volume dispatched because the sun has set, and the ‘VOL’ column shows the bid tranche from the Bid File prior to adjustment by ASEFS (or increasingly the self-forecast).
5) Also noted on Monday and reiterated yesterday, the import capability from VIC into NSW was severely restricted as a result of the ‘N::N_RVYS_2’ constraint equation.
6) That same constraint equation is having the effect of potentially trying to ‘constrain down’ output of a number of NSW DUIDs:
(a) These include the Blowering and Uranquinty units highlighted.
(b) This particular scenario is what we have in mind in fleshing out the ‘Constraint Dashboard’ widget in ez2view v9.4 (clients who wish to work with us on this should contact us).
7) The ‘$’ symbols on the schematic in NSW and QLD signals a change in bid for this dispatch interval … which is increasingly a ‘noisy’ auto-bid that was discussed, with reference to GenInsights21, at the AEC webinar last week on Tuesday 26th April 2022.
(B) Supply stack over several hours
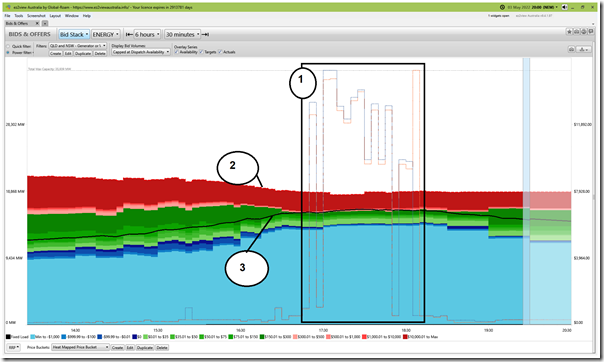
Taking a look at ‘as dispatched’ bids over time in the ‘Bids and Offers’ widget in ez2view we have:
Step 1 = Time travelled to 20:00 yesterday (i.e. so the volatility runs beforehand)
Step 2 = Looked back 6 hours
Step 3 = Filtered to just QLD and NSW regions, and shown bids for ‘supply-side’ units (i.e. both Generators and Negawatt units, due to Tripwire #3); and
Step 4 = Added the trend of both QLD and NSW prices to the mix to draw attention to the focused period beginning 17:25
This is what we see as a result:
From this trend, and with reference to the annotations:
1) We see the pricing corresponds with where the aggregate dispatch is up* in the pink and red of the bid stack,:
(a) Which clearly explains the high prices in both QLD and NSW;
(b) Also note that there is really not a large amount of capacity above that up towards the Market Price Cap.
* also note the ‘not much volume bid in green’ reference discussed around the ~22:31 mark of this presentation to the Smart Energy Council audience on our GenInsights21 report.
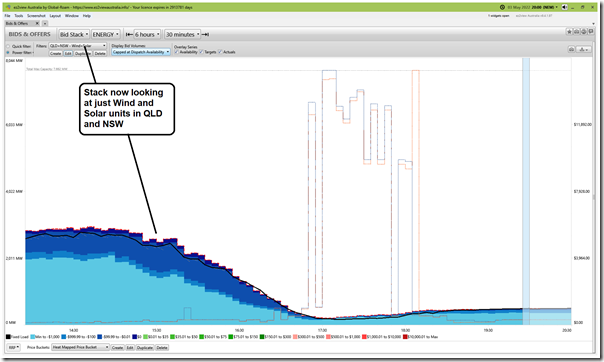
2) We see the aggregate effective volume offered to the market declining prior to this volatile period:
(a) it’s about a 2,000MW reduction in supply at any price
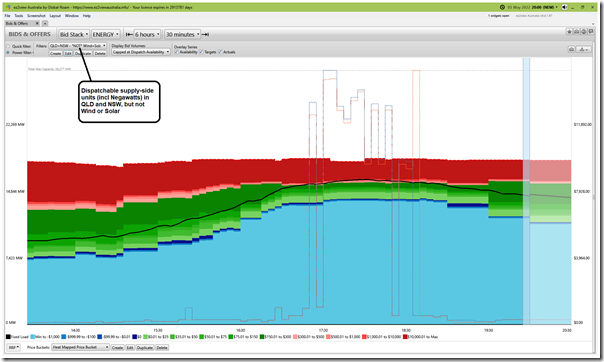
(b) this corresponds to the declining volume offered by Wind and Large Solar plant across QLD and NSW as shown here:
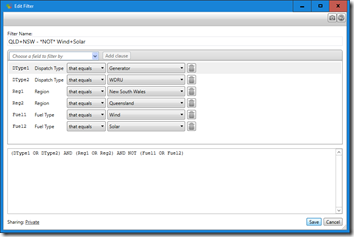
(c) To show the net difference, here’s the specific filter used to create a ‘NOT Wind and Solar’ inverse of the chart above:
… as a result of which (ez2view can accommodate quite complex Boolean filters) we see a flatter aggregate offer trend** through the 6-hour period:
3) At the same time as we see the significant increase in required dispatch** through the evening peak period.
** note the ‘Aggregate Scheduled Target’ reference discussed around the ~26:36 mark of this presentation to the Smart Energy Council audience on our GenInsights21 report.
(C) Negawatts dispatched
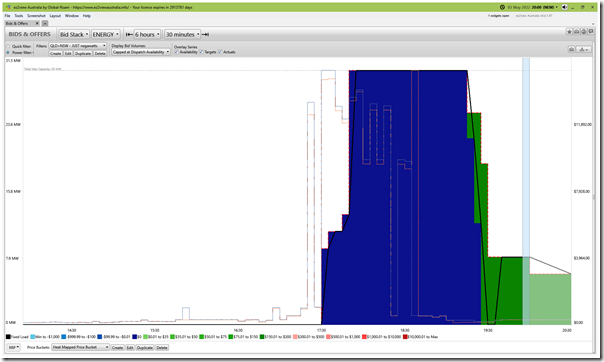
Continuing to filter the above, we see that there was 30MW in total dispatched across Negawatts registered in NSW (noting again that there are none yet registered in QLD for reasons unknown):
Whist the volume was bid at $0/MWh during the period of volatility, we see that the price offered shifted up to $248.36 at the NSW RRN from 19:30, some of which was still dispatched from 19:40.
(D) Don’t forget about FCAS
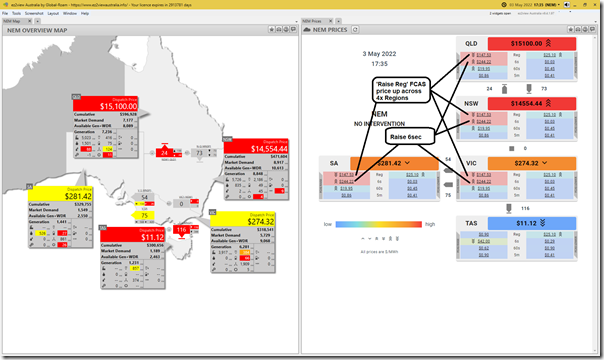
Finally, here’s a snapshot from the 17:35 dispatch interval showing that, whilst ENERGY prices were up at the Market Price Cap in QLD, and not far below in NSW, it was not the whole show:
In March 2017 Jonathon Dyson wrote ‘Let’s talk about FCAS’ and in February 2020 Allan O’Neil wrote ‘Don’t forget about FCAS!’ … both in part because it was an often overlooked part of the market but (as discussed with the AEC Audience with respect to GenInsights21) is becoming an increasingly significant/important one.
Yesterday evening we saw FCAS Raise prices elevated:
1) Which could be a revenue opportunity
2) But it might also be a significant unexpected cost impost (as Marcelle drew from the GSD2020 to discuss here for Wind Farms across the NEM on 18th May 2021).
—
…. and that’s all for now, folks!


Leave a comment