Note, with respect to this article (and others on WattClarity) that all times are in ‘NEM Time’.
Last week experienced price volatility over several days in the week in the NSW region of the National Electricity Market:
1) Monday 14th December was subdued
2) There was a single price excursion in the 12:50 dispatch interval on Tuesday 15th,
3) Wednesday 16th December saw a few discrete excursions (at 08:10, 12:25 and then 13:15 to 13:35),
4) Thursday 17th December was the most volatile day, with a first blip at 14:20 but then a sustained bout of volatility starting 15:35 and continuing to 16:40.
(a) It was a day when Reserve Trader was triggered … certainly a surprise to me!
(b) One of the contributing factors on Thursday was the ‘transformer issue’ at Liddell unit 3 which seriously injured a person, and brought the unit down for a long-term outage.
5) Friday 18th December saw a single price spike at 13:10.
Some of these spikes (but not the largest) also coincided with a jump in QLD prices. These events generated a degree of interest in the mainstream media, and commentary online. It also triggered some questions for me – so,
(A) A reminder about complex systems
Let’s start with a reminder that, in a complex system like the National Electricity Market, it’s quite rare that there is a single ‘cause’ to any outcome … such as with the ‘why did we see price volatility last week in NSW?’ question we’ve been asked (and asked ourselves).
Others, perhaps a bit more pointedly, phrase the question in terms of a more inflammatory ‘who can I blame for what happened?’ … and it does not surprise us that these people tend to gravitate to the extreme ends of the Emotion-o-meter. That’s not really where we sit.
I’m posting two separate articles today to address (separately) two of the apparent factors … but keep in mind that there were at least five, in no particular order:
| Factor 1 = Coal Unit Performance |
In this article today, we start to explore some of ways in which coal unit performance in NSW contributed to the volatility outcomes. It appears to be more complex than I have time to get to the bottom of today, but at least this is a start… |
| Factor 2 = Performance of Wind and Large Solar |
In the other article posted today, we highlight what happened with Wind and Large Solar production, in aggregate, across NSW and how it was significantly lower on Tue 15th, Wed 16th and Thu 17th December than in the days before that, or the days that followed. |
| Factor 3 = Constraints on VIC-NSW … and generation in southern NSW |
Guest author, Allan O’Neil, noted in a comment on the end of this short article about Thursday 17th December that one of the factors was: ‘transmission constraints between southern NSW and the rest of the state, due to outages of some important 330kV lines – again I’m not sure if these are planned or forced outages’ Perhaps food for another article, especially in terms of how the particular constraint equations (and bidding behaviour) delivered an outcome where NSW was exporting to VIC at a time of local (relative) supply shortage, and against the inter-regional price differential. |
| Factor 4 = Constraints on QNI (on some occasions) |
On the occasions when the NSW price spiked and the QLD price did not, then constraints on the QNI interconnector were an issue. |
| Factor 5 = Demand in NSW |
Those ez2view clients accessing their copy of this 14-day trend for NSW can see that last week the temperatures rose in NSW particularly on Thursday 17th December, but even in this case the ‘Demand and Non-Scheduled Generation’ figure (an approximation of Operational Demand that works on a dispatch interval basis) only reached 11,000MW … which is 3,500MW or so below the all-time record. However, even though demand was relatively low, the fact that it was higher than it had been forecast to be (as shown with ‘Forecast Convergence’ in this article on Thursday 17th Dec) would be one reason why the price volatility occurred. |
Readers should note that there are almost certainly more than 5 contributing factors. I listed (just) 5 in order to illustrate that there’s clearly more than just a single factor.
(B) Looking at coal units across the NEM
As readers of our Generator Report Card 2018 would remember, there are 48 discrete coal-fired units remaining in the NEM – 22 are in QLD, 16 are in NSW and there are only 10 remaining in VIC.
Readers of the GRC2018 would also remember that (in Theme 8 in Part 2, and then with longer discussion in Part 4 of the 180-page analytical component of the GRC2018) we invested considerable time in exploring the Availability/Unavailability performance of all 48 x coal units to 31st December 2018. In June 2019 we posted this short excerpt of the 17-year aggregated coal unavailability – aggregate results that surprised some readers.
Should we have time to revisit the analysis we did in 2021 and publish a GRC2020, we will certainly seek to extend this part of the analysis … including getting to the bottom of some differences apparent between regions, and different type, owner (and age) of coal unit. As Allan noted here in August, in reviewing the ESOO 2020, and in particular with respect to a large difference in Forced Outage rate noted for NSW coal compared to QLD coal (and VIC coal) units:
‘My only other comment on this is that the NSW black coal rates, both historically and forecast, seem out(r)ageously bad. The underlying technologies for Queensland and NSW black coal generation are similar and it is very hard to explain why the performance of NSW plants has been and is projected to remain so much worse than those in Queensland, and worse even than that of brown coal generation in Victoria. AEMO has gathered input from the generators themselves in producing these projections and it’s surprising that the expectations of owners in NSW are so different from those in other states.’
In what follows, we’ve used NEMreview v6 to extract the peak daily availability for all 48 units from the start of 2003 (available generation only began to be published towards the end of the year before) in order that we can show the year-on-year comparisons of two measures. I’ve deliberately used ‘peak daily’ in order to ensure the focus is on outages that last longer than a day, to help show more clearly differences in maintenance patterns across years (and seasons).
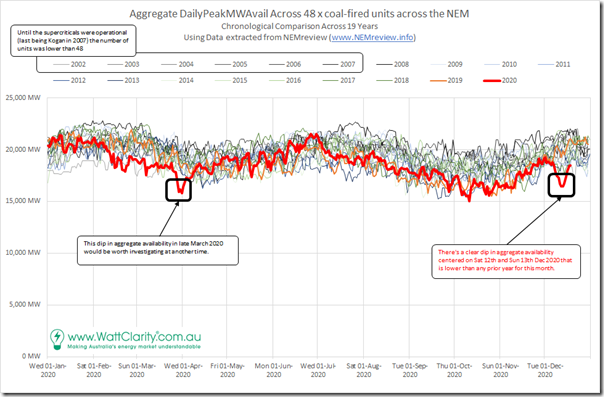
In the first illustration, we show the aggregate peak daily unit availability (i.e. not necessarily synchronised within the day) across all 48 x coal-fired units in the NEM:
As noted on the chart, for the early couple of years the availability will suffer from the absence of some QLD supercritical units (with the last commissioned being Kogan Creek during 2007). There’s a fairly consistent pattern across the years of summer and winter periods seeing higher levels of aggregate availability, with ‘outage seasons’ of autumn and spring seeing lower availability.
However within that seasonal pattern, there is a fair degree of year-on-year variability (a spread being ~5,000MW or more on any given day).
I’ve highlighted, in particular, two particular drops on the red trend line for CAL 2020:
1) The first being a drop in the aggregate level late in March 2020. This is marked through the charts below but I have not invested the time to unpick this, given the focus of this article being December 2020;
2) The second is a pronounced drop centred on the weekend of Sat 12th and Sun 13th December 2020:
(a) which (just) predates the spikes of last week, but suggests something broader going on.
(b) which also drops noticeably below the trend line at that time for every prior year.
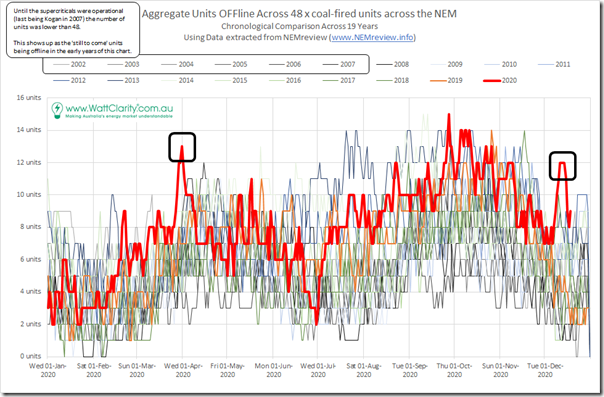
Using the same underlying data, we also produced the following view of the number of units unavailable (i.e. with peak availability = 0MW) across all of the days across the year:
Keep in mind that there are 48 units in total here (except in the earlier years). Those same two points of interest in 2020 are highlighted.
B1) Outage stats of the 22 x Coal units in QLD
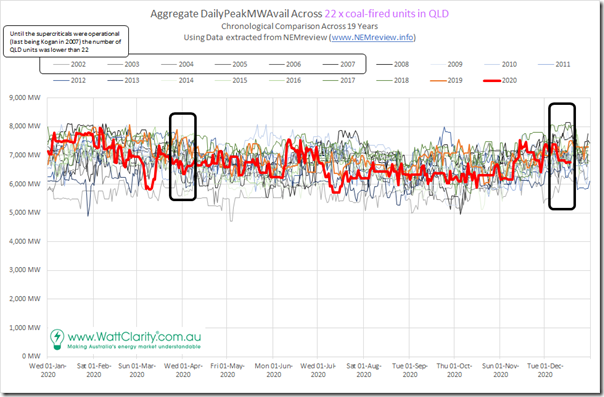
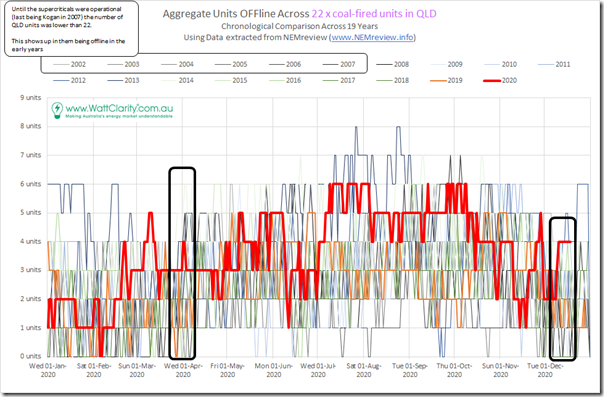
Keen to investigate any effect from the 22 x coal units in QLD, I generated the same two types of chronological comparisons just for those QLD units:
The red line for 2020 is about mid-range through all of the 19 years shown … with no particular dips shown in either of the time points of interest.
Same general story for number of units offline.
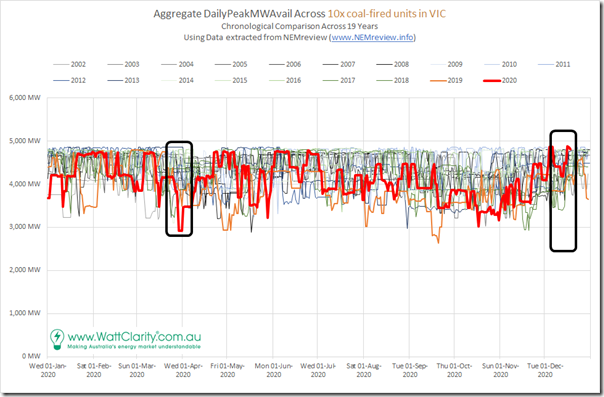
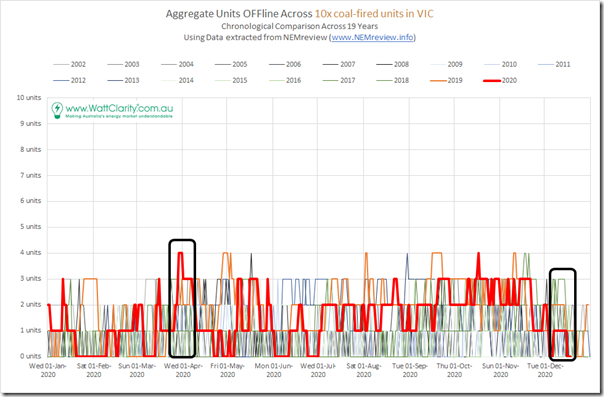
B2) Outage stats of the 10 x Coal units in VIC
Here’s the same sort of view for the 10 remaining coal-fired units:
We see the availability performance of the VIC units has been quite good for December 2020, at least thus far. There was a dip in late March 2020, but that will have to be investigated another time.
There’s only 10 units in VIC, compared with 22 in QLD, which (on another occasion) would be an interesting point of comparison in understanding potentially higher consequence (hence risk) of any coal unit outage in VIC compared to QLD – at least at the current point in time.
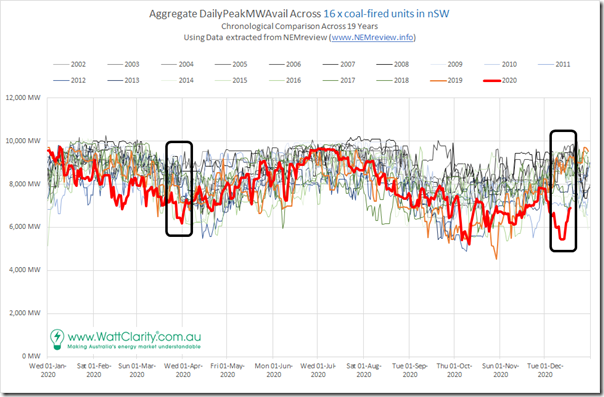
(C) Looking more closely, at these 16 x NSW coal units
Subtracting off the (22 + 10 =) 32 coal units in QLD and VIC leaves 16 coal units in NSW. Given that neither QLD nor VIC units showed any significant dips at the December 2020 point of interest, it’s understandable that we should be able to see this when looking at the NSW coal units … and it does really stand out!
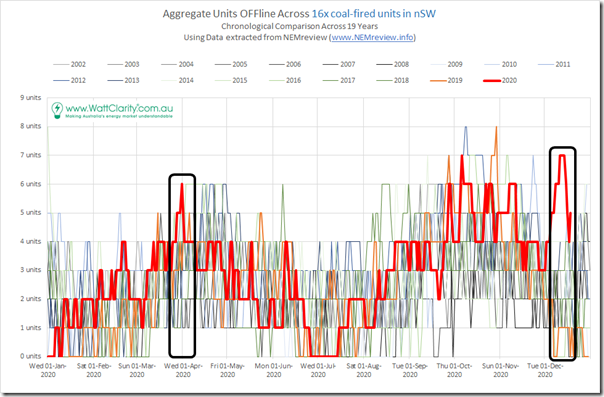
Flipping to the number of units offline, it does spike to 7 units (of 16 in total) over the December period … and we also note that the spring outage season saw many more units offline than autumn 2020 (which might be partly due to restrictions due to COVID, but is also fairly consistent on a year-on-year pattern):
So, with curiosity spiking, we keep drilling in to fine out more…
C1) Liddell’s 4 units
The last coal station to close was Hazelwood (in VIC in March 2017) and the next station slated to retire being the 4-unit Liddell station in the fast-approaching future:
(a) Following shortly after the release of the GSD2019, on 30th January this year we posted an article noting that ‘2019 was not a great year at the Liddell Power Station’.
(b) When we have compiled the results for the follow-on GSD2020, we’ll have be able to look in detail at what happened to Liddell over the 2020 year (very few would expect performance would be much better for a station winding down to retirement).
Release date for the GSD2020 is expected to be Wednesday 27th January 2021, meaning you still have a couple weeks to submit your pre-order and save $300exGST on the price that will apply when the next version of the Statistical Digest has been released.
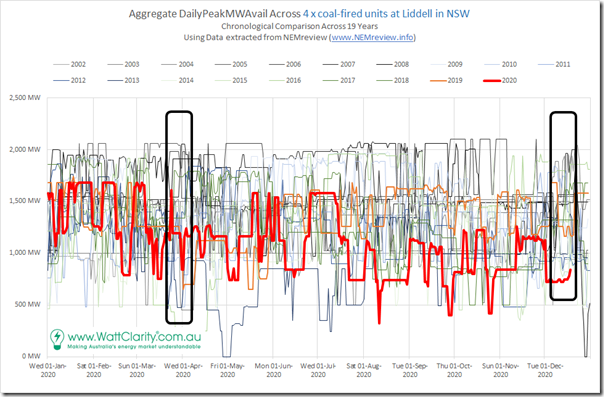
In lieu of the GSD2020 the following chart will help to paint the picture that 2020 was probably even worse than 2019 for Liddell:
During the December period in question the aggregate availability was quite low.
Worth noting the broader pattern that even the highest availability is lower than prior years – due to the downgrading of boiler pressures, and hence output capability, in an attempt to eke out a little more life from the asset.
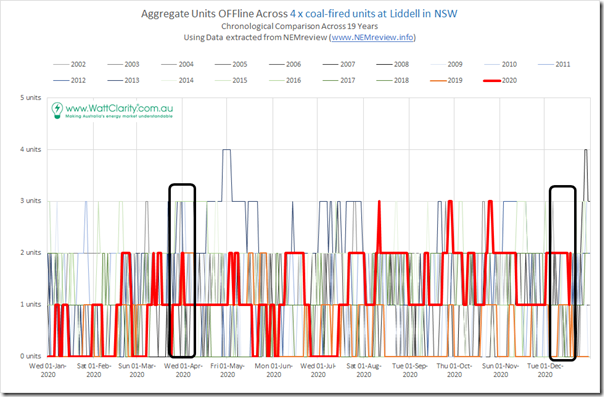
Flipping to units offline, we see 2 units offline through December:
Across the years (even the early ones) we see it’s been not uncommon for 3 units to be offline on the same day.
C2) The others 12 units in NSW (Bayswater, Eraring, Vales Point, Mt Piper)
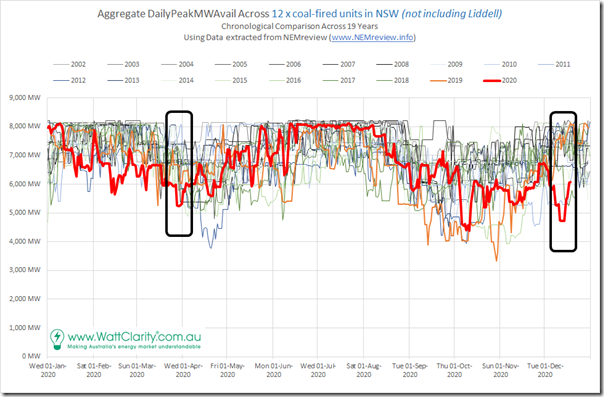
Subtracting off the effect of the 4 x Liddell units, we see what remains is the aggregate availability of the other 12 x NSW coal units … and there is clearly a dip still seen here in December 2020:
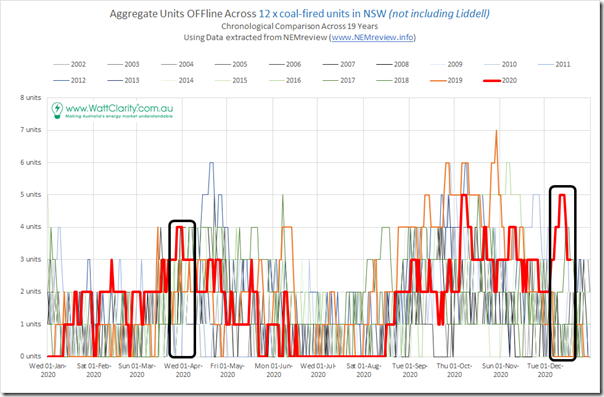
With 2 units offline at Liddell, but a peak of 7 in total across the 16 x NSW units, there were clearly 5 other units offline during the 12/13 Dec weekend just prior to the volatility last week:
Hence we thought we’d dig a bit further…
C3) Individual NSW Coal Units
In the following table, we look at each of the 16 x units individually. In doing this I have made use of both:
(a) Peak Daily Availability used above (note I have not had time to delve into much raw 5-minute data, so keep this in mind in the commentary below);
(b) I have used Time-Travel in ez2view and the new ‘MT PASA DUID Availability’ widget to wind back the clock to various points (noted below) to see whether the outage was planned in advance (i.e. submitted to MT PASA in advance in their bid).
| BW01 |
In terms of the stats above, Bayswater unit 1 was operational through December. The peak daily availability did vary slightly between days … perhaps due to high temperature effect on peak output capability. |
| BW02 |
Bayswater unit 2 commenced outage on 8th December. Somewhat randomly choosing to time-travel the ‘MT PASA DUID Availability’ widget back to 1st November 2020, we see that the BW02 outage was slated to run, at that time, from 4th December through until 13th December. This provides clear evidence this outage was a Planned Outage … but we also noted that the start date (and presumably the end date) was pushed back a few days. The plant is still offline at the time of this article. |
| BW03 |
Same as the case for BW01, unit 3 was operational through December. The peak daily availability did vary slightly between days … perhaps due to high temperature effect on peak output capability. |
| BW04 |
This unit has been offline since 30th October. Given the start date of the outage, we time-travel back to 1st October 2020 and, at that time, we see a 14-day outage planned for BW04 to commence on 17th October. So clearly: If we learn more about the complication we’ll add a further note in here. |
| ER01 |
In terms of the stats above, Eraring unit 1 was operational through December. The peak daily availability did vary slightly between days … perhaps due to high temperature effect on peak output capability. |
| ER02 |
In terms of the stats above, Eraring unit 2 was operational through December. The peak daily availability did vary slightly between days … perhaps due to high temperature effect on peak output capability. |
| ER03 |
This unit had an outage from 4th December through until Tuesday 15th December. With the widget still time-travelled back to 1st October 2020, the window (at that time) did not show any outage planned for Eraring unit 3 in December 2020. However from at least as early as 25th November (have not bothered to find which particular run beforehand) there was a short 8-day outage planned from 3rd December to 11th December. An illustration of the complexities involved in trying to assign a binary ‘Planned’ or ‘Forced’ outage description onto outages like this. Also worth noting that, in the article from Tuesday last week, we also noted a trip of this unit as it was coming back online, providing one of the factors leading to the price spike that day. |
| ER04 |
In terms of the stats above, Eraring unit 4 was operational through December. The peak daily availability did vary slightly between days … perhaps due to high temperature effect on peak output capability. |
| LD01 |
This unit was offline from the afternoon of the 1st December to Thursday 17th December. With time travel still set at 25th November, there is no outage appearing in MT PASA for Liddell unit 1 for December. We see the outage also starts with a trip, so are guessing that this is a Forced Outage. |
| LD02 |
This unit has been offline since 10th October. Time-travelling back to 1st September we see that an outage starting 10th October was a Planned Outage even back that far. However the expected return date given then was 4th December, and the unit is still not back – hence we surmise some complication has been encountered. If we learn more about the complication we’ll add a further note in here. |
| LD03 |
This unit is the one that tripped on Thursday 17th December (with the transformer incident), providing one factor that contributed to the price volatility on the day. |
| LD04 |
This unit has been operational through December |
| MP1 |
This unit has been offline since 26th September. With the widget time-travelled back to 1st September, we see the outage was a Planned Outage that was: —– PS Tuesday 22nd Dec – was interesting to note some discussion about MP1 in today’s article in the AFR. |
| MP2 |
In terms of the stats above, Mt Piper unit 2 was operational through December. The peak daily availability did vary slightly between days … perhaps due to high temperature effect on peak output capability. |
| VP5 |
Vales Point unit 5 was out on outage from Thu 10th December through until Wednesday 16th December. With the widget time-travelled back to 1st September, there is no outage visible in the plans for VP5. If we time-travel forward to 1st December we still can’t see any outage planned. Rebid reasons on 10th December mention ‘VP5 has tube leak’, so it’s easy to classify this one as a Forced Outage. |
| VP6 |
This unit has been operational through December. |
Readers will (hopefully!) understand the value of having access to the two core data sets in the completion of this analysis:
Data Set #1) Includes much historical information that has been public (or at least Next Day Public) for many years – particularly unit output and (for Scheduled Plant) plant availability, and unit bids.
Data Set #2) Is data that has only become available late in 2020 thanks to a rule change promoted by ERM Power (and despite what I understand from various parties was some focused resistance from some points within AEMO, for reasons I am not able to really understand). It will shortly be available to our clients in ez2view version 8.
With these two data sets, we’re able to at least have a chance at unpicking some of the reasons behind the slump in aggregate coal plant availability in NSW … which was one of the factors contributing to price volatility last week.
(D) One final note
I’ve run out of time to drill further, today, so do appreciate that the above may not be specific enough for some readers – particularly those coming with the (perhaps simplistic) mindset that there must be some overarching factor that drove coal plant availability down in December, creating pre-conditions that enabled prices to spike (including with the ER03 trip on Tuesday and the LD03 trip on Thursday).
Sorry for the disappointment – but, as noted before, the real world is somewhat more complex than simplistic mental models.


Leave a comment